Abstract. A technology for automatically creating and adding sound to interactive CG animations of spark discharges in an efficient way has been developed.
The Journal of the Society for Art and Science Vol. 7 No. 4 pp. 145 - 154
Generating Spark Discharge Sound for Interactive Animation using WM-wave Katsutsugu Matsuyama†, Tadahiro Fujimoto‡, and Norishige Chiba‡ †Future University-Hakodate, ‡Iwate University Abstract A technology for automatically creating and adding sound to interactive CG animations of spark discharges in an efficient way has been developed. In the procedure proposed in this paper, the user inputs the electric charge distribution, boundary conditions and other parameters affecting the initiation of electric discharges in virtual space. The animation of the discharge is then created by generating and rendering the profile of the discharge pattern. The sound synchronized with the animation is automatically generated in an efficient way. The noises generated by spark discharges are shock waves, which exhibit complicated behavior; however, in this study, an empirical profile for a shock wave is employed to efficiently generate the acoustic waveform. Effective procedures for expressing lightning discharges and continuous discharges are also proposed. In this paper, we present the details of our technique and demonstrate its effect and efficiency by giving many experimental examples. We investigated the parameters and waveforms employed in this study to demonstrate the validity of this procedure. Keywords: Natural Phenomena, Real-time Graphics, Sound Modeling, Spark Discharge 1. Introduction The natural phenomenon of spark discharges is often added to movies as visual effects (VFX) or special effects (SFX) in the form of computer graphics (CG). Several CG procedures have been proposed for expressing spark discharges [1-9]. However, few studies have proposed techniques for simulating the sound of thunder and there are currently no techniques available for the dynamic creation of effective noise that can be used in interactive content such as virtual reality. This paper describes a CG algorithm that includes resource management and a procedure for interactively simulating the spark discharge sounds for use as interactive content (Fig. 1). The inputs of this procedure are parameters related to the initiation of spark discharges, such as the electric charge distribution and the boundary conditions in virtual space. The discharge profile, rendering and audio are all created in interactive rate. The real-time animation method proposed by Matsuyama et al. [8] is used for generating and rendering the discharge profile. In this paper, a procedure for generating the sound is proposed. The noises generated by spark discharges are shock waves. Shock waves exhibit complicated behaviors; in this study, however, waves were experimentally generated using a known shock wave profile. It is an extremely difficult problem to create realistic sound effects. In this study, (a) the sound generation process was performed intermittently on a thread; (b) the nonlinear behavior of the shock wave and the sound generated by the acoustic line source were efficiently calculated; (c) a statistical procedure for efficiently expressing a spark discharge in dart leaders was used; and (d) a procedure for effectively expressing continuous discharges was used to perform audio generation without sacrificing precision in the calculated acoustic wave profile. An experiment was carried out to verify that this procedure is practical and can be employed with practical parameters and waveforms. Since the model permits a wide range of arbitrary settings for the charge distribution and boundary conditions, it is possible to generate almost any desired discharge pattern, image or sound. Interactive generation of these phenomena will enable them to
Fig. 1. Example of lightning and thunder produced using this method. be used interactively in virtual reality applications such as interactive art and disaster simulations. This paper is a more detailed and extended version of a previously published paper [10]. The system we have developed is mainly based on the ceraunoscope proposed by Glassner [4]. This current paper discusses the following points: ·The new system, including details of the algorithm. ·Experiments and other investigations of the extendability of this procedure and its parameters. · Examination and comparison of the effectiveness of this procedure for simulating discharge sounds of spark balls, plasma ball discharges and thunder. 2. Related Research Sound generation techniques in the CG field can be classified as sound modeling and sound rendering techniques [11]. Sound modeling involves calculating the profile of a generated wave based on the profile, material and other characteristics of the acoustic source. Many procedures have been proposed, including adding effective audio for shock, friction or rotation of rigid bodies [12], measuring actual acoustic sources [13], creating sounds after making small geometric modifications of the sources, using a nonlinear finite - 145 -
The Journal of the Society for Art and Science Vol. 7 No. 4 pp. 145 - 154 element method [14], pre-processing to enable a system to simulate the natural rigid-body vibration modes of the components at interactive speeds [15], calculating effective sounds for wind [16] and flames [17]; calculating effective sound for trees moving under a high wind [18], and creating waveforms that take the effects of diffraction and reflection into consideration [19]. Sound rendering employs simulations of acoustic propagation to calculate how acoustic sources in virtual space are related to the listener’s location. Many CG-related studies address such implementations in real time. Procedures have been described for applying the beam tracing method [20-24] and managing acoustic sources by employing clustering [25]. Glassner proposed a procedure for automatically generating thunder in CG [4]. This is a follow-on study to a previous study [3] in which a method was presented for creating thunder that matched the shape and pattern of lightning. It was a groundbreaking study, but it was intended only to simulate lightning discharges and did not consider the application to animation. In this study, we extend Glassner’s method to interactive animation. In this paper, we discuss the algorithm configuration for implementation and we present a procedure that includes resource allocation. In particular, by using a WM-wave (see Section 4) for a line source of a spark discharge and by avoiding waveform calculation of repetitive discharge, the efficiency of procedures can be enhanced. Most of the reported methods for simulating discharge phenomena in CG simulate lightning discharges and propose methods for reproducing those patterns. They can be divided into those methods that are applicable to animation and those which are not. Some of the methods for simulating lightning patterns that are not applicable to animation are as follows: a method using geometric parameters, including the length and angle [2]; a method using data measured from photographs of actual lightning [3]; and a model creating discharge patterns based on the electric charge distribution and electric field theory [6]. Kim et al. have proposed methods for generating animated versions of lightning based on calculations of electric fields [7], [9]. These adopt a physical approach with solutions to the Laplace equation, but they have the drawback that every advance of the leader (see Section 3), i.e., with every addition of an element to the tree structure data, another solution must be calculated for the updated Laplace equation. Thus, these cannot be employed for real-time implementations. A method for simulating spark discharges in real-time animations was published last year [8]. This method utilises the characteristics of a previous operational procedure for matrices and vectors, and it that uses a GPU [26] to calculate the electric field and create a
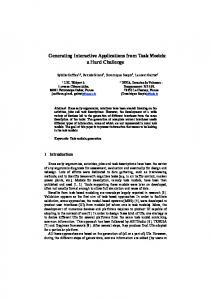
discharge pattern in real time. In this present study, we generate sounds that correspond to the discharge patterns described by Matsuyama et al. [8]. Rendering procedures appropriate for polygonal models cannot be directly employed to render discharge phenomena. Reed et al. treated the discharge paths as luminous elements [1]. Others have presented an efficient method for rendering lightning, which incorporates the effect of clouds and atmospheric diffusion on the apparent luminosity of spark discharges [5]. 3. Mechanisms of Spark Discharges and Shock Waves This section describes the mechanisms associated with the initiation of spark discharges and of the acoustic shock waves that accompany them. For more details, refer to references [27] and [28]. 3.1 Mechanisms of Spark Discharges This section briefly summarizes the mechanisms of spark discharges, with an emphasis on lightning discharges. Spark discharges occur when extremely high voltages are applied to insulators and cause them to break down. In insulator breakdown, the molecules of the insulator are dissociated into electrons and ions. These particles carry electric charge, and their motion dictates the electric current flow. Both light and sound are emitted when the molecules are dissociated. Lightning is a spark discharge that involves the breakdown of air, which acts as the insulator. It is a natural phenomenon that occurs in thunderclouds. A thunderbolt consists of one or more discharges called lightning strikes. Each lightning strike consists of a leader and a return stroke. A leader is the initial discharge that occurs when the air undergoes breakdown, and the return stroke is a discharge in the opposite direction that follows the same path as the leader. In a cloud-to-ground leader (Fig. 2), the typical form of thunderbolts, the negative charge accumulating on the underside of the cloud induces a strong positive charge on the ground under the cloud, and the voltage between the two accumulations of charge induces break down of the air insulator. A leader proceeds from the negatively charged area of the cloud downward toward the ground at a relatively low speed. At the same time, the negative charges from the cloud flow to the leader and distribute themselves along the path opened by the leader. The light emitted by this process is relatively weak. When the leader reaches the ground, the return stroke ascends along the same path taken by the leader, and an intense light is emitted during this process. Simultaneously, the negative charges distributed along the leader are neutralized by the positive charges from the ground. This is the initial strike. There may be a single or several
Fig. 2. Leader in cloud-to-ground lightning.
Fig. 3. Stepped leaders and dart leaders [28] - 146 -
The Journal of the Society for Art and Science Vol. 7 No. 4 pp. 145 - 154
Fig. 4. Block diagram of algorithm and example of data.
Fig. 5. Sound production process. strikes. The thunderbolt ends when the entire charge in the cloud has been neutralized by the induced positive charge. When a thunderbolt consists of multiple strikes (Fig. 3 shows an example of a triple strike), the first leader is called the “stepped leader”, and the subsequent ones are called “dart leaders”. The path taken by the first strike is strongly dissociated by the return stroke and has a high conductivity, but the concentrations of electrons and ions decrease with time; thus, if a subsequent leader in the same path causes no dissociation, there is no subsequent return stroke. However, the air does retain a low level of conductivity; so a dart leader may occur along approximately the same path as the stepped leader. The characteristics of the thunderbolt illustrated in Fig. 3 affect the shape and pattern of the continuous spark discharge and it is this that generates the sound. 3.2 Shock Waves in Spark Discharges “Spark discharge sound” is caused by an electrical discharge. An immense charge flows through the air in a short time in this phenomenon. This flow of charge rapidly heats the air in the discharge path (the path(s) taken by the lightning) to very high temperatures, causing the air to expand explosively giving rise to a shock wave. The shock wave from this explosive expansion is the source for what we hear as spark discharge sound. The spark discharge that nature causes is “lightning”, and the sound radiated by the lightning is “thunder”. In this paper, our method generates the spark discharge sound including the thunder. Within a few meters, the shock wave dissipates almost 99 percent of its energy into heating the air [4]. The 1 percent that remains travels through the air at the speed of sound, but now as a more normal, though intense, acoustic wave. The shape of the shock wave exhibits a complicated behavior, but it frequently approximates an N-wave (to be explained in 4.2.2) condition during propagation [29]. Thunder is generated by a lightning discharge. Potentials that produce thunder and lightning are believed to be approximately 100 MV. At close ranges thunder sounds like an explosion,
while at greater distances, due to multiple reflections from the ground and other elements, it has a rolling, drawn-out sound. Thunder closely relates to the lightning pattern. Recording thunder with two or more microphones simultaneously, three-dimensional distribution of sound sources can be calculated [28]. The term “Shock wave” generally refers to a pressure wave in a compressible medium such as air that travels at a speed greater than that of sound. Examples of phenomena that cause shock waves of various kinds, include the bursting of a balloon, the firing of a bullet, the eruption of a volcano and thunder. 4. Algorithm Configuration In this section a procedure is proposed for interactive animation of both the appearance and the sound of spark discharges. The user inputs the charge distribution and boundary conditions throughout the three-dimensional virtual space. Figure 4 shows a diagram illustrating the algorithm. The electric field is constructed based on the input data, and the pattern of the spark discharge is generated using the calculated field. These are rendered to obtain the final image. The sound is generated simultaneously with the above procedure. These processes must be performed interactively in order to realize an interactive simulation. Section 4.1 provides a simple description of the process for creating the discharge pattern [8], and Section 4.2 discusses algorithm design for implementation and describes each of the processes for generating the sound. 4.1 Real-time Production of Spark Discharges The following is a procedure for expressing a spark discharge with CG in virtual space, using a user-entered charge distribution and boundary conditions. The electric field is constructed using the data input by the user. The shape and pattern of the spark discharge is generated using the charge distribution and then it is rendered. This section presents a simple explanation of how the discharge pattern is generated in order to explain how the sound is created. - 147 -
The Journal of the Society for Art and Science Vol. 7 No. 4 pp. 145 - 154 The electric field is constructed using the inputted charge distribution and boundary conditions. The value of the electric potential φ is defined for each point of a grid in the virtual space; φ is set to appropriate values where the charge or the boundary condition is already defined. Thus, we can assume that the charge density of Poisson equation is equal to zero so that the potential in the remaining portions of the virtual space are determined numerically using the Laplace equation: (1) ∇ 2φ = 0 The numerical solution for the Laplace equation is obtained from a simultaneous linear equation. Here, the simultaneous linear equation is solved using an operational method [26] employing matrices and vectors in a programmable GPU. It holds matrices, vectors and scalars as texture data and the calculations are performed at a high speed in texture operations in the fragment program of the GPU. The pattern of the discharge is generated using the constructed electric field. The discharge pattern is calculated by simulating the progress of the leaders, as described in Section 3. The data structure of the discharge pattern is tree-shaped, and the leader, whose negative charge location is the point of origin, is the root. The leader proceeds according to the potential φ in the electric field; at each current position, the leader proceeds with the highest probabilities to locations in its vicinity that have the highest potentials φ . In the leader progress process, n-candidate points to which the leader will advance are prepared. The candidate points are assigned in the area subtended by the angle ρ in the progation direction of the leader. The following expression assigns the probability ui to the ith candidate location: (2) γ
ui =
(φi )
∑ (φ ) n
j =1
γ
j
where γ is an adjustment factor for the electric potential and ui is the probability the point lying on the discharge path. The parameters n, ρ and γ are selected by trial and error: in our case, n = 8, ρ = π/2 and γ = 2.5. This process is repeated until the path reaches the location of the positive electric charge. 4.2 Process of Sound Production This section describes the procedure for generating the sound accompanying the spark discharge. Section 4.2.1 provides an outline of the audio generation process, and Section 4.2.2 describes the procedure for generating the profile of the shock wave. The procedures for generating the sound effects are explained for the case of a lightning strike in Section 4.2.3 and for recurring discharges in Section 4.2.4. 4.2.1 Overview of Sound Production Processes In this section, we discuss and describe the processes used for
realizing effective sound generation. Figure 5 shows the process for generating the discharge sound. The inputs for this are the discharge profile created in Section 4.1, the time of the discharge, and the listening point. The sound heard by an observer at the listening point is generated and stored in the audio buffer. The sound generation calculations are carried out asynchronously and intermittently on a different thread from other processing in order not to cause any delays, and the discharge pattern is output to the audio buffer as a complete waveform immediately as it is generated. This is discussed in Section 5.2. However, thunder contains a large number of segments and the complete calculation of the waveform requires about 800 [ms]. It is quite common for the sound to take a considerable length of time to propagate to the listening point; if the processing time is less than the propagation time, there is no problem, but when the propagation time is shorter (i.e., if the distance between the thunderbolt’s location and the listening point is less than 0.8 [s] × 343 [m/s] = 274 [m]), there is a delay in the delivery of the sound to the user. The relationship of the listening point to the discharge segment can be employed for clustering waveforms according to arrival time. An on-the-fly equation can be formulated for generating each audio clip for the cluster corresponding to the expected arrival time when the audio is generated intermittently, but if any cluster is delayed due to processing of a particularly large number of segments, it will cause a “blank spot” in the thunder sound. That approach was not used in the proposed method; rather the waveform is calculated precisely, even though this results in a delay due to calculation. In this study, the sound was generated intermittently in a process that managed the audio buffer, the audio device and the time. The process was governed by the user-specified time interval and device conditions. The user must be aware that the time interval refers to the time interval between the sound reaching the audio buffer and it reaching the audio device. For a longer interval, the delay between initiation of the discharge and sound is clearly perceptible; for a short interval, the fraction of time consumed by communication with the devices becomes excessively large, and the algorithm does not function efficiently. The interval was set to 30-100 [ms] in this study. 4.2.2 Calculation of Spark Discharge Waveforms The waveform is generated while referring to both the discharge profile and the listening point. As described in Section 3, the sound emitted by an electric discharge is a shock wave. The shape of the shock wave exhibits a complicated behavior, but it frequently approximates an N-wave (so called because its waveform resembles the letter “N”) condition during propagation (Fig. 6). An N-wave is generated by nonlinear behavior. The waveform becomes elongated as the sound propagates, and it decays faster than for linear behavior [29].
Fig. 6. The N-wave.
Fig. 7. Acoustic line source and the WM-wave. - 148 -
The Journal of the Society for Art and Science Vol. 7 No. 4 pp. 145 - 154 Let us begin with the case of an N-wave generated from an acoustic point source. The maximum acoustic pressure ps and the duration T (here, half the wave period will be termed the “duration” or “T”) are calculated from the distance r between the source and the observation point using the following expressions: (3) r0 p s 0
ps =
r 1 + σ 0 ln (r r0 )
(4)
T = T0 1 + σ 0 ln (r r0 )
where r0 is the baseline distance, ps0 is the baseline acoustic pressure and T0 is the baseline duration. σ0 is a common parameter in both expressions. Its value has been measured to be 0.524 in a weak discharge with r0 = 10 [cm] [29]. In this study, σ0 = 0.524 was used, but the values of other standards must be determined according to the scale of the discharge. The waveform caused by the acoustic point source is assumed to be the N-wave determined by the distance between the source and the observation point. Let us turn to the form of the shock wave emitted from an acoustic line source. A “WM-wave” [4, 30] (this nomenclature comes ref. [30]) refers to the waveform emitted when an acoustic point source is stretched into an acoustic line source. A WM-wave is obtained by integrating an N-wave over a line. Although an N-wave is introduced by assuming the nonlinearity [31], Wright showed that there is good matching between the theoretical values of WM-wave and the observed values [30]. Problems arise if a segment of the discharge path is treated as a point source (it increases the calculation cost and causes aliasing), so the discharge path was treated as a succession of line sources here. In order to find the form of the WM-wave, Wright et al. integrated the line source on the assumption that the distance to the observation point was considerably greater than the length of the line. That shape of the wave is expressed as follows: (5) When s < ψ,
⎧0 ⎪− (B s )(τ + s )2 −ψ 2 ⎪⎪ p = ⎨− 4 Bτ ⎪(B s )(τ − s )2 −ψ 2 ⎪ ⎩⎪0
[
[
]
]
−ψ − s −ψ + s
ψ −s ψ +s
τ


![([PDF]) Designing Sound for Animation Full Ebook By ... - Google Sites](https://m.moam.info/img/260x300/pdf-designing-sound-for-animation-full-ebook-by-go_647854fd097c4737708cb06c.jpg)

