Proceedings of the International MultiConference of Engineers and Computer Scientists 2011 Vol I, IMECS 2011, March 16 - 18, 2011, Hong Kong
Generating State-based Polymorphic Interaction Graph from UML Diagrams for Object Oriented Testing Ching-Seh Wu, Wei-Chun Chang, Sangsig Kim and Chi-Hsin Huang
Abstract— Object Oriented (OO) features such as inheritance, polymorphism, and dynamic binding provide not only efficient development of software for even complex system, but also new challenges for software testing. Recently, more and more researchers have realized that UML models can be a source for software testing. We propose POLYmorphism State SEquence TEst Model (POLYSSETEM) generated from Class, Sequence, and State Chart diagrams for testing state-based polymorphic methods between objects for OO testing. Index Terms— OO Testing, Polymorphic Interaction Graph, UML, Software Test Modeling
I. INTRODUCTION
O
BJECT Oriented (OO) Design provides three main features to improve the quality of software development-i.e., inheritance, polymorphism, and dynamic binding. However, on the other hand, these features make traditional software testing difficult to adapt to OO based software testing. To resolve the challenges, several approaches have recently been proposed, and one of them is that test cases are generated from UML diagrams, such as a Sequence Diagram, a State Chart Diagram, and an Activity Diagram, and so on. It is obvious that the generation of test cases at an early stage of the software development process, especially design phase, makes coding and testing executed in parallel as well as early detection of a fault. Debasish Kundu et al. [1] proposed an approach for system testing with prioritized test cases generated from a Sequence Diagram. Shaukat Ali et al. [5] proposed a state-based technique that combines Collaboration and State Chart Manuscript received December 07, 2010; revised January 08, 2011. Ching-Seh Wu is an Assistant Professor in the Department of Computer Science and Engineering at Oakland University, Rochester, MI 48039, USA. His current research interests include Software Engineering, Software Testing, Web Service, and distributed computing. (e-mail:
[email protected]). Wei-Chun Chang is an Assistant Professor in the Department of Computer Science and Engineering at Oakland University, Rochester, MI 48039, USA. His current research interests include Software Engineering, Web Service, and Evolution Computing. (e-mail:
[email protected]). Sangsig Kim is a doctoral student in the Department of Computer Science and Engineering at Oakland University, Rochester, MI 48039, USA. He is currently working on his research in the area of Software Software Modeling. (e-mail:
[email protected]). Chi-Hsin Huang is a doctoral student in the Department of Computer Science and Engineering at Oakland University, Rochester, MI 48039, USA. He is working on dissertation research in the area of Software Testing and Web Service. (e-mail:
[email protected]).
ISBN: 978-988-18210-3-4 ISSN: 2078-0958 (Print); ISSN: 2078-0966 (Online)
Diagrams to automatically generate test cases. Monalisa Sarma and Rajib Mall [4] proposed a methodology to generate test cases from Use Case and Sequence diagrams. Huo Yan Chen et al. [3] proposed approaches to transform UML Interaction Diagrams into contract specification for OO testing. However, none of approaches deal with polymorphic information during OO testing. A Sequence Diagram which describes interactions between objects does not include polymorphic information, and the information is described by a Class Diagram. Therefore, both Class Diagram and Sequence Diagram need to be combined to be transformed into a polymorphic graph for polymorphic integration testing. Zhou Hang et al. [2] proposed a polymorphism graph, which is called Polymorphism Extend Class tuple Object Method Acyclic Graph (PECOMAG) generated from Class and Sequence Diagrams. Similarly, Zeng et al. [7] proposed Polymorphic Class of Interprocedural Restricted Control Flow Graph (PCIRCFG) for polymorphic testing created from Class and Collaboration Diagrams. However, these two approaches only focus on polymorphic testing, not including object states. There is no approach published so far from the research to deal with state-based polymorphic OO testing. This paper proposes an integration approach to resolve challenges problems for the state-based polymorphic OO integrated testing from Class, Sequence, and State Chart diagrams. The rest of the paper is organized as follows. Section 2 describes the proposed approach of State-based Polymorphic Interaction Graph. An example for the proposed approach is illustrated in section 3. Section 4 concludes the contributions of this paper. II. STATE-BASED POLYMORPHIC INTERACTION GRAPH A. Overall Process for OO Testing In this paper, we propose a general technique to test the interaction among classes as described in Figure 1. At first, we check consistency between two different UML diagrams. Then we try to combine UML diagrams to generate Graph which is an intermediate testing model. The Graph then is used to generate Test Paths based on coverage criteria. The testing objective is implemented by generating a graphbased testing model and by covering all paths in the model. The proposed technique can be applied during the
IMECS 2011
Proceedings of the International MultiConference of Engineers and Computer Scientists 2011 Vol I, IMECS 2011, March 16 - 18, 2011, Hong Kong integration test phase, right after the completion of class testing. It consists of the following four steps: Graph Generation: Before constructing the graph, a consistency among UML diagrams (ex. Sequence diagram and State charts) has to be checked. If the two UML diagrams are inconsistent, the generated graph will contain some problems which may lead to generation of incorrect test paths. Tools such as IBM Rational Rose can be used for checking the consistency. After checking consistency between UML diagrams, the graph can be constructed from UML diagrams. Test paths Generation: The test paths are generated from the Graph based on several alternative coverage criteria (ex. Single-Path, AllTransition, n-Path, All-Path coverage [8]). Test Execution: All selected test paths execute with test data and object state invariants. Test data are generated manually and object states are determined using state invariants. Object states will be recorded in Execution Log through test executor. Result Evaluation: Result evaluator compares the object states in the execution log with the expected object states.
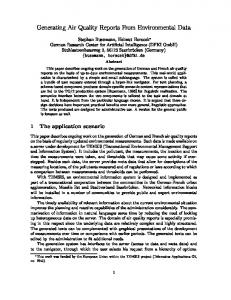
information is describes in the PECOMDAG. Finally, for the POLYSSETEM generation, definitions used in PECOMDAG approach are extended. Figure 2 shows how to generate POLYSSETEM, and the following subsections deals with each generation in detail.
Fig. 2. POLYSSETEM generation. .
Fig. 1. Overall process for OO testing.
B. POLYSSETEM Generation Of four steps in the overall process, the graph generation step which is related to the rectangle box in Figure 1 is only focused in the paper. Generating the graph, which is called POLYmorphism State SEquence TEst Model (POLYSSETEM), for state-based polymorphic OO testing consists of three steps: State Sequence TEst Model (SSETEM) generation, Polymorphism Extend Class tuple Object Method Acyclic Graph (PECOMDAG) generation, and POLYSSETEM generation. The SSETEM generation is based on Shaukat’s approach. Shaukat Ali et al. [5] proposed how to generate a graph called State Collaboration TEst Model (SCOTEM) from collaboration and State Chart diagrams. A sequence diagram can be used instead of a Collaboration Diagram, since the Collaboration Diagram basically describes the same information as the Sequence Diagram. However, there is no way to describe polymorphic information in the SSETEM. This is the reason why the SSETEM needs to be combined with the PECOMDAG proposed by Zhou Hang et al. [2]. The polymorphic
ISBN: 978-988-18210-3-4 ISSN: 2078-0958 (Print); ISSN: 2078-0966 (Online)
1) SSETEM Generation Shaukat Ali et al. [5] describe the way to create SCOTEM from State Chart and Collaboration Diagrams. Here, the way how to construct SSETEM is only described. Detailed information can be referenced in [5]. To construct the SSETEM model for newProblem(), starting from the sequence diagram. In the SSETEM, one or more vertices are created for each class in the Sequence Diagram. A class in Sequence Diagram consists of multiple vertices in SSETEM. And a class also represents various states in which class can receive the incoming messages. Vertices act as placeholders for objects and have labels form X@S for classes. The X is the class name and S is the state identifier as represented in the state chart. For example, the label StopWatch@Running shows as an instance of the StopWatch class and the state is Running at this vertex. For non-modal classes, vertex labels form X@X. For example, the label ProblemGenerator@ProblemGenerator would be written for the ProblemGenerator vertex. The null vertex in Figure 3 is a dummy vertex that models an external message. The message edges present as a solid line and are labeled with the message sequence numbers as in the sequence diagram. The transition edges present as a dotted lines and are labeled with a condition. Some of test model through SSETEM generation is captured in Figure 3. The Coordinator object invokes updatePerformance method defined in PerformanceRequlator class if a size of the value returned from ProblemGenerator object is not zero (1.2). However, given that PerformanceRegulator class is defined as an inheritance relationship and the updatePerformance method
IMECS 2011
Proceedings of the International MultiConference of Engineers and Computer Scientists 2011 Vol I, IMECS 2011, March 16 - 18, 2011, Hong Kong is defined as polymorphic method by a child class, such polymorphic information between parent and child classes cannot be described in the SSETEM. Prior to dealing with the problem, several definitions used in the PECOMDAG generation need to be observed.
illustrated. Figure 4 and Figure 5 show a Class Diagram and a Sequence Diagram for the landedOn method, respectively. For the example, CSPM(Square, landedOn) and vertices for the Sequence Diagram as follow in turn.
Player
Square
location
+landedOn()
RegularSquare +landedOn()
GoSquare +landedOn()
IncomeTaxSquare +landedOn()
Fig. 4. Class diagram for polymorphic landedOn
p:Player
:Cup
:Board
loc:Square
takeTven roll
Fig. 3. SSETEM from SSETEM generation.
2) PECOMDAG Generation Zhou Hang et al. [2] proposed how to create PECOMDAG from Class and Sequence diagram to describe polymorphic interaction testing. All definitions specified in the paper are a kind of summary which is important to understand the extended definition in POLYSSETEM. A Class Tuple of a class (c) is defined as follows: CT(c) = < class name, {}, {}, {}, {}> The Class Set of Polymorphic Methods (CSPM) is defined as the following form: CSPM(c, m) = { CT(ci) | c {< Parent CT >} of ci m {< newMethod >} of ci} U {CT(c)} In order words, CSPM(c,m) is to return a class set whose member has polymorphic methods in an inheritance relationship. For example, let class A be a parent class and m() method is defined in the A class. Let class B, C, D be a child class of the A class and each class has m() method in the polymorphic format. Then, CSPM(A,m) is {CT(A), CT(B), CT(C), CT(D)}. The Object Method Directed Acyclic Graph (OMDAG) represents the dynamic information in a sequence diagram. The OMDAG is a tuple where V is a set of vertices, E is a set of edges, and s is the starting vertex. Each vertex is defined as the tuple v = , where o is an object, m is a method, ARGS is a set of arguments, and c is a class name. The tuple v can be extended as follows, with combining a class tuple. v = where CT(c1) is the class which object o is its instance, and CT(c2) is the class which includes called m. The combined tuple v is also extended as follows for representing polymorphic information: EV = { | c2 CSPM(c,m)}. An example for the PECOMDAG generation is
ISBN: 978-988-18210-3-4 ISSN: 2078-0958 (Print); ISSN: 2078-0966 (Online)
tvTot=getTotal
loc = getSquare(loc,fvTot) landedOn(p)
Fig. 5. Sequence diagram for landedOn
CSPM(Square, landedOn) = {CT(Square), CT(RegularSquare), CT(GoSquare), CT(IncomeTaxSquare)} v1 = S = v2 = v3 = v4 = V = {v1, v2, v3, v4} From above information, COMDAG for the sequence diagram is described as Figure 6. The result of PECOMDAG for the polymorphic information is shown in Figure 7.
Fig. 6. COMDAG
IMECS 2011
Proceedings of the International MultiConference of Engineers and Computer Scientists 2011 Vol I, IMECS 2011, March 16 - 18, 2011, Hong Kong v1.22 = v1.23 = … V = {v1, v1.1, v1.1.1, v1.1.2, …, v1.2, v1.21, v1.22, v1.23, …}
Fig. 7. PECOMDAG.
3) POLYSSETEM Generation The POLYSSETEM is generated from SSETEM and PECOMDAG. For representing state and polymorphism information, an extended vertex needs to be defined. A definition of the extended vertex is as the following form: V = { | c2 CSPM(c,m)} A definition of an edge is the same as one of PECOMAG. E = { < vi, vj > | vj v} U {< vj, vk > | vj v } Let class A, B, and C be a child class of PerformanceRegulator, and each class has overridden updatePerformance and three states, then POLYSSETEM will be shown in Figure 8.
A set of edges is as the following form: E = {, , , , …, , , , , …} Therefore, POLYSSETEM G = {V, E, null}
III. EXAMPLE A simple library system for verifying the approach is illustrated as an example. A simple specification in the library is as follows: Books and journals The library contains books and journals. It may have several copies of a given book. Some of the books are for short term loans only. All other books may be borrowed by any library member for three weeks. Members of the library can normally borrow up to six items at a time, but members of staff may borrow up to 12 items at one time. Only members of staff may borrow journals. Borrowing The system must keep track of when books and journals are borrowed and returned, enforcing the rules described above. From the specification, class diagrams and sequence diagram for library, and state chart diagram for book are described in Figure 9, 10, and 11, respectively. Book 1 is a copy of
1..* 1 0..* borrows/returns LibraryMember
Copy
Fig. 8. POLYSSETEM for updatePerformance()
For the POLYSSETEM, each vertex is defined as follows: v1 = S= v1.1 =
1 0..* borrows/returns MemberOfStaff
Journal
Fig. 9. Class diagrams for library.
v1.2 = v1.21 =
ISBN: 978-988-18210-3-4 ISSN: 2078-0958 (Print); ISSN: 2078-0966 (Online)
IMECS 2011
Proceedings of the International MultiConference of Engineers and Computer Scientists 2011 Vol I, IMECS 2011, March 16 - 18, 2011, Hong Kong
theLibraryMember:LibraryMember
theCopy:Copy
theBook:Book
aMember : BookBorrower borrow(theCopy)
v1= v2=
,
1: okToBorrow 2: borrow
v2.1= 2.1: borrowed
Finally, POLYSSETEM is created by combining SSETEM with PECOMDAG and is represented in Figure 14.
Fig. 10. Sequence diagram for borrow
returned() returned() not borrowable
borrowable
Borrowed()[last copy] Borrowed() [not last copy] Fig. 11. State chart diagram for class book.
First, SSETEM is generated from Sequence and State Chart diagrams and is shown in Figure 12.
Fig. 14. POLYSSETEM
IV. CONCLUSION
Fig. 12. SSETEM for library.
Secondly, CSPM (LibraryMember,borrow) = {CT(LibraryMember), CT(MemberOfStaff}, since LibraryMember and MemberOfStaff classes are an inheritance relationship from the class diagram and sequence diagram. Figure 13 shows PECOMDAG.
In this paper, our approach focuses on creating a graph from UML diagrams for state-based polymorphic testing; in other words, our main contribution is to generate POLYSSETEM from Class, Sequence, and State Chart diagrams for OO integration testing, representing states of objects and polymorphic information on the test model. For verifying our approach, the simple library example is illustrated. There are several works in the future: defining metrics for testing, creating test cases from POLYSSETEM, and doing more case studies for a verification of the graph generation.
REFERENCES [1].
[2].
[3].
[4]. Fig. 13. PECOMDAG for library. [5].
ISBN: 978-988-18210-3-4 ISSN: 2078-0958 (Print); ISSN: 2078-0966 (Online)
Debasish Kundu, Monalisa Sarma, Debasis Samanta, and Rajib Mall, System testing for object-oriented systems with test case prioritization, Software Testing, Verification, and Reliability, Indian Institute of Technology, 2009 Hang Zhou, Zhi-qiu Huang, Li Wang, and Liang Chen, Automated Metrics for Industrial Applications Software Polymorphic Interactions, 2008. Huo Yan Chen, Chuang Li, and T. H. Tse, Transformation of UML Interaction Diagrams into Contract Specifications for Object Oriented Testing, 2007. Monalisa Sarma and Rajib Mall, Automatic Test Case Generation from UML Models, International Conference on Information Technology, Indian Institute of Technology, 2007. Shaukat Ali, Lionel C. Briand, Muhammad Jaffar-ur Reman, Hajra Asghar, Muhammad Zohaib Z. Iqbal, Amaer Naddem, A state-based
IMECS 2011
Proceedings of the International MultiConference of Engineers and Computer Scientists 2011 Vol I, IMECS 2011, March 16 - 18, 2011, Hong Kong
[6].
[7].
[8].
approach to integration testing based on UML models, Information and Software Technology, 2007. Siros Supavita and Taratip Suwannasart, Testing Polymorphic Interactions in UML Sequence Diagrams, ChulalongKorn University, Thailand 10330, 2005. Yi Zeng, Lian-Ping Chen, Yan-Xin Chai, Xin Zhou, UML-based Approach to Generate Polymorphic Testing Sequence and its Implementation, World Congress on Software Engineering, Chongqing University, Chongqing 400030, 2009. Paul Ammann and Jeff Offutt, Introduction to Software Testing, 1st Edition, ISBN-10: 0521880386, Cambridge University Press, January 28, 2008.
ISBN: 978-988-18210-3-4 ISSN: 2078-0958 (Print); ISSN: 2078-0966 (Online)
IMECS 2011