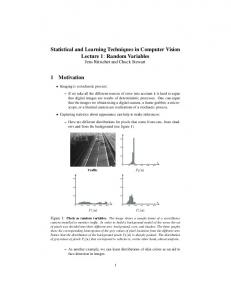
specification of the joint multivariate distribution is not necessary, is widely ... which gives a bivariate beta (or gamma) distribution where both components have ...
Generation of multivariate random variables with known marginal distribution and a specified correlation matrix Isidro R. Cruz_Medina1, Mucio Osório_Sánchez1 and Fernando García_Páez2
Abstract An algorithm for generating correlated random variables with known marginal distributions and a specified correlation is provided. This algorithm, in which the specification of the joint multivariate distribution is not necessary, is widely applicable and allows the generation of positively or negatively correlated random variables from any pair of marginal continuous distributions. It is a known fact that the maximum correlation coefficient between two random variables depends on the characteristics of their distributions, in this paper, a program code for obtaining upper and lower limits of the correlation coefficient for two given marginal distributions is given. An example for generating a sample from a trivariate distribution with positive and negative correlations and gamma marginals is provided. Keywords: Random vector generation, Multivariate distributions, Bivariate gamma distribution, Bivariate beta distribution, Marginal distribution.
1. Introduction.
A considerable amount of work has been done for generation of univariate random variables with some specific distribution. For the bivariate case, the generation of bivariate random variables is tightly connected with the problem of constructing bivariate distributions with specified marginals, this problem has been discussed by Placket (1967),
1 2
Instituto Tecnológico de Sonora, Cinco de Febrero 818, Cd. Obregón Son. CP 85000 México Universidad Autónoma de Sinaloa,
1
Mardia (1967), Moran (1969), Long and Krystofowics (1995) among others. Generating pairs of correlated random variables is not straightforward because for most of the distributions there is not a natural multivariate extension, for example, for the beta distribution, Loukas (1984) considers the 2-dimensional Dirichlet distribution as the bivariate beta distribution, but Magnussen (2004) considers that the condition that the sum of the two beta random variables are less or equal to one is very restrictive, this author also considers that the mixture approach given by Michael and Schucany (2002), which gives a bivariate beta (or gamma) distribution where both components have the same parameters, as a result, this fact limits the application domain of their algorithm. The algorithm proposed in this paper, uses the popular technique of introducing shared random variables for the generation of correlated random variables and does not require the formulation of the joint multivariate distribution. This algorithm is readily applicable for generating a random vector of heterogeneous continuous component variables (Park, 2004).
2. Description of the method. The following well known results are used for the generation of correlated random variables, in the first step any multivariate distribution can be used but the multinormal distribution is more convenient. 1. Dependence among variables in a multivariate standard normal distribution is completely specified by the correlation matrix (this property makes the multivariate normal distribution ideal for generating dependence among multivariate variables with distributions other than normal). 2. The cumulative distribution function (CDF) for any continuous univariate distribution has a uniform distribution U(0, 1), in the interval [0, 1]. This property allows
2
to obtain a random sample for any continuous distribution from a random normal sample using the uniform distribution as a bridge. 3. A correlated multivariate normal sample will generate, in most cases, a correlated multivariate sample for any given continuous distribution by means of the application of the quantile function to the CDF’s of normal sample. Nevertheless, it will be necessary to calibrate the correlation of the normal sample to obtain a target correlation on the specified marginal distributions.
3. Notation and definitions. The popular technique of introducing shared random variables may be used for generating a correlation coefficient for random normal variables U and V. Let T1, T2 and Z be three auxiliary independent normal variables with zero mean and variance given by:
T1 ~ N (0, 1 ) T 2 ~ N (0, 1 ) Z ~ N (0, )
If the target correlation is positive, define variables U and V as: U T1 Z ~ N (0, 1)
(1a)
V T 2 Z ~ N (0, 1)
(1b)
The correlation coefficient between variables U and V is equal to (E stands for the expected value operator): E (U V ) E ( T1 T 2 T1 Z Z T 2 Z 2 ) E ( Z 2 )
If the target correlation is negative, define variables U and V as:
U T1 Z ~ N (0, 1)
(2a)
3
V T 2 Z ~ N (0, 1)
(2b)
The correlation coefficient between variables U and V is: E (U V ) E ( T1 T 2 T1 Z Z T 2 Z 2 ) E ( Z 2 )
Let U T=(U, V) be the transpose of column random vector U which has a bivariate standard normal distribution [see, for example, Casella and Berger (1990)] given by (3): f (u , v)
1 1 Exp u 2 2 u v v2 2 1/ 2 2 2 (1 ) 2 (1 )
(3)
Where Exp is the exponential function and is the correlation parameter for random normal variables U and V. Let X T = ( X , Y ) be the transpose of column vector X, whose components X and Y, follow the specified marginal PDF given by (4):
f X ( x ; 1 )
(4a)
fY ( y ; 2 )
(4b)
where i , i = 1, 2 is a column vector of t parameters. For example, for the gamma family, t=2, and i
T
( i , i ) ; i and i are the scale and shape parameters
respectively of the gamma distribution. The corresponding CDFs for variables X and Y are given by equations (5): FX ( x;1 ) FY ( y; 2 )
x 0
y 0
f X (t ;1 ) dt
(5a)
f Y (t ; 2 ) dt
(5b)
Variables X and Y can be obtained from variables U and V with the element-wise oneto-one transformation (6): X FX1 (u )
(6a)
Y FY1 (v)
(6b)
4
where (r ) stands for the standard normal CDF given by (7). r
(r ) (2 ) 1 / 2 Exp 1 / 2 t 2 dt 0
(7)
For the generation of random samples for variables X and Y it is not necessary to specify their joint distribution, following Moran’s [7] method for obtaining a bivariate gamma distribution, Cruz_Medina and Salazar_Gómez (2007) present the bivariate density function for X and Y, given by: f XY ( x, y )
( u ) 2 2 u v ( v ) 2 Exp f X ( x; x ) f Y ( y; y ) 2 ( 1 2 ) (1 2 ) 1
(8)
where u and v are observations of variables: U 1 FX ( X ) and V 1 FY (Y ) which are defined as the inverse transformation for (6a) and (6b) respectively.
4. Obtaining a target correlation coefficient A target correlation S among random variables X and Y can be obtained by selecting an appropriate value between variables U and V. Correlation S is:
S E FX1 (U ) x
F (V ) / 1 Y
y
X
Y
A second-order Taylor series approximation for transformation (6a) at U=0 will give an approximate relationship between and S . ~
[ f z (0) ]2 f x' ( x ) f z (0) F (U ) F (0) U U2 1 1 3 f x [ FX [ (0)] ] 2 [ f x [ FX [ (0)] ] ] 1 X
1 X
~
~
x
f z ( 0) ~
fx ( x )
U
[ f z (0) ]2 f x' ( x ) ~
2 [ fx ( x ) ]3
~
U 2 x a x U bx U 2
Then,
S X Y d x d y a x a y bx d y E ( U 2 ) b y d x E ( V 2 )
5
(9)
a x b y E ( U V 2 ) a y bx E ( U 2 V ) bx b y E ( U 2 V 2 ) ~
where z and z are the median and mean, respectively, for variable Z= X, Y ; ~
d z z z , a z and b z are defined in equation (9). As E ( U V 2 ) =0, E ( U 2 V ) =0
and E ( U 2 V 2 ) 1 2 , it follows that: ~
S
~
( x x ) ( y y ) bx d y b y d x bx b y ( a x a y bx b y )
X Y
(10)
Expression (10) says that S depends on the symmetry of the PDFs (4a) and (4b), if one PDF is symmetric the first product in (10) disappears. Table 1 shows that the secondorder Taylor series approximation for the correlation coefficient (10) is not accurate for approximating the correlation coefficient for a bivariate gamma distribution. The approximation for the correlation coefficient for a bivariate beta distribution is even worse.
Table 1. Taylor approximation of second-order for the correlation coefficient.
1
0.10
0.20
0.30
0.40
0.50
0.60
0.70
0.80
0.90
ra
0.0859 0.1833 0.2700 0.3639 0.4657 0.5654 0.6725 0.7767 0.8880
rTa
0.0743 0.1473 0.2188 0.2889 0.3577 0.4250 0.4909 0.5554 0.6184
rb
0.0903 0.1907 0.2792 0.3724 0.4732 0.5701 0.6718 0.7713 0.8741
rTb
0.0846 0.1687 0.2523 0.3352 0.4177 0.4995 0.5809 0.6616 0.7418
1
Correlation coefficient for the bivariate normal
a
Mean of the correlation coefficient for two gamma’s (1.5, 3) for 1000 simulations of
samples of 100 observations and its Taylor approximation (rTa). b
Mean of the correlation coefficient for a gamma (1.5, 3) and a gamma (5, 5) for 1000
simulations of samples of 100 observations and its Taylor approximation (rTb).
6
Table 2. Characteristics of the correlation coefficient for some bivariate distributions. Parameter
Normal marginals
Uniform marginals
Two gamma’s (1.5, 3)
Meana (rs)
Sdb (rs)
Mean (rs)
Sd (rs)
Mean (rs)
Sd (rs)
0.90
0.8992
0.01875
0.8908
0.02195
0.8880
0.02766
0.70
0.6996
0.05085
0.6824
0.05561
0.6725
0.06910
0.50
0.4987
0.07480
0.4817
0.07841
0.4657
0.09310
0.30
0.2991
0.08772
0.2866
0.09074
0.2700
0.09813
0.10
0.0959
0.09960
0.0926
0.09974
0.0859
0.10492
0
-0.0023
0.09816
-0.0013
0.10005
-0.0034
0.09768
-0.10
-0.1030
0.09987
-0.0973
0.09999
-0.0877
0.09638
-0.30
-0.3001
0.09266
-0.2887
0.09386
-0.2535
0.07994
-0.50
-0.4985
0.07897
-0.4812
0.08162
-0.4078
0.06355
-0.70
-0.6992
0.05169
-0.6828
0.05749
-0.5557
0.04562
-0.90
-0.8992
0.01992
-0.8913
0.02216
-0.6927
0.04017
a
Mean of the correlation coefficient for 1000 samples of size n=100
b
Standard deviation of the correlation coefficient for 1000 samples of size n=100
Table 2 and table 3 give the correlation mean (rs) for 1000 simulations of samples of 100 observations for different values of (correlation for the normal bivariate samples) for the following four bivariate distributions: (1) Two Gamma’s (1.5, 3), (2) Gamma (1.5, 3) and Gamma (10, 3), (3) Two Beta’s (0.1, 0.1) and (4) Beta (0.1, 0.1) and Beta (5, 5). The PDF for the gamma distribution is given in (11) and the PDF for the beta distribution is defined in (12).
7
f Z ( , )
f Z ( , )
z 1 Exp z /
1
(11)
x 1 (1 x) 1 B ( , )
(12)
The target correlation coefficient S between random variables X and Y can be obtained with the help of a table similar to table 2.
5. Example
Suppose that a sample from three variables X1, X2 and X3 with Gamma distributions with parameters (1.5, 3), (1.5, 3) and (10, 3) and correlation matrix C is needed: X1
X2
1 0.14 C= 1
X3 0.22 0.55 1
For this correlation matrix, we require to define three standard normal variables: U, V and W. U = T1 + Z1 + Z2 V = T2 W = T3
- Z1
+ Z3 + Z2 + Z 3
Variable Z1 will generate a correlation coefficient equal to -0.14 for X1 and X2; variable Z2 a correlation coefficient equal to 0.22 between X1 and X3. Finally, Z3 will generate a correlation coefficient equal to 0.55 for variables X2 and X3. Using tables 2 and 3, it is possible to select four or five points in the vicinity of the target correlation, afterwards a regression can be fit in order to estimate the correlation coefficient that gives the target correlation S , in this way a correlation of 0.16139 is selected for S =-0.14; a correlation
8
of 0.236895 for S =0.22 and a correlation coefficient of 0.577155 for a S =0.55, this means that: Z1 ~ N (0, 0.16139) , Z 2 ~ N (0, 0.236895) and Z 3 ~ N (0, 0.577155)
Therefore: T1 ~ N (0, 0.601715) , T2 ~ N (0, 0.261455) and T3 ~ N (0, 0.18595)
Table 3. Correlation coefficients’ characteristics for some bivariate distributions. Parameter
Gamma(1.5, 3) and
Gamma (10, 3)
Two Beta’s (0.1, 0.1)
Beta (0.1, 0.1) and Beta(5, 5)
Meana (r)
Sdb (r)
Mean (r)
Sd (r)
Mean (r)
Sd (r)
0.90
0.8741
0.02366
0.8043
0.04852
0.7870
0.03043
0.70
0.6718
0.05885
0.5657
0.07703
0.6061
0.05981
0.50
0.4732
0.08295
0.3861
0.09212
0.4317
0.08062
0.30
0.2792
0.09149
0.2249
0.09693
0.2586
0.09296
0.10
0.0903
0.10156
0.0711
0.10009
0.0833
0.09973
0
-0.0036
0.09763
-0.0011
0.10225
-0.0005
0.09998
-0.10
-0.0943
0.09847
-0.0737
0.09970
-0.0867
0.09940
-0.30
-0.2746
0.08697
-0.2248
0.09704
-0.2575
0.09248
-0.50
-0.4507
0.07133
-0.3814
0.09347
-0.4282
0.08282
-0.70
-0.6242
0.04741
-0.5685
0.07829
-0.6078
0.05894
-0.90
-0.7932
0.02828
-0.8045
0.04948
-0.7875
0.02995
a
Mean of the correlation coefficient for 1000 samples of size n=100
b
Standard deviation of the correlation coefficient for 1000 samples of size n=100
9
Variables U, V and W are obtained with the last variables. Finally transformation (6a, 6b) allows to obtain variables X1, X2 and X3. In order to assess the algorithm performance, 1000 simulations of samples of 100 observations for these variables were conducted, providing the standard deviation (in parenthesis) and the average of the correlation coefficient presented in matrix, Ca: X1
X2
1 0.1384 (0.0928) Ca = 1
X3 0.2234 (0.0994) 0.5509 (0.0763) 1
6. Concluding remarks A simple method for generating positively or negatively correlated random variables with known marginal distributions and specified correlation was presented. This method, which uses the popular technique of introducing shared random variables, generates a specified correlation coefficient between standard normal variables and by calibration it is possible to obtain the target correlation between the desired marginal distributions. An example is presented to illustrate how this method can be applied to obtain multivariate samples with specified correlations.
References Casella G. and Berger R. L. 1990. Statistical inference (Belmont USA: Duxbury Press). Cruz_Medina I. R., and Salazar Gómez M. 2007. Una familia de distribuciones bivariadas y sus aplicaciones en Hidrología. Agrociencia 41, 903-912. Johnson M. E., and Tenenbein A. 1981. A bivariate distribution family with specified marginals, J. Amer. Statist. Assoc. 76, 198-201.
10
Long D., and Krzysztofowics R. 1995. A family of bivariate densities constructed from marginals, J. Amer. Statist. Assoc. 90, 739-746. Loukas S. 1984. Simple method for computer generation of bivariate beta random variables, J. Statist. Comput. Simul. 20, 145-152. Magnussen S. 2004. An algorithm for generating positively correlated beta-distributed random variables with known marginal distributions and a specified correlation,
Computational Statistics & Data Analysis, 46, 397-406. Mardia K. V. 1967. Some contributions to contingency-type bivariate distributions,
Biometrika, 54, 235-249. Michael J. R. and Schucany W. R. 2002. The mixture approach for simulating bivariate distributions with specified correlations, The American Statistician, 56 (1), 48-54. Moran, P. A. P. 1969. Statistical Inference with bivariate gamma distributions,
Biometrika, 56, 627-634. Plackett R. L. 1965. A class of bivariate distributions, J. Amer. Statist. Assoc. 60, 516522. Park C. P. 2004. Construction of random vectors of heterogeneous component variables under specified correlation structures, Computational Statistics & Data Analysis, 46, 621-630.
11