GENERATION OF STANDARD NORMAL RANDOM NUMBERS Naveen Kumar Boiroju and M. Krishna Reddy Department of Statistics, Osmania University, Hyderabad- 500 007, INDIA Email:
[email protected],
[email protected]
Abstract: In this paper, we propose an easy method to generate standard normal random variables and this method is compared with the other existing methods. It is observed that the proposed method is quite competitive with most of the existing methods. Randomness of the generated sample is tested using the autocorrelation function and Ljung-Box test. Normality of the samples is checked with the help of relation between testing of hypothesis and confidence intervals. Keywords: Autocorrelation function, Bootstrap confidence intervals, Central limit theorem, Ljung-Box Statistic, Standard normal distribution, Random numbers.
1. Introduction The normal distribution is also called as the Gaussian distribution and it is the most important distribution in statistics. The distribution is given by
f (x ) =
− ( x − µ )2 exp ; − ∞ < x, µ < ∞ and σ > 0 2 σ 2π 2σ 1
1
where µ is a location parameter, equal to the mean, and σ the standard deviation. For
µ = 0 and σ = 1 , we refer to this distribution as the standard normal distribution. Some characteristics of a standard normal distribution include the following: 1. Symmetric about mean and Mean=Median=Mode. 2. Mean=0, Standard deviation =1, Skewness=0 and Kurtosis relative to normal (β 2 − 3) =0. 3. First and third quartiles are -0.6745 and 0.6745 respectively. 4. Normal random variables X ’s with mean µ and variance σ 2 are generated by the relationship X = µ + σ Z , where Z is the standard normal random variable. Generation or simulation of random numbers, using deterministic algorithms, is widely used by statisticians for several purposes. These include evaluating performance of estimation and test procedures, and also use of simulation as a part of statistical inference. Generating normal random numbers is an old and very important problem in the statistical literature.
Standard
normal
random
variables
are
frequently
used
in computer
science, computational statistics, and in particular, in applications of the Monte Carlo method. Several algorithms are available in the literature to generate normal random numbers like method of sums of uniforms, Box-Muller method, Polar method, acceptance-rejection method, inversion method, etc. Howell and Rheinfurth (1982), Devroye (1986), Johnson et.al. (1995), Thomas et.al. (2007) and Rao et.al. (2011) provides an extensive list of different algorithms for the generation of standard normal random numbers. In view of the enormous recent development in statistics that relies on the use of simulation, it is essential for every statistician to have some knowledge of the corresponding techniques. It is also useful to note that because of its extensive use, search for an appropriate simulation technique is itself an area of research. In Section 2, some of the existing methods to generate standard normal 2
random numbers discussed and a very simple and convenient method is proposed. Testing of randomness and normality of the generated samples is presented in Section 3. Final conclusion is presented in Section 4. 2. Methods for Generating Standard Normal Random Numbers
Some existing methods for generating standard normal random numbers discussed in this section. A new algorithm to generate standard normal random numbers is also proposed and is named as method-9 in this article.
Method-1: Sum of Uniform Random Variables
The simplest way of generating normal variables is an application of the central limit theorem. The central limit theorem is a weak convergence result that expresses the fact that any sum of many small independent random variables is approximately normally distributed. Use of the central limit theorem on U(0,1) random variables provide a simple method for closely approximating normal random variates. The following algorithm is used to generate the standard normal variables. 1. Generate 12 independent uniform random numbers, U 1,U 2, K, U 12 ~ iid U(0,1). 12
2. Return Z = ∑ U i − 6. i =1
This method requires 12 uniform random variables to generate a single standard normal random number.
3
Method-2: Box-Muller Method
This method is due to Box and Muller (1958) and generates a pair of independent standard normal random variables using a pair of uniform random numbers as follows: 1. Generate two independent random numbers U 1 and U 2 from U(0,1) distribution. 2. Return Z 1 = − 2 ln U 1 Cos(2πU 2 ) and Z 2 = − 2 ln U 1 Sin(2πU 2 ) . Method-3: Polar Method
Another form of the Box-Muller method is called the polar technique. This improves over the previous technique in being quicker as well as numerically more robust. The algorithm can be summarized as follows: 1. Generate two random numbers U 1 and U 2 from U(0,1) distribution. 2. Set V1 = 2U 1 − 1, V2 = 2U 2 − 1 and S = V12 + V22 . Note that V1 and V2 are U(-1,1).
3. If S>1, go to step 1, otherwise go to step 4. 4. Return two independent standard normal variables
Z1 =
− 2 ln S V1 and Z 2 = S
− 2 ln S V2 . S
This algorithm also requires two uniform variables to generate a single standard normal random number. Method-4: Inversion Method
This method is due to Hastings (1955) and the algorithm can be summarized as follows: 4
1. Generate U ~ U(0,1). 2
2. Return Z = Φ −1 (U ) = -w +
∑a w
i
i
i =0 3
∑b w
; U ≤ 0.5. i
j
j =0
3. if U ≥ 0.5, use Z = -Φ −1 (1 − U ). where w = − 2 ln (U );
b0 = 1;
a 0 = 2.515517;
b1 = 1.432788;
a1 = 0.802853;
b2 = 0.189269;
a 2 = 0.010328;
b3 = 0.001308.
This method requires single uniform random number but involves seven constants. Method-5: Acceptance-Rejection Method
The following method is borrowed from the paper of Sigman (2007). 1. Generate two independent exponentials at rate 1; Y1 = − ln (U 1 ) and Y2 = − ln (U 2 ). 2. If Y2 ≥ (Y1 − 1) / 2, set Z = Y1 ; otherwise go to back to step 1. 2
3. Generate U 3 . Set Z = Z if U 3 ≤ 0.5, set Z = - Z if U 3 > 0.5. This algorithm is an iterative algorithm and requires at least three uniform random numbers to generate a single standard random number. Method-6: Using Generalized Exponential Distribution
The following algorithm is given by Kundu et.al. (2006). 1. Generate an uniform (0,1) random variable, U ~ U(0,1).
(
)
2. Generate X = -ln 1 - U 0.0775 . 3. Compute the standard normal random variable as Z =
ln (X ) − 1.0821 . 0.3807
5
This algorithm requires only one uniform random number for the generation of single standard normal random number. Method-7: Bol’shev Formula
A formula was suggested by Bol’shev (1959) is explained in the following steps. 1. Let the five uniform random numbers, U 1 , U 2 , U 3 , U 4 and U 5 ~ U (0,1) .
2. Compute X =
(
1 5
5
∑ [ 3 (2U
j
]
− 1) .
j =1
3. Z = X − 0.01 3 X − X 3
)
This formula requires atleast five uniform random numbers to generate a single standard normal random number. Method-8: Inversion Method
The following algorithm proposed by Rao et.al. (2011) and it is explained in the following steps. 1. Generate U from the U(0,1) distribution. 1 − ln − 1 U . 2. Return Z = 1.702 This algorithm requires only a single uniform random variable to generate the standard normal variables and it is very much easier to apply and compute.
6
Method-9: Proposed Method
The proposed algorithm is developed using feedforward neural networks and summarized as follows: 1. Generate uniform random number U from U(0,1) distribution. 2. Set X1= Tanh(-31.35694+28.77154U), X2=Tanh(-2.57136-31.16364U), X3=Tanh(3.94963-1.66888U) and X4=Tanh(2.31229+1.84289U) . 3. Return Z=0.46615+90.72192X1-89.36967X2-96.55499X3+97.36346X4. This method requires only one uniform random number to generate the standard normal random numbers.
3. Testing Randomness and Normality
A comparative study of the above methods discussed in this section. 1000 random numbers generated using each of the methods discussed in section 2 and tested for the randomness and normality of the random numbers generated using the proposed method. Testing Randomness:
For a random series, we expect to find that autocorrelation function (ACF) is zero for all non-zero values of lag k and none of the autocorrelations is significantly different from zero at the level 0.05. Hence, the ACF is used as a graphical test procedure to test the 7
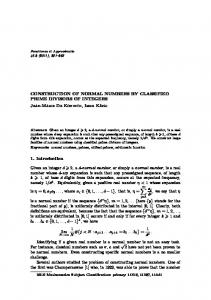
randomness of the generated data (Chatfield, 1991). The sample ACF of the standard normal random numbers generated from the proposed method (Method-9) is presented in the following figure.
Figure 1: Autocorrelation function of the sample generated from the proposed method
As the results indicate, none of these autocorrelations of the standard normal random numbers generated from the proposed method is significantly different from zero at the level 0.05. This proves that the generated sample is a random sample. Randomness of the sample generated from the proposed method is tested using LjungBox test (Chatfield, 1991; Ljung and Box, 1978). The following table presents the values of Ljung-Box statistic and its significant probability values for different lags of the autocorrelations.
8
Table 1: Ljung-Box test
Lag 10 20 30 40 50 60 70 80 90 100
Ljung-Box Statistic Value df P-value 6.962 10 0.729 15.838 20 0.727 26.017 30 0.674 43.304 40 0.332 55.901 50 0.263 70.495 60 0.167 84.422 70 0.115 95.620 80 0.112 102.298 90 0.177 108.618 100 0.261
From the above table, it is observed that the P-values of the Ljung-Box statistic at different lags is greater than the level 0.05, therefore we accept the null hypothesis of randomness of the sample and we may conclude that the sample generated using the proposed method is a random sample.
Testing of Normality:
The histogram of the sample generated using the proposed method (Method-9) is presented in the following figure.
9
Figure 2: Histogram of the sample generated using the proposed method
From the above histogram, it is observed that the sample generated using the proposed method is symmetric and normal. The following table presents the descriptive statistics of the samples generated using each of the methods. Table 2: Descriptive Statistics Descriptive Statistics N Valid Mean Median Mode Std. Deviation Skewness Kurtosis Range Minimum Maximum Quartiles Q1 Q2 Q3
Method M1 1000 -0.002 -0.007 -0.016 0.983 0.000 -0.178 5.930 -3.180 2.750 -0.670 -0.007 0.673
M2 1000 -0.032 -0.001 0.059 1.024 -0.003 0.030 6.074 -2.963 3.111 -0.714 -0.001 0.653
M3 1000 -0.023 -0.054 -0.118 1.005 0.093 -0.194 6.111 -2.909 3.202 -0.705 -0.054 0.643
M4 1000 0.060 0.029 -0.033 0.984 0.091 0.147 6.634 -3.023 3.611 -0.597 0.029 0.727
M5 1000 0.048 0.049 0.049 1.002 -0.139 -0.019 6.530 -3.337 3.194 -0.636 0.049 0.751
M6 1000 0.015 0.011 0.001 1.025 0.029 -0.162 6.503 -3.176 3.326 -0.703 0.011 0.753
M7 1000 0.039 0.013 -0.041 0.960 0.056 -0.163 5.615 -2.813 2.802 -0.663 0.013 0.694
M8 1000 -0.014 -0.012 -0.006 0.989 0.006 -0.039 5.218 -2.590 2.628 -0.650 -0.012 0.603
M9 1000 0.042 0.059 0.094 0.998 -0.054 -0.055 5.745 -2.895 2.851 -0.633 0.059 0.705
10
From the above table, it is clear that the mean, median and mode are almost equal to zero and same for the samples generated from the each method. Standard deviation, skewness and kurtosis of the random numbers generated using each of the methods is near to one, zero and zero respectively. This indicates that the methods producing standard normal random numbers. The sample quartiles are also agreeing with that of the standard normal distribution. Method-4 generates a wide range of the standard random numbers whereas method-8 generates a low range of the standard normal random numbers. The relation between testing of hypothesis and confidence intervals is used to test the normality of the samples. The characteristics of the standard normal distribution is checked and tested with the help of bootstrap confidence intervals (Becher et.al.; 1993 and Efron and Tibishirani; 1993). If all the parameters (mean=0, standard deviation=1, skewness=0 and kurtosis=0 ) of the standard normal distribution lies in between the lower and upper bounds of bootstrap confidence interval, then the normality of the sample is satisfied. Bootstrap confidence intervals for the mean, standard deviation, skewness and kurtosis of the samples generated from each of the method is presented in the following table.
11
Table 3: Bootstrap confidence intervals
Method
Method-1
Method-2
Method-3
Method-4
Method-5
Method-6
Method-7
Method-8
Method-9
Descriptive Statistics Mean Std. Deviation Skewness Kurtosis Mean Std. Deviation Skewness Kurtosis Mean Std. Deviation Skewness Kurtosis Mean Std. Deviation Skewness Kurtosis Mean Std. Deviation Skewness Kurtosis Mean Std. Deviation Skewness Kurtosis Mean Std. Deviation Skewness Kurtosis Mean Std. Deviation Skewness Kurtosis Mean Std. Deviation Skewness Kurtosis
Statistic -0.002 0.983 0 -0.178 -0.032 1.024 -0.003 0.03 -0.023 1.005 0.093 -0.194 0.06 0.984 0.091 0.147 0.048 1.002 -0.139 -0.019 0.015 1.025 0.029 -0.162 0.039 0.96 0.056 -0.163 -0.014 0.989 0.006 -0.039 0.042 0.998 -0.054 -0.055
Bootstrap method (10,000 iterations) 95% Confidence Interval Bias Std. Error Lower Upper 0 0.031 -0.063 0.058 -0.001 0.021 0.941 1.024 0.001 0.068 -0.135 0.134 -0.004 0.115 -0.402 0.058 0.001 0.032 -0.095 0.031 -0.001 0.023 0.978 1.069 -0.001 0.073 -0.144 0.136 -0.004 0.116 -0.193 0.264 0 0.031 -0.086 0.037 0 0.021 0.965 1.046 0 0.064 -0.035 0.219 0.001 0.111 -0.399 0.04 0.001 0.031 0.001 0.122 -0.001 0.023 0.94 1.029 0 0.084 -0.073 0.255 -0.009 0.171 -0.179 0.483 0.001 0.032 -0.014 0.112 0 0.022 0.958 1.046 -0.002 0.078 -0.293 0.021 -0.002 0.153 -0.306 0.299 0.001 0.032 -0.047 0.081 -0.001 0.022 0.981 1.067 0.001 0.069 -0.105 0.166 -0.002 0.121 -0.39 0.081 0 0.03 -0.019 0.1 0 0.021 0.92 1.001 0.001 0.069 -0.077 0.194 -0.004 0.108 -0.374 0.045 0 0.03 -0.073 0.045 -0.001 0.021 0.948 1.030 0 0.068 -0.126 0.136 -0.002 0.103 -0.238 0.172 0 0.031 -0.02 0.102 -0.001 0.022 0.956 1.041 0 0.071 -0.193 0.086 -0.005 0.114 -0.275 0.166
12
From the above table, it is observed that the parameters of the standard normal distribution belong to the respective bootstrap confidence intervals for all the methods. This implies that all the methods considered in this article can be used to generate the standard normal random numbers. 4. Conclusion
From the above study, it is observed that the proposed method possesses the randomness as well as the normality. The proposed method is an easy and convenient method to generate the standard normal random numbers. Hence, the proposed method can be viewed as a competitive method to generate the standard normal random numbers.
References:
[1] Becher H., Hall P., Wilson S.R. (1993), Bootstrap hypothesis testing procedures, Biometrics, 49(4): 1268-1272. [2] Bol’shev, L.N. (1959), On transformations of random variables, Teoriega Veroyatitnosteti i ee primeneniya, 4, 129-141. [3] Box, G. E. P. and Muller, M. E. (1958), A note on the generation of random normal deviates, Annals of Mathematical Statistics, 29, 610-611. [4] Chatfield, C. (1991), The Analysis of Time Series: An Introduction, 5th ed., Chapman and Hall, London. [5] Devroye L. (1986), Non-uniform random variable distribution, Springer-Verlag: New York. [6] Efron B., Tibshirani R.J. (1993), An introduction to the Bootstrap, Chapman & Hall, New York. 13
[7] Hastings, C.(1955), Approximations for Digital Computers. Princeton University Press, Princeton, N.J. [8] Howell, L.W. and Rheinfurth, M.H. (1982), Generation of Pseudo-Random Numbers, Technical Paper 2105, NASA. [9] Johnson, N., Kotz, S. and Balakrishnan, N. (1995), Continuous Univariate Distribution, Vol. 1, John Wiley and Sons, New York. [10] Kundu, D., Gupta, R.D. and Manglick, A. (2006), A convenient way of generating normal random variables using generalized exponential distribution J. Modern Appl. Statist. Methods, 5, 266–272. (home.iitk.ac.in/~kundu/paper104.pdf.) [11] Ljung, G. M. and Box, G. E. P. (1978), “On a measure of lack of fit in time series models”, Biometrika, 65, 297–303. [12] Rao, K.R., Boiroju, N.K. and Reddy, M.K. (2011), Generation of standard normal random variables, Indian Journal of Scientific Research, 2(4), 83-85. [13] Sigman, K. (2007), Simulating normal (Gaussian) rvs with applications to simulating Brownian motion and geometric Brownian motion in one and two dimensions, www.columbia.edu/~ks20/...Sigman/4703-07-Notes-BM-GBM-I.pdf. [14] Thomas, D.B., Luk, W., Leong, P.H.W., Villasenor, J.D. (2007), Gaussian Random Number Generators, ACM Computing Surveys, Vol. 39, No. 4, Article 11.
14