Generational Replacement and Value Change in Eight West European Societies Author(s): Paul R. Abramson and Ronald Inglehart Source: British Journal of Political Science, Vol. 22, No. 2 (Apr., 1992), pp. 183-228 Published by: Cambridge University Press Stable URL: http://www.jstor.org/stable/194059 Accessed: 11/11/2009 07:51 Your use of the JSTOR archive indicates your acceptance of JSTOR's Terms and Conditions of Use, available at http://www.jstor.org/page/info/about/policies/terms.jsp. JSTOR's Terms and Conditions of Use provides, in part, that unless you have obtained prior permission, you may not download an entire issue of a journal or multiple copies of articles, and you may use content in the JSTOR archive only for your personal, non-commercial use. Please contact the publisher regarding any further use of this work. Publisher contact information may be obtained at http://www.jstor.org/action/showPublisher?publisherCode=cup. Each copy of any part of a JSTOR transmission must contain the same copyright notice that appears on the screen or printed page of such transmission. JSTOR is a not-for-profit service that helps scholars, researchers, and students discover, use, and build upon a wide range of content in a trusted digital archive. We use information technology and tools to increase productivity and facilitate new forms of scholarship. For more information about JSTOR, please contact
[email protected].
Cambridge University Press is collaborating with JSTOR to digitize, preserve and extend access to British Journal of Political Science.
http://www.jstor.org
183
B.J.Pol.S. 22,183-228 Printed in Great Britain
GenerationalReplacementand ValueChangein
Eight West European Societies PAUL R. ABRAMSON
AND RONALD
INGLEHART*
Surveys sponsored by the Commission of the European Communities are employed to study value change in West Germany, Britain, the Netherlands, France, Belgium and Italy between 1970-71 and 1990 and in Denmark and Ireland between 1973 and 1990. During these years generational replacement had a major impact on value trends in all eight societies. In Germany, Britain, the Netherlands and Denmark generational replacement contributed to the growth of Postmaterialism, and in France, Italy and Ireland replacement was the major force creating the trend towards Postmaterialism. Even in Belgium, where there was only a slight move towards Postmaterialism, replacement may have prevented a movement towards Materialism. For the European public as a whole, replacement contributed to the growth of Postmaterialism. However, the impact of replacement is likely to be smaller in the coming two decades because relatively low birth rates during the late 1970s and the 1980s will contribute to lower rates of generational replacement.
The political values of West European publics are changing and generational replacement plays a major role contributing to this change. The potential for change has been apparent for over two decades. In 1970 a survey of value priorities in West Germany,' Britain, the Netherlands, France, Belgium and Italy found that young Europeans had strikingly different values from their elders.2 When asked to choose among national goals, older Europeans tended to select such 'Materialist' goals as maintaining order and fighting inflation, whereas younger Europeans were more likely to give top priority to such 'Postmaterialist' goals as freedom and self-expression. The American National Election Studies also demonstrate that young Americans are more likely to have Postmaterialist values than their elders.3 The first World Values Survey, conducted between 1981 and 1983, likewise found a clear relationship between age and 'Materialism' in the six countries originally studied, as well as in Denmark, Ireland, Spain, Iceland, Hungary, Norway, Sweden and Japan, although * Department of Political Science, Michigan State University, and Institute for Social Research, University of Michigan, respectively. We are grateful to Karlheinz Reif and Anna Melich for providing the recent EuroBarometer surveys and to William Claggett, Ada W. Finifter and Nicolas van de Walle for their comments on earlier versions of this article. An earlier version of this article was presented at the 1991 Annual Meeting of the American Political Science Association, Washington, DC. 'Since the Fall 1990 EuroBarometer study, surveys of Germany have included what used to comprise East Germany. As our analyses end with the Spring 1990 EuroBarometer, all of our survey data are based upon West Germany. In addition, our demographic statistics are based upon censuses of West Germany. 2 See Ronald Inglehart, 'The Silent Revolution in Europe: Intergenerational Change in PostIndustrial Societies', American Political Science Review, 65 (1971), 991-1017. 3 See Ronald Inglehart, Culture Shift in Advanced Industrial Society (Princeton, NJ: Princeton University Press, 1990).
184
ABRAMSON
AND
INGLEHART
age was only weakly related to values in Canada, Mexico, Northern Ireland and South Africa. The EuroBarometer surveys sponsored by the Commission of the European Communities have also found a consistent relationship between age and Materialism in all of the original six countries, as well as in Denmark, Ireland, Greece, Spain, Portugal, Luxembourg and Northern Ireland.4 Value change can have important political consequences.5For example, Europeans who choose Postmaterialist values are more likely to be politically active in conventional politics as well as to approve of and engage in unconventional political protest. Postmaterialists are more likely to be concerned about the environment, to de-emphasize economic growth and to support the women's and peace movements. And even though Postmaterialists are more likely to have higher socio-economic status than Materialists, they are disproportionately likely to support left-wing parties.6Indeed, in all eight countries we study, middle-class Postmaterialists are more likely to support Left parties than are working-class Materialists. By appealing to middle-class Postmaterialists, parties of the Left risk losing working-class support, and the growth of Postmaterialism can weaken and split Left parties. If age-related differences in values truly reflect a trend, value change may be reshaping the politics of Western societies. During the past decade numerous researchers have studied Materialist/Postmaterialist values7 and, with the 1990-91 World Values Survey, measures of these values have been employed among mass publics in more than thirty countries. There is now an extensive research literature about the reasons why young adults are more likely to have Postmaterialist values than their elders.8 In our view, the evidence strongly suggests that age-group differences result mainly from differences between the formative socialization of younger Europeans, who grew up during periods of relative prosperity, and older Europeans who grew up during periods of scarcity. This article presents additional evidence suggesting that a life-cycle interpretation of age-group differences is implausible. Our main goal, however, is to analyse the dynamics of value change. Given that older, more Materialist Europeans are dying off, and that they are being continuously replaced by younger, less Materialist Europeans, generational replacement tends to lead to a gradual decline in the proportion of Materialists and to a gradual growth in the proportion of Postmaterialists. However, values can change among adults, and short-term forces can prevent Postmaterialism 4
Sample surveys in Luxembourg began in 1973 and in Northern Ireland in 1976, but these samples have been relatively small. Greece has been surveyed from 1980 onward and surveys began in Spain and Portugal in 1986. The time series provided by Greece, Spain and Portugal are not long enough to analyse the impact of generational replacement. 5 See Inglehart, CultureShift. 6 See Inglehart, CultureShift. 7 For a summary, see Inglehart, CultureShift. 8 See Paul R. Abramson and Ronald Inglehart, 'Generational Replacement and Value Change in Six West European Societies', American Journal of Political Science, 30 (1986), 1-25; Inglehart, CultureShift.
GenerationalReplacementand Value Change
185
from rising, despite generational replacement. Indeed, the trend towards Postmaterialism was inhibited during the 1970s, mainly because economic adversity stimulated Materialist concerns.9 Now, however, we have comparable data for Germany, Britain, the Netherlands, France, Belgium and Italy for two decades and for Denmark and Ireland for seventeen years. As we shall see, Postmaterialism rose markedly in Germany, Britain, the Netherlands and Denmark and rose somewhat in France, Ireland and Italy; in Belgium there was only a slight rise in overall levels of Postmaterialism. As we shall demonstrate, generational replacement affected value trends in all eight countries. In Germany, Britain, the Netherlands and Denmark, generational replacement contributed to the growth of Postmaterialism, and in France, Italy and Ireland replacement was the major force creating the trend towards Postmaterialism. Even in Belgium, where there was only modest movement towards Postmaterialism, replacement may have prevented a movement towards Materialism. As we shall see, for the European public as a whole, replacement contributed substantially to the growth of Postmaterialism. However, the impact of replacement is likely to be smaller in the coming two decades because relatively low birth rates during the late 1970s and the 1980s will result in lower rates of generational replacement. VALUE
CHANGE
BETWEEN
1970
AND 1990
Our data source is a series of thirty national surveys sponsored by the Commission of the European Communities between 1970 and 1990 in Germany, Britain, the Netherlands, France, Belgium and Italy, and a series of twenty-eight national surveys sponsored by the Commission in Denmark and Ireland.'1 The basic items used to measure value priorities have been widely reported in previous publications and are also available in Consortium codebooks. Respondents are asked to select what they believe their country's two top goals should be among the following four alternatives: (1) (2) (3) (4)
maintaining order in the nation; giving the people more say in important government decisions; fighting rising prices; protecting freedom of speech.
9 See Ronald Inglehart, 'Post-Materialism in an Environment of Insecurity', American Political Science Review, 75 (1981), 880-900. l0 We combine results for 1970 and 1971 to be consistent with the results presented by Ronald Inglehart, The Silent Revolution: Changing Values and Political Styles Among Western Publics (Princeton, NJ: Princeton University Press, 1977). For all subsequent reports we present results according to single years. For 1977, 1978 and for 1980 through 1989, we combine the results of two surveys. All of the surveys employed up to the spring of 1989 were, at the time of this writing, available through the Inter-university Consortium for Political and Social Research, Ann Arbor, Michigan. The Fall 1989 and Spring 1990 surveys are scheduled to be made available through the Consortium.
186
ABRAMSON
AND INGLEHART
Given two choices among four goals, six combinations are possible. Respondents who select 'maintaining order' and 'fighting rising prices' are classified as Materialists, while those who choose 'giving the people more say' and 'freedom of speech' are classified as Postmaterialists. The four remaining combinations - all of which are made up of one Materialist and one Postmaterialist response - are classified as 'mixed'. The measure formed by these items is strongly related to a more extensive measure based upon a choice among twelve values." The more complex measure, which was employed in the 1990-91 World Values Survey, provides a more valid measure, but unfortunately it is not available in large numbers of surveys across time. Even so, scores on the two-choice measure we employ in this article strongly correlate in hypothesized ways with other political attitudes and behaviours.'2 Moreover, panel analyses suggest that this basic measure is reliable.'3 Therefore, despite the simplicity of our basic measure, we are confident that the trends we observe do reflect a basic change in values among the European public. Table 1 presents the distribution of value types for each of the eight countries. The table also presents a percentage difference index (PDI) computed by subtracting the percentage of Materialists from the percentage of Postmaterialists, thus yielding a measure that is equivalent to a mean score.14 Table 1 shows that between the early 1970s and 1990 the percentage of Postmaterialists quadrupled in Denmark, tripled in Britain and doubled in Germany, the Netherlands, France and Ireland. Between the early 1970s and 1990 there was also a small increase in the percentage of Postmaterialists in Belgium and Italy. During these two decades there was also a substantial decline in the percentage of Materialists. In Denmark, the proportion of Materialists was cut by two-thirds, and in Germany and the Netherlands it was cut by half. There is a substantial decline in the proportion of Materialists in Britain, France, Italy and Ireland. In Belgium, there is a four-point drop. The rise in the proportion of Postmaterialists and the decline in the proportion of Materialists is reflected in our value index. During the early 1970s the PDI was clearly negative in all eight countries, because Materialists heavily outnumbered Postmaterialists. In 1990, the PDI was clearly positive in the Netherlands and Denmark, while Germany and Britain had roughly equal numbers of Materialists and Postmaterialists. Although there were still more Materialists than Postmaterialists in France, Italy and Ireland, there was a substantial increase in the PDI in the three countries. Even in Belgium the PDI was higher than it was in our baseline surveys. The pattern of change over the past two decades cannot result from replacen See Inglehart, The Silent Revolution. 12 Inglehart, The Silent Revolution;'Post-Materialism in an Environment of Insecurity'. 13 See Inglehart, CultureShift. 14 More specifically, the percentage difference index is equivalent to a mean that assigns each Postmaterialist a score of 100, each respondent with mixed values a score of 0 and each Materialist a score of -100.
GenerationalReplacementand Value Change
187
ment alone, since replacement exerts a continuous pressure pushing Postmaterialism upwards. Some of the year-to-year fluctuations undoubtedly result from sampling error. Even for probability samples of this size, a four percentage point difference between two samples would be necessary for one to be reasonably confident (at the 0.95 level) that the difference did not result from sampling error; and, given that most of these samples employ quota procedures, an even larger difference would be necessary. But we think it is highly unlikely that these year-to-year changes result only from sampling error, since aggregatelevel changes in responses to these items are strongly related to changes in the consumer price index. Even though respondents are asked to choose longterm national goals, they are more likely to select 'fighting rising prices' when inflation rates are high. In every country except Belgium, there is a strong relationship between changes in the consumer price index and changing scores on our value index and there is a substantial relationship even in Belgium.l5 There is also a strong relationship when we use a one-year lag to estimate the relationship between changes in inflation rates and change on our value index. 16 One would expect respondents to be affected by changing economic conditions. The basic thesis about the development of Materialist/Postmaterialist values is that value priorities are shaped by social and economic conditions and that Postmaterialist values develop when economic security enables people to emphasize higher-order goals.17When economic security decreases, value priorities shift. But changing short-term conditions should not obscure the longer-term changes that have also occurred. Indeed, even though there are year-to-year fluctuations, the overall distribution of values among West Europeans is continuously affected by generational replacement. Our main goal in this article is to estimate that effect. GENERATIONAL
REPLACEMENT
BETWEEN
1970
AND 1990
Given that there is a consistent relationship between age and Materialism in all eight countries, replacementclearly has the potential for changing the overall 15We employ a product moment correlation entering the annual inflation rate for each year as the independent variable and the PDI score for that year as the dependent variable. We have reflected the score on our value index so that a positive correlation indicates that an increase in inflation is associated with a rise in Materialism. The inflation rate is the year-to-year change in the consumer price index. We used the annual consumer price index in each country as reported by the Statistical Office of the European Communities. In Germany, the correlation between changing inflation rates and change in the PDI is 0.76; in Britain it is 0.63; in the Netherlands, 0.87; in France, 0.65; in Italy, 0.82; in Denmark, 0.86; and in Ireland it is 0.71. Even in Belgium, it is 0.33. 16 Only in Denmark (where the correlation fell to 0.66) did the results change substantially when a one-year lag for inflation rates was employed. The relationship in Belgium rose to 0.40 when a one-year lag for inflation rates was employed, but the correlation was still much lower for Belgium than for any of the other seven countries. 17 See Inglehart, 'The Silent Revolution in Europe'; The Silent Revolution; CultureShift.
TABLE 1 Year of survey:
Distributionof Materialist/Postmaterialist Values in Eight West EuropeanSociet 1970-71 1973
1976
1977
1978
1979
1980
1981
1982
1983
1984
1985
Germany Postmaterialist 10% 8% 11% 8% 11% 11% 10% 8% 16% 19% 19% 21% Mixed 45 49 47 49 51 52 47 49 52 54 58 55 41 42 43 Materialist 45 38 37 43 22 43 31 27 24 Total percentage 100% 99% 99% 100% 100% 100% 100% 100% 99% 100% 99% 100% (Number) (3,937) (1,953) (891) (1,783) (1,841) (948) (1,868) (1,753) (2,108) (1,875) (1,782) (1,853) Score on Index -35 -34 -30 -35 -27 -25 -34 -35 -3 -15 -8 -3
Britain Postmaterialist 7% 8% 5% 8% 8% 11% 9% 8% 14% 12% 17% 14% Mixed 57 61 55 51 58 62 55 60 64 61 59 59 Materialist 36 32 37 44 33 26 36 32 23 26 24 26 Total percentage 100% 101% 100% 100% 99% 99% 100% 100% 101% 99% 100% 99% (Number) (3,950) (1,917) (1,017) (2,092) (2,094) (1,079) (2,226) (2,078) (2,094) (1,931) (2,057) (2,079) Score on Index -24 -28 -39 -24 -29 -25 -15 -26 -14 -9 -7 -12
Netherlands Postmaterialist 15% 13% 14% 15% 23% 19% 14% 15% 19% 21% 19% 24% Mixed 54 51 50 54 56 53 49 52 53 57 56 58 32 34 27 Materialist 31 31 28 37 34 29 22 25 18 Total percentage 100% 100% 100% 100% 100% 100% 100% 101% 101% 100% 100% 100% (Number) (3,509) (1,406) (1,058) (1,891) (1,997) (1,047) (2,019) (1,918) (2,162) (1,994) (1,969) (1,970) -4 Score on index -16 -19 -18 -19 -10 -23 -19 -2 -10 6 -6
France Postmaterialist 11% 12% 12% 11% 16% 15% 11% 10% 14% 12% 12% 12% Mixed 49 53 47 48 52 49 46 47 50 50 51 53 41 Materialist 41 41 35 32 36 43 43 37 37 37 35 Total percentage 101% 100% 100% 100% 100% 100% 100% 100% 101% 99% 100% 100% (Number) (4,059) (2,144) (1,302) (2,173) (2,057) (937) (1,878) (1,909) (2,075) (1,943) (1,936) (1,953) Score on Index -30 -22 -28 -30 -16 -21 -22 -33 -33 -25 -26 -23
Belgium 8% 10% 10% 9% 11% 14% 14% 14% 10% 12% 14% 10% Postmaterialist 48 52 47 53 53 50 52 57 54 61 57 Mixed 56 42 38 45 36 38 39 33 31 Materialist 32 30 33 25 Total percentage 100% 100% 100% 100% 100% 99% 99% 100% 100% 100% 100% 100% (Number) (2,650) (1,245) (1,012) (1,783) (1,835) (869) (1,791) (1,713) (2,048) (1,925) (1,960) (1,914) -33 -28 -29 -36 -26 -28 -19 -19 -11 -22 Score on Index -18 -16
Italy 8% 9% 6% 6% 8% 5% 9% 10% 10% Postmaterialist 11% 11% 9% 49 49 45 41 48 40 43 44 Mixed 49 52 48 46 43 43 54 44 50 55 47 41 43 Materialist 40 47 40 Total percentage 100% 101% 100% 100% 99% 100% 100% 101% 100% 101% 101% 100% (Number) (3,823) (1,899) (1,024) (2,101) (2,123) (1,130) (2,157) (2,193) (2,240) (2,013) (2,098) (2,102) -34 -44 -34 -48 -36 -37 -50 -29 -38 -33 Score on Index -31 -30 Denmark Postmaterialist Mixed Materialist Total percentage (Number) Score on Index
11% 14% 11% 14% 18% 9% 10% 10% 12% 10% 7% 59 56 59 52 51 56 60 54 52 49 53 23 30 26 30 33 39 40 34 41 37 41 100% 100% 100% 100% 101% 100% 100% 100% 100% 100% 100% (1,189) (907) (1,893) (1,863) (943) (1,900) (1,868) (2,071) (1,922) (1,873) (1,898) -5 -19 -16 -21 -12 -31 -29 -22 -31 -35 -28
Ireland Postmaterialist Mixed Materialist Total percentage (Number) Score on Index
6% 7% 7% 4% 8% 5% %6 6% 6 8% 6% %6 53 54 52 52 51 58 53 52 57 47 49 41 39 41 40 44 42 42 37 47 46 35 100% 100% 101% 100% 101% 100% 99% 100% 100% 100% 100 (1,198) (963) (1,952) (1,954) (990) (1,977) (1,934) (2,148) (1,952) (1,978) (1,970) -32 -35 -34 -40 -31 -31 -38 -35 -41 -40 -28
Source:European Community Surveys. Notes: A weighting factor is used in the analysis. However, the number of cases in parentheses is the actual num on the value index. The index score is the percentage of Postmaterialists minus percentage of Materialists.
190
ABRAMSON
AND
INGLEHART
distribution of political values. To determine how much replacement actually took place during the past two decades, we employed national census data reporting the population by single years of age. Using these census results we computed the number of adults in each of the cohort categories that we used in our analysis of the European Community surveys. In an earlier paper, we presented the distribution of the adult population in Germany, Britain, the Netherlands, France, Belgium and Italy at the end of 1970 and 1990, and also the distribution of the adult population in Denmark and Ireland at the end of 1973 and 1990.18 The overall pattern of change is similar in all eight countries, although there are some cross-national differences. In all eight countries, the absolute number of adults born before 1916 diminished through death and their relative size diminished further as a result of new cohorts coming of age. In Germany, Britain, France and Belgium these older cohorts made up a third of the adult population in 1970, but only 8 or 9 per cent by the end of 1990. In Italy, cohorts born before 1916 made up 29 per cent of the adult population in 1970, but only 7 per cent in 1990, while in the Netherlands these cohorts fell from 27 per cent to 7 per cent. In Denmark and Ireland, where we examine change over seventeen years, the cohorts born before 1916 made up just over a fourth of the adult population at the end of 1973; by the end of 1990 these cohorts made up only 8 per cent of it in Denmark and only 6 per cent of it in Ireland. In the first six countries, persons born after 1955 were too young to be included in our 1970 sample. By 1986, the European Community surveys were sampling youths who had not yet been born when these surveys began. By the end of 1990, there were over 18,000,000 German adults born after 1955 and, as we show, they made up 35 per cent of the adult population. In other words, over a third of the adult population had been replaced during these two decades. Moreover, replacement was greater in the five other countries. Thirty-six per cent of the adult population had been replaced in France, 37 per cent in Britain and Belgium, 38 per cent in Italy and 39 per cent in the Netherlands. In Denmark and Ireland, persons born after 1958 were too young to be sampled in our first surveys. By the end of 1990, 31 per cent of the Danish adults were people born after 1958, while in Ireland 38 per cent of the adult population was. Thus in every country except Denmark, over a third of the adult population had been replaced during the course of the European Community surveys. For our survey data to aid us in estimating the impact of generational replacement, they must mirror these demographic changes and, not surprisingly, they do. In our earlier paper, we show the overall distribution of the adult population
18 See Paul R. Abramson and Ronald Inglehart, 'Generational Replacement and Value Change in Eight West European Societies' (paper presented at the Annual Meeting of the American Political Science Association, Washington, DC, 1991, Table Al).
GenerationalReplacementand Value Change
191
in the European Community surveys for each of the eight countries.19For all eight, there is a close fit between the age distribution in the samples and the distribution revealed by the actual census results. If generational replacement has contributed to the rise of Postmaterialism, these surveys should show it. VALUE CHANGE THROUGH THE LIFE CYCLE
We began our analysis of the impact of generational replacement by calculating scores on our value index for each cohort for each year from 1970-71 (or for 1973 for Denmark and Ireland) through 1990. Tables 2 through 9 present our results. Reading down these columns, we observe the relationship between value preferences and age for any given year for each country. Reading across each row, we observe the way values change for each birth cohort in each country as cohorts age. Despite the large number of cases for each country, the number of cases per cohort becomes fairly small once we divide our samples into seventeen survey years and eight cohorts. For most of these estimates there are between 200 and 300 respondents for each cohort for each year, but for 1976 and 1979 the number of cases for the oldest cohort sometimes falls to just over 100, and in France, Belgium and Italy the oldest cohort presented for 1990 falls below 100 cases. Even probability sample subsets with an N of 300 have a confidence interval (at 0.95) of plus or minus 8 percentage points, while for an N of 100 the confidence interval rises to 14 points. The confidence interval with our surveys is probably somewhat larger. In addition, our index is based upon a difference between two percentages. It is therefore important to avoid focusing upon the result for any single cohort. Throughout our analysis we focus on the overall pattern of results. Reading down each column, we see a clear pattern. In all survey years and for all eight countries, Materialism increases with age. As has been demonstrated, the relationship between age and Materialism was relatively weak in Britain compared with the countries of Continental Europe.20These differences persisted throughout the 1980s, with Britain manifesting the weakest relationship between age and Materialism. That Britain differs from Continental Europe supports a generational interpretation for age-group differences, because Britain escaped invasion and occupation during the Second World War, and thus Britons did not suffer the deprivations inflicted upon these Continental European countries. Moreover, compared with these Continental countries, Britain had relatively low rates of economic growth after the Second World War. Compared with Britons who grew up before or during the Second World War, younger Britons grew up during affluent times. But relative levels of pre- and 19 See Abramson and Inglehart, 'Generational Replacement and Value Change in Eight West European Societies', Tables A2 through A9. These tables can be used to approximate the number of cases upon which the results in Tables 2 through 9 of this article are based. 20 See Inglehart, The Silent Revolution.
TABLE2
Percentage of Postmaterialists Minus Percentage of Materialists in Germany,by 1990
Year of survey: Years of birth 1966 and after 1956-65 1946-55 1936-45 1926-35 1916-25 1906-15 Before 1906 Total adult population
1970-71 1973 1976 1977 1978 1979 1980 1981 1982 1983 1984 19
0 -23 -40 -41 -55 -55
* -2 -29 -42 -42 -54 -62
-2 -14 -27 -38 -43 -43 t
-12 -24 -32 -41 -42 -50 t
-14 -13 -32 -31 -32 -36 t
-22 -25 -26 -27 -22 -31 t
-25 -28 -38 -38 -38 -35 t
* -13 -25 -37 -43 -40 -46 t
17 -14 -23 -31 -43 -48 t
-35
-34
-30
-35
-27
-25
-34
-35
-15
*
*
* 20 -17 -17 -22 -31 t
* 14 4 -7 -10 -19 t t
-8
-3
t
-1 -2
-
Source:EuropeanCommunitySurveys.
Notes: For the total number of cases for each year, see Table 1. For the distribution of respondents by year
andValueChangein EightWestEuropeanSocieties',TableA2. 'Generational Replacement *Scorenot presentedbecauseof thesmallnumberof cases. Scorenot presentedbecausethe advancedage of the cohort makesit non-representative for comparisonsacro remaining.
TABLE
3
Percentage of Postmaterialists Minus Percentage of Materialists in Britain, by Y 1990
Year of survey:
1970-71 1973 1976 1977 1978 1979 1980 1981 1982 1983 1984 19
Years of birth 1966 and after 1956-65 1946-55 1936-45 1926-35 1916-25 1906-15 Before 1906
-16 -18 -23 -29 -35 -43
-15 -26 -26 -25 -26 -35
Total adult population
-28
-24
*
t
0 -4 -12 -14 -18 -25 t
* -2 -9 -17 -15 -22 t t
-24
-9
-14
-19 -29 -25 -36 -34 t
-23 -30 -29 -38 -49 -59 t
-9 -11 -22 -28 -31 -40 t
0 -10 -8 -30 -12 -25
-12 -23 -28 -26 -25 -44
* -15 -17 -26 -24 -31 -36
t
t
-29
-39
-25
-15
-26
*
*
* 1 -9 -2 -5 -18 t
-1 -1 -2
t -7
-1
Source:EuropeanCommunitySurveys.
Notes: For the total number of cases for each year, see Table 1. For the distribution of respondents by year
'Generational andValueChangein EightWestEuropeanSocieties',TableA3. Replacement * Scorenot presentedbecauseof the smallnumberof cases. for comparisonsacro tScore not presentedbecausethe advancedage of the cohort makesit non-representative remaining.s
TABLE4
Percentageof Postmaterialists Minus Percentage of Materialists in the Netherlan through1990
Year of survey:
1970-71 1973 1976 1977 1978 1979 1980 1981 1982 1983 1984 19
Years of birth 1966 and after 1956-65 1946-55 1936-45 1926-35 1916-25 1906-1915
*
*
2 -8 -22 -18 -31
-15 -1 -18 -26 -33
Before1906
-40
-44
-16
-19
Total adult population
* -10 -9 -16 -26 -41 -18
-2 -10 -14 -22 -31 -35 -19
16 5 1 -10 -17 -23
2 1 0 -17 -25 -31
t
t
-4
-10
-3 -12 -20 -36 -35 -49
* -10 -7 -20 -25 -31 -38
t t -23
*
* 1 20 2 5 -10 -5 -25 -13 -16 -31 -39 t
t -19
-10
* 6 5 -3 -21 -15 t
-1 -1 t
t
t
t
-2
-6
Source:EuropeanCommunitySurveys.
Notes: For the total number of cases for each year, see Table 1. For the distribution of respondents by year
andValueChangein EightWestEuropeanSocieties',TableA4. 'Generational Replacement *Scorenot presentedbecauseof thesmallnumberof cases. for comparisonsacro t Scorenot presentedbecausethe advancedage of the cohort makesit non-representative remaining.
TABLE
5
Percentage of Postmaterialists Minus Percentage of Materialists in France, by Y 1990
Year of survey: Years of birth: 1966 and after 1956-65 1946-55 1936-45 1926-35 1916-25 1906-15 Before 1906 Total adult population
1970-71
*
1973
1976
1977
*
-2 -5
-6 -14
1978
1979
12 1
8
1980
1981
1982
*
*
-18 -27
-2 -9
1983
1984
19
*
*
-11 -19
-13 -10
-2 -1
-4
-9 -23
-25
-8
-19
-17
-13
-14
-31
-25
-23
-30
-22
-2
-27
-31
-37
-38
-24
-42
-35
-44
-37
-32
-36
-3
-33 -44 -51
-31 -45 -53
-38 -61 t
-41 -61 t
-30 -45 t
-45 -41 t
-49 -55 t
-44 -57 t
-46 -52 t
-27 t t
-43
-3
-30
-22
-28
-30
-16
-21
-33
-33
-22
-25
-26
-4
0
t t
-2
Source: European Community Surveys.
Notes: For the total number of cases for each year, see Table 1. For the distribution of respondents by year 'Generational Replacement and Value Change in Eight West European Societies', Table A5.
* Score not presented because of the small number of cases. tScore not presented because the advanced age of the cohort makes it non-representative for comparisons acros remaining.
TABLE 6
Percentage of Postmaterialists Minus Percentage of Materialists in Belgium, by Y 1990
Year of survey: Years of birth: 1966 and after 1956-65 1946-55 1936-45 1926-35 1916-25 1906-15 Before 1906 Total adult population
1970-71 1973 1976 1977 1978 1979 1980 1981
*
*
7 -15 -12 -18 -28
8 -5 -6 -18 -31
-42
-35
-18
-11
10 4 -15 -22 -29 -39 -16
-1 -10 -15 -28 -32 -41 -22
1982 1983 1984 19 *
*
*
-
-7 -23 -22 -20 -34
4 -7 -21 -17 -24 -47
-16 -18 -24 -22 -36 -43
-15 -24 -19 -30 -40 -48
-16 -14 -32 -39 -43 -47
-29 -31 -35 -42 -45 t
-13 -19 -26 -37 -47 t
-2 -2 -3 -3 -4
t
t
t
t
t
t
t
-19
-19
-26
-28
-29
-36
-28
1
-3
Source:EuropeanCommunitySurveys. Notes: For the total numberof cases for each year, see Table 1. For the distributionof respondentsby yea andValueChangein EightWestEuropeanSocieties',TableA6. 'Generational Replacement
*Scorenot presentedbecauseof thesmallnumberof cases. for comparisonsacro t Scorenot presentedbecausethe advancedage of the cohort makesit non-representative remaining.
TABLE7
Percentage of Postmaterialists Minus Percentage of Materialists in Italy, by Yea 1990
Year of survey:
1970-71 1973 1976 1977 1978 1979 1980 1981 1982 1983 1984 19
Years of birth: 1966 and after 1956-65 1946-55 1936-45 1926-35 1916-25 1906-15 Before 1906
* -4 -24 -29 -37 -40 -52
* -10 -32 -34 -44 -45 -50
-2 -17 -28 -44 -36 -51 t
-6 -20 -43 -48 -54 -61 t
-2 -15 -39 -44 -49 -57 t
-9 -16 -37 -49 -56 -61 t
-23 -37 -59 -62 -61 -72 t
* -32 -32 -51 -56 -64 -68 t
* -15 -28 -41 -50 -55 -52 t
-30 -32 -46 -59 -56 t t t
Total adult population
-29
-31
-30
-38
-33
-37
-50
-48
-36
-44
*
* -14 -26 -41 -45 -43 t
-1 -1 -2 -4 -4 -5 t
-34
-3
Source:EuropeanCommunitySurveys. Notes:For the total numberof cases for each year, see Table 1. For the distributionof respondentsby yea andValueChangein EightWestEuropeanSocieties',TableA7. 'Generational Replacement
*Scorenot presentedbecauseof the smallnumberof cases. for comparisonsacro tScore not presentedbecausethe advancedage of the cohort makesit non-representative remaining.
TABLE8
Percentage of Postmaterialists Minus Percentage of Materialists in Denmark, by 1990
Year of survey
1973 1976 1977 1978
1979 1980 1981 1982 1983
Years of birth 1966 and after 1956-65 1946-55 1936-45 1926-35 1916-25 1906-15
* -22 -24 -41 -41 -43
* -11 -25 -22 -35 -49
-21 -12 -29 -29 -38 -55
-8 -2 -21 -31 -30 -41
-19 -12 -28 -32 -33 -54
-16 -16 -30 -35 -38 -52
* -6 -9 -18 -28 -36 -38
2 -6 -8 -11 -27 -33
* -12 -6 -12 -16 -35 t
* -9 -3 -1 -15 -25 t
-6 8 1 -10 -14 -16 t
Before1906
-52
t
t
t
t
t
t
t
t
t
t
-35
-28
-31
-22
-29
-31
-21
-12
-19
-16
-5
Total adult population
*
1984 198
Source:EuropeanCommunitySurveys. Notes: For the total numberof cases for each year, see Table 1. For the distributionof respondentsby year 'Generational andValueChangein EightWestEuropeanSocieties',TableA8. Replacement
* Scorenot presentedbecauseof thesmallnumberof cases. for comparisonsacros t Scorenot presentedbecausethe advancedage of the cohort makesit non-representative remaining.
TABLE 9
Percentage of Postmaterialists Minus Percentage of Materialists in Ireland, by Y
Yearof survey:
1973 1976 1977 1978 1979 1980 1981 1982 1983 1984 198
Years of birth 1966 and after 1956-65 1946-55 1936-45 1926-35 1916-25 1906-15 Before 1906
* -10 -20 -37 -30 -40 -45
* -34 -43 -47 -45 -71 t
-25 -26 -38 -40 -41 -50 t
-16 -25 -38 -40 -45 -48 t
-8 -34 -37 -35 -36 -44
-20 -34 -45 -44 -49 -46
t
Total adult population
-28
-41
-40
-35
-31
* -18 -35 -33 -35 -52 -52
* -19 -31 -49 -37 -47 t
t
* -28 -35 -46 -46 -50 -51 t
* -21 -22 -38 -38 -49 t t
-9 -25 -31 -40 -43 -58 t t
-38
-40
-31
-34
-32
-35
Source:European Community Surveys.
Notes: For the total number of cases for each year, see Table 1. For the distribution of respondents by year 'Generational Replacement and Value Change in Eight West European Societies', Table A9.
* Score not presented because of the small number of cases. tScore not presented because the advanced age of the cohort makes it non-representative for comparisons acros remaining.
200
ABRAMSON
AND INGLEHART
post-war prosperity were greater in all six of the Continental European countries. As a result, differences between the formative socialization of younger and older Britons will be less pronounced than those between younger and older Continental Europeans. The relatively weak relationship between age and Materialist/Postmaterialist values in the United States also supports a generational interpretation.21 However, the cross-national results present somewhat of an anomaly, for age-group differences are clearly higher in Ireland, a country that remained neutral during the Second World War. Ireland, however, had relatively high rates of economic growth until the 1980s. To measure the relationship between age and Materialist/Postmaterialist values we computed a least-squares regression estimate down each row for each country. As noted above, value change is relatively weakly related to age in Britain, but even in Britain scores on the PDI decline by an average of 0.48 points per year of age.22In Germany the per annum decline is 0.79 points, in the Netherlands 0.79, in France 0.80, in Belgium 0.70 and in Italy 0.88. For the sixteen survey years for which we study Denmark and Ireland, the mean per annum decline on the PDI for both countries was 0.66 points. These results demonstrate that older Europeans are more likely to have Materialist values than younger Europeans. They do not demonstrate that Europeans become more Materialist as they age. These age-group differences could conceivably result from differences between the position of younger and older adults in the life cycle. But they could also result from differences between the formative socialization of young adults and that of their elders - or from some combination of the two. It is easy to advance a life-cycle explanation for the relatively high levels of Postmaterialism among young adults. Young adults have fewer family responsibilities and, as a consequence, less concern with economic problems. As they age, they are likely to marry, have children and face economic difficulties. Older adults, who often live on fixed incomes and who are also likely to depend upon government transfer payments, may be particularly sensitive to economic problems. The Postmaterialism of the young could therefore reflect youthful idealism among persons who have not yet faced economic realities. It is also plausible to argue that the relatively high levels of Postmaterialism among young Europeans result from differences between their formative socialization and that of their elders. This would be labelled a generational explanation, since a generation is 'a group of human beings who have undergone the same basic historical experiences during their formative years'.23Children and adolescents who grow up during periods of economic prosperity may place stronger emphasis on non-economic values. Since they expect their basic economic needs to be fulfilled, they are more likely to value self-actualization, oppor21
See Inglehart, The Silent Revolution; CultureShift. We employ ordinary least squares (OLS) estimates. The bottom-line statistic we report is based upon the mean relationship for all seventeen survey years. 23 Marvin Rintala, The Constitutionof Silence. Essays on GenerationalThemes(Westport, Conn.: Greenwood, 1979), p. 8. 22
GenerationalReplacementand Value Change
201
tunities to participate in decisions and other non-materialist values. Severe and protracted economic adversity would tend to change these values, but, in its absence, young Postmaterialists are likely to retain their values even as they age and move through the life cycle. These explanations for age-group differences lead to different expectations about the way birth cohorts should change with age. If the life-cycle explanation is correct, birth cohorts should become more Materialist as they age. Assuming that no other forces were at work, the per annum increases in Materialism would be close to the cross-sectional relationship between age and Materialism. A generational explanation, on the contrary, predicts that, in the absence of other forces, the value scores for cohorts should remain constant as they move through the life cycle. Given that we have data covering the course of two decades, it is easy to track birth cohorts over a good part of their subsequent life cycles. For example, Germans born between 1946 and 1955 were aged between 15 and 24 when our time series began. By 1990, they were aged between 35 and 44. When they were first sampled, Danes born during these years were aged between 18 and 27; by 1990, they were between 35 and 44 years old. Of course, the oldest cohorts cannot be tracked for the full two decades, since their numbers decline, and since differential death rates among these older cohorts might lead to misleading conclusions.24 The oldest cohort that can be tracked for a full two decades was born between 1916 and 1925. For the six original countries in our surveys, members of this cohort were aged between 45 and 54 when they were first sampled; in Denmark and Ireland they were aged between 48 and 57. By 1990, members of this cohort were between the ages of 65 and 74. We can track the 1956-65 cohort between 1976 and 199025and can track the 1906-15 cohort between 1970-71 and 1982 (or between 1973 and 1982 among the Danes and Irish). Although life-cycle and generational explanations for age-group differences lead to clearly different expectations, there is no definitive way of rejecting either interpretation. As cohorts age, they are subject not only to the effects of ageing, but to the social, economic and political conditions of the times. As Glenn pointed out some time ago, one can never distinguish between generational effects, period effects and ageing effects on statistical grounds alone, since any one of them is a perfect linear function of the other two.26As will
24 Differential death rates can lead to problems in tracking cohorts when they reach old age since Postmaterialists (who have higher levels of education and income) tend to live longer than Materialists. As their social composition changes older cohorts can become more Postmaterialist. Our analyses of educational levels among cohorts as they age suggest that by 1983 differential death rates were affecting the composition of the 1906-15 cohort, and in our analysis of replacement effects we do not use the results for this cohort after 1982. After 1973, we no longer employ results for the cohort born before 1906. 25 The full ten-year cohort is not actually sampled until 1980, however. 26 Norval D. Glenn, CohortAnalysis (Beverly Hills, Calif.: Sage, 1977).
202
ABRAMSON
AND INGLEHART
become clear, in seven of the eight countries we analyse, cohorts did not become more Materialist as they aged. One could still argue that there is a natural tendency for cohorts to become more Materialist with age, but that short-term forces prevented Materialism from emerging.27But this hardly means that a life-cycle and a generational explanation are equally plausible. In order to sustain a life-cycle interpretation, one would need to specify exactly what shortterm forces were preventing Materialism from emerging. Some short-term effects clearly do seem to be present, but they seem to reflect the impact of the major economic recessions of the mid-1970s and the early 1980s; when we control for the massive inflation rates of those periods, the short-term fluctuations largely disappear, leaving behind a pattern of stable generational differences.28 Moreover, the weak relationship between age and Materialist/ Postmaterialist values in Britain (and the United States) provides cross-national evidence supporting a generational interpretation (although the relationship between age and values in Ireland is somewhat anomalous). Proponents of a life-cycle explanation have thus far been unable to provide a comparable explanation for the presumed period effects that, supposedly, have prevented cohorts from becoming more Materialist during the two decades between 1970 and 1990.29
For our purposes, however, testing between alternative explanations is unnecessary. The way values change among birth cohorts as they move through the life cycle will directly determine the effects of replacement upon the overall distribution of values - regardless of the reason for these changes. If cohorts do become more Materialist as they age, this change - regardless of whether it results from life-cycle forces or from period effects - will tend to offset the effects of replacement. Despite replacement, the population may fail to become more Postmaterialist over time and may even move towards Materialism. If cohorts do not become more Materialist as they age - regardless of the reason - replacement will lead to rising levels of Postmaterialism. To determine how cohorts did in fact change as they moved through the life cycle, we computed a least-squares regression estimate across each row for each of the six cohorts that can be tracked for ten years or more.30Because the values for each cohort may fluctuate due to sampling error, we focus on
27
See, for example, W. Phillips Shively, 'Review of CultureShift in AdvancedIndustrialSociety', Journal of Politics, 53 (1991), 235-8. Shively argues that Inglehart's analyses do not demonstrate that age-group differences result from generational effects since his analyses do not definitively reject a life-cycle interpretation. 28 See Inglehart, CultureShift. 29 For an example of such an attempt, see Ferdinand Boltken and Wolfgang Jagodzinski, 'In an Environment of Insecurity: Postmaterialism in the European Community, 1970 to 1980', Comparative Political Studies, 17 (1985), 453-84. 30 Once again, we employ OLS estimates. For these estimates, we track the 1956-65 cohort from 1980 through 1990, since the full ten-year cohort is not sampled until 1980. For Denmark and Ireland, we track the 1906-15 cohort between 1973 and 1982.
GenerationalReplacementand Value Change
203
a bottom-line estimate based upon the mean per annum change for all six cohorts.3' Our results are not consistent with the expectations of a life-cycle explanation. Only in Belgium did Materialism increase with age, with the PDI score declining at an annual rate of 0.63 per year of ageing. The decline in Belgium closely matches the expected decline based upon the cross-sectional relationship between age and Materialism. But in Germany PDI scores rose with age, increasing at a per annum rate of 1.94 points, and they also increased in Britain (1.29 points), the Netherlands (1.12 points), and Denmark (2.20 points). In France, Italy and Ireland there was relatively little change in values as cohorts moved through the life cycle, although for all three cases there was a small average increase in the PDI scores (0.34 points per annum in France; 0.24 points in Italy; and 0.62 points in Ireland). Regardless of whether or not one accepts a life-cycle or generational explanation for age-group differences, examining these relationships provides a strong clue about the likely effects of generational replacement upon the aggregate distribution of values. As Materialism did increase with age in Belgium, we would not expect replacement to lead to increases in Postmaterialism, but even in Belgium replacement might prevent a movement towards Materialism. In Germany, Britain, the Netherlands and Denmark the movement towards Postmaterialism cannot result from replacement alone, since it must also result from a movement towards Postmaterialism among the cohorts that were sampled throughout the course of the last two decades. But given that values changed relatively little with age in France, Italy and Ireland, it seems likely that generational replacement was the major force moving these countries towards Postmaterialist values. Before we examine the evidence further,we should analyse systematically the possible effects of generational replacement. THE POSSIBLE
IMPACT
OF GENERATIONAL
REPLACEMENT
To estimate the impact of generational replacement, we can algebraically create a population in which no replacement occurs.32The first step in creating this imaginary population is to remove new cohorts from the calculations. Artificially eliminating the younger cohorts that reached adulthood after 1970-71 (or after 1973 in the case of Denmark and Ireland) is a major step, but it does not take into account the differential death rates among the older cohorts. To estimate the impact of death rates, we algebraically immortalize the older cohorts. To do this we use the proportion of respondents in each cohort in 1970-71 as our base,33multiply value scores for each cohort in subsequent 3 This procedure for estimating change over time was introduced by Philip E. Converse, The Dynamics of Party Support:Cohort-AnalyzingParty Identification(Beverly Hills, Calif.: Sage, 1976). 32 See Paul R. Abramson, Political Attitudes in America. Formation and Change (San Francisco: W. H. Freeman, 1983). 33 For Denmark and Ireland we use the proportion of respondents in each cohort in 1973 as our base.
204
ABRAMSON
AND INGLEHART
surveys by these proportions and sum these products. This estimate with the effects of replacement removed can then be compared with the actual result. Differences between the actual result and the estimated results can be attributed to replacement. Generational replacement can lead to six different outcomes.34 One is for replacement to have no effect. Given the observed relationships in Tables 2 through 9, however, replacement must have an effect, since our procedures remove the young cohorts, which always have relatively high scores on our index, and increase the size of the older cohorts with relatively low scores. Given the observed results, there are thus really only five possible outcomes. These hypothetical possibilities are displayed in Figure 1. Case A depicts a situation in which Postmaterialism rises among the public (the solid line). In this case, when the effects of replacement are removed (the broken line), no change occurs. We conclude that the rise in Postmaterialism results from generational replacement, since once these effects are removed the index score is unchanged. Replacement creates the trend. In Case B Postmaterialism also rises. However, Postmaterialism now rises when the effects of replacement are removed, but the increase is smaller (in this example, it is cut by half). While there would have been an increase in Postmaterialism even if no replacement had occurred, the increase would have been smaller. We conclude that replacement contributes to rising Postmaterialism. In Case C there is no change in our value index. After the effects of replacement are removed, however, Postmaterialism decreases. It is apparent that some sort of equilibrium has been achieved so that the changing composition of the population has been counterbalanced by increased Materialism among cohorts as they aged. The net result is overall stability in levels of Postmaterialism. We conclude that replacementprevents a trend towards Materialism. In Case D Materialism rises, leading to a decline in our value index. After the effects of replacement are removed, Materialism increases even more (doubling in our example). We conclude that replacement impedesa trend towards Materialism. In Case E, Postmaterialism rises. Once the effects of replacement are removed, however, Materialism increases. In this case, replacement reverses the direction of the trend.
THE IMPACT
OF GENERATIONAL
REPLACEMENT
Our estimates of the effects of replacement for each of the eight countries are presented in Figures 2 through 9. In each figure the solid line shows the actual value scores for the country, while the broken line presents our estimate
34
See Abramson, Political Attitudes.
GenerationalReplacementand Value Change 100
50 -
0 -
-50 -
-100
I
I
II
I
I
I
I
Time 1
Time 2 l Ixscore se ActualIndex A. rG
lr
IndexScore withno generationalreplacement n---0---
c
A. Generationalreplacementcreates a trend
100
50
0
-50 -
-100
I
I
I
I
I
I
I
Time 1
I
I
Time 2 Ix ActualActl Indexse score
IndexScore withno generationalreplacement
B.Generationalreplacementcontributesto a trend B. Generationalreplacementcontributesto a trend
205
206
ABRAMSON
AND INGLEHART
100
50 -
0
~ --0
-50
-100
I
Time 2
Time 1 Actualdex score
Index Score with no generational replacement
C. Generationalreplacementprevents a trend
100
50 -
0 _
~~ ~ ~ ~
"
~
-
-50 -
-100
Time 2
Time 1 Actual Index score
Index Score with no generational replacement
trend--a D. Generationalreplacementimpedes D. Generationalreplacementimpedesa trend
GenerationalReplacementand Value Change
207
100
50 -
0-
-50 -
-100 -100
I
l
I
I
I
l
I
Time 1
l
l
Time 2 Actual Index score
IndexScore withno generationalreplacement 't-0--'
E. Generationalreplacementreversesa trend Fig. 1. Possible effects of generational replacementon the distributionof Materialist/Postmaterialist values Source: Adapted from Abramson, Political Attitudes, Figure 4.2, pp. 62-3.
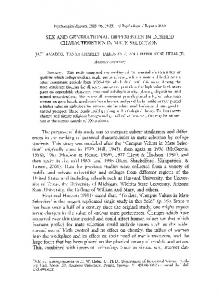
of what the scores would have been if there had been no replacement.35 Before reaching any conclusions, we will examine the pattern for each country. As Figure 2 shows, PDI scores in Germany remained relatively stable through 1981; if there had been no generational replacement, however, there would have been a small increase in Materialism (and hence a decline in the PDI). During this decade, replacement prevented a trend towards Materialism. In 1982, Postmaterialism rose sharply; if there had been no replacement, the PDI score in 1982 would have been identical to the score in 1970-71. If we ended our analyses with the 1982 surveys, we would conclude that replacement created a trend towards Postmaterialism. But Postmaterialism continued to rise after 1982 and at a faster rate than replacement alone could create. Between 1986 and 1989, there were more Postmaterialists than Materialists, and in 1990 there was an equal number. When the effects of replacement are removed, we find that Postmaterialism still rises, but the PDI is clearly negative in all five years. 35 In making these estimates, our main problem is assigning a value to cohorts that no longer are included in our matrix. As there is little evidence that cohorts become more partisan as they age, we assign the value based upon their scores for the last two survey years displayed in our cohort matrix. For Denmark and Ireland we base our value for the cohort born before 1906 on the PDI score in the 1973 survey.
208
ABRAMSON
AND INGLEHART
40 30 20 10 0-10 -20 -
/
-30 -40 ---50 -60
I
I
I
I
I
I
I
I
I
I
I
I
I
I
I
70 71 72 73 74 75 76 77 78 79 80 81 82 83 84 85 86 87 88 89 90
ActualIndexScore -U---
IndexScore withno generationalreplacement --O--
Fig. 2. Percentage of Postmaterialists minuspercentage of Materialists in Germany. 1970-71 through 1990 Source: European Community Surveys Notes: The estimate with no generational replacement assumes that no cohorts born after 1955 entered the adult population and that older cohorts did not diminish through death. For the index scores for cohorts, see Table 2. For the distribution of respondents by years of birth, see Abramson and Inglehart, 'Generational Replacement and Value Change in Eight West European Societies', Table A2.
The results for the five most recent years are similar, and 1989 provides a clear example. Between 1970-71 the PDI score rose 40 points; if there had been no replacement, the increase would have been only 20 points. About half the movement towards Postmaterialism would have occurred even if there had been no replacement; about half the trend results from replacement. Between 1970-71 and 1990 there was a 35-point increase in the PDI; if there
had been no replacement, the PDI would have increased by 15 points. Somewhat over half the increase in the PDI thus results from generational replacement. In Britain (see Figure 3), PDI scores during the first decade of our surveys are somewhat more erratic, but we detect a small increase in Postmaterialism between 1970-71 and the early 1980s. If there had been no replacement, there would have been a small decline in the PDI. Postmaterialism rises fairly consistently between 1981 and 1989, although it dropped marginally in 1990. In the three most recent years, there were close to equal numbers of Postmaterialists and Materialists. If there had been no replacement during these two decades,
GenerationalReplacementand Value Change
209
40 30 20 10 -
-10 -20 --30 -
-r
/
N.
-40 -50 -60 70 71 72 73 74 75 76 77 78 79 80 81 82 83 84 85 86 87 88 89 90
ActualIndexScore -U---
IndexScore withno generationalreplacement ---0---
Fig. 3. Percentage of Postmaterialists minuspercentage of Materialists in Britain: 1970-71 through 1990 Source: European Community Surveys. Notes: The estimate with no generational replacement assumes that no cohorts born after 1955 entered the adult population and that older cohorts did not diminish through death. For the index scores for cohorts, see Table 3. For the distribution of respondents by years of birth, see Abramson and Inglehart, 'Generational Replacement and Value Change in Eight West European Societies', Table A3.
there would have been an increase in Postmaterialism, but Materialists would clearly outnumber Postmaterialists. Between 1970-71 and 1989 there was a 26-point increase on the PDI; if there had been no replacement, the increase would have been 15 points. About three-fifths of the increase in Postmaterialism would have occurred even if there had been no generational replacement; the remaining two-fifths resulted from replacement. Between 1970-71 and 1990 there was a 27-point increase in the PDI; if there had been no replacement, the increase would have been only 12 points. Somewhat over half the increase in Postmaterialism in Britain resulted from generational replacement. In the Netherlands (see Figure 4), there is little value change through 1977, a sharp increase in the PDI in 1978, followed by a decline through 1980. Between 1970-71 and 1980 and 1981 there was a small increase in Materialism; if there had been no replacement, there would have been a more substantial increase. But Postmaterialism rises fairly continuously throughout the 1980s, becoming positive from 1985 onwards. Postmaterialism would have risen even if there had been no generational replacement, but Materialists would have continued
210
ABRAMSON
AND
INGLEHART
40 30 20 -
10 -40 -50 -
-60
1
I
I
I
!i I
iI
I
I
I
I
I
I!
70 71 72 73 74 75 76 77 78 79 80 81 82 83 84 85 86 87 88 89 90
ActualIndexScore
IndexScore withno generationalreplacement
......---
Fig. 4. Percentage of Postmaterialists minuspercentage of Materialists in the Netherlands: 1970-71 through1990 Source: European Community Surveys. Notes: The estimate with no generational replacement assumes that no cohorts born after 1955 entered the adult population and that older cohorts did not diminish through death. For the index scores for cohorts, see Table 4. For the distribution of respondents by years of birth, see Abramson and Inglehart, 'Generational Replacement and Value Change in Eight West European Societies', Table A4.
to outnumber Postmaterialists. On balance, replacement made a major contribution to the rise of Postmaterialism. Between 1970-71 and 1989 there was a 31-point increase in our value index; if there had been no replacement, the increase would have been only 13 points. Just over two-fifths of the rise in Postmaterialism would have occurred even if there had been no generational replacement. Nearly three-fifths of the increase in Postmaterialist values appears to result from replacement. Between 1970-71 and 1990 there was a 28-point increase in the PDI; if there had been no replacement, the increase would have been only 9 points. Two-thirds of the increase in Postmaterialism appears to result from replacement. In France (see Figure 5), there is also some erratic movement in the PDI during the 1970s, but, as in the Netherlands, there was a small increase in Materialism between 1970-71 and 1980 and 1981. If there had been no replacement, however, there would have been a clear rise in Materialism. During this decade, replacement prevented a movement towards Materialist values.
GenerationalReplacementand Value Change
211
40 30 20 10 0 -
-10 -20 -X 13-,,
---0--E-_0 --
-40 -
-50 -
-6 -60
I
i
I
I
I 1I
I
I
iI
I
I
t i
I
I
iI
70 71 72 73 74 75 76 77 78 79 80 81 82 83 84 85 86 87 88 89 90
ActualIndexScore -U
IndexScore withno generationalreplacement ---0.---
Fig. 5. Percentage of Postmaterialists minuspercentage of Materialists in France: 1970-71 through 1990 Source: European Community Surveys. Notes: The estimate with no generational replacement assumes that no cohorts born after 1955 entered the adult population and that older cohorts did not diminish through death. For the index scores for cohorts, see Table 5. For the distribution of respondents by years of birth, see Abramson and Inglehart, 'Generational Replacement and Value Change in Eight West European Societies', Table A5.
After 1981, there is a gradual increase in Postmaterialism. There is also an increase once the effects of replacement are removed, but the rise is small. Although Materialists continue to outnumber Postmaterialists, the PDI score is clearly higher in the four most recent years than it was in our first surveys. Yet, if there had been no replacement, the PDI score would have been very similar in these recent years to its value in 1970-71. Between 1970-71 and 1989 there was a 24-point increase in our value index; if there had been no replacement, the increase would have been only 5 points. Between 1970-71 and 1990 there was a 23-point increase in the PDI; if there had been no generational replacement, the increase would have been only 4 points. Clearly, generational replacement was the main force moving the French public towards Postmaterialist values. Belgium shows only a very faint pattern of rising Postmaterialism, but, as Figure 6 reveals, replacement still played a major role in contributing to the overall distribution of Materialist/Postmaterialist values. Although the PDI
212
ABRAMSON
AND INGLEHART
40 30 20 10 -
0 -10 -20-30 -40 -
0'
-50 -60
I I I I I I I I I I I I I I l 70 71 72 73 74 75 76 77 78 79 80 81 82 83 84 85 86 87 88 89 90
ActualIndexScore -U---
IndexScore withno generationalreplacement ---0---
Fig. 6. Percentage of Postmaterialists minuspercentage of Materialists in Belgium: 1970-71 through 1990 Source: European Community Surveys. Notes: The estimate with no generational replacement assumes that no cohorts born after 1955 entered the adult population and that older cohorts did not diminish through death. For the index scores for cohorts, see Table 6. For the distribution of respondents by years of birth, see Abramson and Inglehart, 'Generational Replacement and Value Change in Eight West European Societies', Table A6.
score rose somewhat between 1970-71 and 1973, there is a fairly continuous increase in Materialism between 1973 and 1983. If there had been no replacement, the increase in Materialism would have been greater. Replacement, therefore, appears to have impeded a trend towards Materialism. After 1983, Postmaterialism tends to rise; but even in the three most recent years, when the PDI is highest, it is still only slightly higher than it was when our time series began. Between 1970-71 and 1989 our value index rose only 6 points; if there had been no replacement, however, the PDI would have declined 9 points. Between 1970-71 and 1990, the PDI rose 7 points; if there had been no replacement, the PDI would have declined 8 points. It seems reasonable to conclude that replacement prevented a movement towards Materialist values. In Italy (see Figure 7), Materialism rose fairly sharply between 1970-71 and 1980 and 1981. If there had been no replacement, the fall on the PDI would have been sharper, so, as with Belgium, we can conclude that replacement impeded a movement towards Materialism. But Postmaterialism continued to
GenerationalReplacementand Value Change
213
40 30 20 10 0 -
-20 -30
--
-40 -50 -
'O
1990 -60 89 90 90 74 75 76 77 77 78 78 79 79 80 80 81 81 82 82 83 83 84 84 85 85 86 86 87 87 88 88 89 71 72 72 73 75 76 73 74 70 71 70
ActualIndexScore
IndexScore withno generationalreplacement
minus percentage 1970-71 through Materialists in Italy.' through Postmaterialists minus Italy: 1970-71 percentage of Materialists Fig. 7. Percentage Percentage of Postmaterialists Fig. 1990 Source: European Community Surveys. Notes: The estimate with no generational replacement assumes that no cohorts born after 1955 entered the adult population and that older cohorts did not diminish through death. For the index scores for cohorts, see Table 7. For the distribution of respondents by years of birth, see Abramson and Inglehart, 'Generational Replacement and Value Change in Eight West European Societies', Table A7.
rise throughout the 1980s, and in our three most recent surveys the PDI is clearly higher than it was during our baseline surveys. Between 1970-71 and 1989 the PDI rose 10 points; if there had been no replacement, our value index would have declined 8 points. One might conclude that replacement had reversed a trend towards Materialism. Between 1970-71 and 1990 the PDI rose 17 points; if there had been no replacement, the PDI would have declined 3 points. On balance, it is clear that replacement was a major force moving the Italian public towards Postmaterialism, for, in the absence of replacement, Materialism would have increased.
In Denmark (see Figure 8), unlike the seven other countries, there is actually a small increase in Postmaterialism during the 1970s; without replacement, there would have been very little change in PDI scores between 1973 and 1980. After 1980, there is a fairly continuous increase in Postmaterialism, and in the two most recent years the PDI score is positive. When the effects of replacement are removed, the value index rises, but the increase is substantially smaller.
214
ABRAMSON
AND INGLEHART
40 30 20 10 -
-10
-
-20 -30 -40 -50 I i i i i i i i i i i i i i! -60 -60 1 70 71 72 73 74 75 76 77 78 79 80 81 82 83 84 85 86 87 88 89 90
ActualIndexScore
IndexScore withno generationalreplacement -- -O
Fig. 8. Percentage of Postmaterialists minus percentage of Materialists in Denmark: 1973 through 1990 Source: European Community Surveys. Notes: The estimate with no generational replacement assumes that no cohorts born after 1958 entered the adult population and that older cohorts did not diminish through death. For the index scores for cohorts, see Table 8. For the distribution of respondents by years of birth, see Abramson and Inglehart, 'Generational Replacement and Value Change in Eight West European Societies', Table A8.
Between 1973 and 1989 there was a 42-point increase in our value index; if there had been no replacement, the increase would have been 26 points. In other words, about three-fifths of the increase in Postmaterialism resulted from generational replacement; about two-fifths of the increase appears to result from replacement. Between 1973 and 1990, the PDI rose 52 points; if there had been no replacement, the increase would have been 34 points. Just over a third of the increase in Postmaterialism resulted from generational replacement. In Ireland (see Figure 9), Materialism rose between 1973 and 1976, and the PDI score remains low through 1981. If there had been no replacement, the decline in our value index would have been somewhat greater. After 1981, there was a gradual rise in Postmaterialism and, although there are always more Materialists than Postmaterialists, the PDI score is clearly higher in the three most recent years than it was in 1973. Even when the effects of replacement are removed, our value index rises during the 1980s. But when the effects of
GenerationalReplacementand Value Change
215
40 30 20 10 0-10 -20 -30 --40 -50 -60
I I I i i i i i i i I 70 71 72 73 74 75 76 77 78 79 80 81 82 83 84 85 86 87 88 89 90
ActualIndexScore IU
IndexScore withno generationalreplacement ,---0--'
Fig. 9. Percentage of Postmaterialists minus percentage of Materialists in Ireland: 1973 through 1990 Source: European Community Surveys. Notes: The estimate with no generational replacement assumes that no cohorts born after 1958 entered the adult population and that older cohorts did not diminish through death. For the index scores for cohorts, see Table 9. For the distribution of respondents by years of birth, see Abramson and Inglehart, 'Generational Replacement and Value Change in Eight West European Societies', Table A9.
replacement are removed, the PDI is virtually the same in 1988 and 1989 as it was in our baseline surveys. Between 1973 and 1989, the PDI rose 14 points; if there had been no replacement, the value index would have declined one point. Between 1970-71 and 1990 the PDI rose 22 points; if there had been no replacement, there would have been a 6-point increase. It seems reasonable to conclude that replacement was the major force creating the trend towards Postmaterialism. Although these data demonstrate that generational replacement usually contributes to or causes rising levels of Postmaterialism,
they also show that there
are conditions under which replacement does not lead to the growth of Postmaterialist values. Belgium provides an obvious exception in a variety of ways. Changing inflation rates were relatively weakly related to short-term changes in values, Materialism increased among cohorts as they aged and, although replacement affected the overall distribution of values, its basic effect was to impede a movement towards Materialism. The pattern in Belgium is explicable,
216
ABRAMSON
AND INGLEHART
however. Although inflation rates were not especially high, there were high levels of unemployment. Unemployment rates were 10 per cent or higher between 1981 and 1988, the highest in any of these countries except Ireland. Government policies may have contributed to disaffection, for the Belgian government introduced austerity measures that cut unemployment and health benefits and froze pensions and wages. In the early 1980s, Belgians experienced a 30 per cent decline in real income. These hardships contributed to a sharp drop in life satisfaction among the Belgian public, whereas in the other seven countries levels of life satisfaction remained relatively stable.36These difficulties also contributed to an increase in Materialism as Belgians aged. Were it not for the offsetting impact of replacement, overall levels of Materialism would have increased further. The Belgian case illustrates that the trend towards Postmaterialism is not inevitable, even though in most societies young adults are more likely to have Postmaterialist values than their elders.
RESULTS FOR A COMBINED SAMPLE OF SIX WEST EUROPEAN
PUBLICS
The results for the eight European countries clearly demonstrate that replacement can have a variety of effects. But even though we have sizeable samples, the Ns become fairly small once we divide the samples into birth cohorts. By weighting each national sample according to each country's population, we can create a combined sample. Several analyses have relied upon a combined sample of the original six countries.37Combining these samples yields a massive sample size. For most years we have over 10,000 cases. With this massive N, sampling error is greatly reduced, and differences of even 3 percentage points are unlikely to result from chance. Most of our cohort estimates can be based upon over 1,000 cases, and even the smallest cohorts contain over 600 cases. Table 10 presents the distribution of values among the combined sample of Germany, Britain, France, the Netherlands, France, Belgium and Italy. As can be seen, between 1970-71 and 1990 the proportion of Postmaterialists nearly doubles and the proportion of Materialists is nearly halved. These changes are reflected in our value index. In our baseline surveys, there were more Materialists than Postmaterialists, and our index registered -29. In 1990, there were almost equal numbers of Postmaterialists and Materialists, and the PDI score was -4. Of course, there is year-to-year variation in the PDI score and this variation is very unlikely to result from chance. As has been demonstrated, short-term variation in values is strongly related to changes in inflation 36
See Inglehart, CultureShift. See Abramson and Inglehart, 'Generational Replacement and Value Change in Six West European Societies'; Abramson and Inglehart, 'Generational Replacement and the Future of PostMaterialist Values', Journal of Politics, 49 (1987), 231-41; Inglehart, 'Aggregate Stability and Individual-Level Flux in Mass Belief Systems: The Level of Analysis Paradox', American Political Science Review, 79 (1985), 97-116; Inglehart, CultureShift. 37
GenerationalReplacementand Value Change
217
rates.38According to our calculations, the relationship between changes in the average rate of inflation for these six countries (with countries weighted according to their population) and the scores on our value index is 0.81.39 As with our study of individual countries, short-term change should not obscure the impact of longer-term changes, and these changes are largely driven by generational replacement. Elsewhere, we employ census data and present the combined adult population in these six countries at the end of 1970 and 1990.40As we show, there was a very substantial decline in the number of Europeans born before 1906, and even the number of Europeans born between 1906 and 1915 fell by half during these two decades. But during these decades 77,000,000 Europeans born after 1955 reached adulthood, and they made up 37 per cent of the adult population. In other words, over a third of the adult population of these countries had been replaced. We also present the overall distribution of our combined sample by years of birth and, as we show, the generational replacement in actual population is closely matched by our surveys.4 To measure the impact of replacement upon value change, we once again begin by dividing our sample into our birth cohorts measuring values among each cohort. Table 11 presents the PDI scores for each cohort for each survey year. As with our earlier tables, we can examine the relationship between age and Materialist/Postmaterialist values by reading down each column and can likewise determine how cohorts change as they age by reading from left to right across each row. Reading down the columns of Table 11 reveals a clear pattern. There is a consistent tendency for older cohorts to be more Materialist than younger cohorts. In thirteen of the seventeen survey years, there is a monotonic relationship as one reads down the columns. Breaks in monotonicity, where they occur, could easily result from sampling error. Computing a least squares regression estimate down each column demonstrates that scores on our value index decline at an average rate (the mean for all seventeen survey years) of 0.70 points per year of age. As with our individual countries, we are able to track six cohorts for at least one decade as they move through the life cycle. There is not a single instance in which cohorts are more Materialist in 1990 than when they were first surveyed. Computing a least squares regression estimate across each row, we find only the 1906-15 cohort (which we track through 1982) becomes more Materialist with age, while the five cohorts born between 1916 and 1965 become 38
See Inglehart, CultureShift. If we use a one-year lag to estimate the impact of inflation rates upon values, the correlation drops marginally to 0.78. 40 Abramson and Inglehart, 'Generational Replacement and Value Change in Eight West European Societies', Table A10. 4' Abramson and Inglehart, 'Generational Replacement and Value Change in Eight West European Societies', Table Al1. 39
TABLE 10
Distribution of Materialist/Postmaterialist
Year of survey:
1970-71
Postmaterialist Mixed Materialist Total percentage (Number) Score on Index
Year of survey: Postmaterialist Mixed Materialist Total percentage (Number) Score on Index
Values among Six West European Pub
1973
1976
1977
1978
1979
11% 50 40 101% (21,928) -29
10% 54 36 100% (10,564) -27
11% 50 39 100% (6,304) -28
9% 49 43 101% (11,823) -34
12% 52 36 100% (11,947) -24
12% 52 36 100% (6,010) -24
1983
1984
1985
1986
1987
1988
13% 53 35 101% (11,681) -22
14% 54 31 99% (11,802) -17
14% 54 32 100% (11,871) -17
14% 58 28 100% (11,790) -13
17% 57 26 100% (11,406) -8
19% 57 24 100% (11,593) - 5
Source:EuropeanCommunitySurveys. Notes:We used combinednationalsamplesof Germany,Britain,the Netherlands,France,Belgiumand Italy. A However,the numberof casesin parenthesesis the actualnumberof respondentswho receiveda scoreon the valu of Postmaterialists minuspercentageof Materialists.
TAB LE 11
Percentage of Postmaterialists Minus Percentage of Materialists among Six Wes of Birth, 1970-71 through 1990
Year of survey:
1970-71 1973 1976 1977 1978 1979 1980 1981
Years of birth 1966 and after 1956-65
1946-55 1936-45 1926-35 1916-25 1906-15 Before 1906 Total adult population
* *
*
-10 -21 -29
-2 -8 -26
-5 -12 -21
-17 -26 -39
-19 -26 -35
-40 -43 -49
-41 -44 -50
-3 -22
-7 -22
-5 -12 -25
-29 -34 -43
-32 -35 -41
-35 -37 -46
-40 -46 -56
-30 -35 -42
-35 -33 -38
-50
-48
t
t
t
tt
-29
-27
-28
-34
-24
-24
1982 1983 1984 19 -4
0
-4
-12 -25
-6 -14 -27
-3 -10 -17
-1 -1
-34 -40 -44
-33 -34 t
-26 -29 t
-2 -3
0
t -35
-34
-20
-22
-17
-1
Source:European Community Surveys.
Notes: We use combined national samples of Germany, Britain, the Netherlands, France, Belgium, and Italy. year, see Table 10. For the distribution of respondents by years of birth, see Abramson and Inglehart, 'Gene in Eight West European Societies', Table Al1.
*Scorenot presentedbecauseof the smallnumberof cases.
tScore not presented because the advanced age of the cohort makes it non-representative for comparisons acros remaining.
220
ABRAMSON
AND INGLEHART
40 30 20 10 0 -10 -20 -30
-0
E-
~ "
-40 -
'
-03
-50 -60
70 71 72 73 74 75 76 77 78 79 80 81 82 83 84 85 86 87 88 89 90 ActualIndexScore -U-
IndexScore withno generationalreplacement --O--'
Fig. 10. Percentage of Postmaterialists minuspercentage of Materialists among six West European publics. 1970-71 through1990 Source: European Community Surveys. Notes: We used combined national samples of Germany, Britain, the Netherlands, France, Belgium and Italy. The estimate with no generational replacement assumes that no cohorts born after 1955 entered the adult population and that older cohorts did not diminish through death. For the index scores for cohorts, see Table 11. For the distribution of respondents by years of birth, see Abramson and Inglehart, 'Generational Replacement and Value Change in Eight West European Societies', Table All.
more Postmaterialist as they move through the life cycle. The mean change per annum for all six cohorts reveals that the value index increases 0.98 points per year of ageing. While these results do not allow us definitively to reject a life-cycle interpretation, they provide a strong clue about the impact of generational replacement. We know that Postmaterialism increased over time, but since cohorts became more Postmaterialist replacement cannot account for all of this change. But as the older cohorts that were heavily Materialist died out and as younger more Postmaterialist cohorts entered the adult population, replacement must have contributed to the rise of Postmaterialism. Figure 10 allows us to estimate the impact of generational replacement. As with our earlier figures, the solid line shows the actual scores on our value
GenerationalReplacementand Value Change
221
index; the dotted line presents our estimate of what the PDI score would have been if there had been no generational replacement.42 As Figure 10 reveals, there was a rise in Materialism between 1970-71 and the early 1980s. If there had been no replacement during this decade, the rise in Materialism would have been greater. After 1981, however, there is a gradual increase in Postmaterialism. By 1984 and 1985 the PDI was 12 points higher than it was in our baseline surveys. If there had been no replacement, the PDI would have been the same in 1984 and 1985 as it was in 1970-71. The combined European sample, therefore, provides a classic example of replacement creating a trend.43In an earlier study, we predicted that generational replacement would contribute to increased Postmaterialism after 1985,44but it actually rose faster than we predicted.45Between 1970-71 and 1988, the PDI score rose 24 points, and by 1989 it had risen 26 points. In 1990, the PDI was 25 points higher than in our baseline surveys. According to our estimates, if there had been no replacement the PDI would have risen by only 7 points between 1970-71 and 1988. In other words, three-tenths of the rise would have occurred even if there had been no generational replacement. Seventenths of the rise in Postmaterialism resulted from replacement. If there had been no replacement, the PDI would have increased 10 points between 1970-71 and 1989. Just under two-fifths of the rise in Postmaterialism would have occurred even if there had been no generational replacement. On the other hand, three-fifths of the rise results from replacement. If there had been no generational replacement, the PDI would have increased only 7 points between 1970-71 and 1990. Just over one-fourth of the increase in Postmaterialism would have occurred if there had been no replacement; nearly three-fourths of the increase resulted from generational replacement. While analysis of our combined sample no longer provides a classic example of replacement creating a trend, it still provides a clear example of replacement serving as the major force contributing to the rise of Postmaterialism.
42 As with our earlier estimates, the major problem we face is assigning a value score for cohorts too old to appear in our matrix. After 1973, we no longer present results for the cohort born before 1906. We set the value for that cohort according to the mean of its index scores for the 1970-71 and the 1973 surveys. After 1982, we no longer utilize results for the 1906-15 cohort. We assign a value to this cohort based upon the mean of its index scores for 1981 and 1982. 43 See Abramson and Inglehart, 'Generational Replacement and Value Change in Six West European Societies'; 'Generational Replacement and the Future of Post-Materialist Values'. 44 See Abramson and Inglehart, 'Generational Replacement and the Future of Post-Materialist Values'. 45 See Abramson and Inglehart, 'Generational Replacement and the Future of Post-Materialist Values'. The reason that we underpredicted the growth of Postmaterialism is readily apparent from the results in Table 11. All six cohorts that can be tracked between 1985 and 1990 moved towards Postmaterialism. As we made clear in our earlier analysis, we can estimate future population replacement but cannot estimate future period effects.
222
ABRAMSON
GENERATIONAL POSTMATERIALIST
AND INGLEHART
REPLACEMENT
AND
THE FUTURE
OF
VALUES
Just as algebraic techniques can be used to estimate the past impact of replacement, so they can also be employed to project its future impact.46Of course, we do not know what values these cohorts will have in future years, but we do have census estimates of the future population distributions of these eight countries. In all eight, the future impact of replacement is limited by the same demographic reality. Replacement will be slower during the coming two decades than it was during the last two decades. Population projections for the eight countries published by the Statistical Office of the European Communities fortuitously match the cohort categories we employ in our analyses, although they present estimates for the beginning of 2000, 2010 and 2020 - nine, nineteen and twenty-nine years from the end of 1990. We shall ignore projections for 2020, which are heavily based upon estimates of future birth rates. But, assuming that the interview age of future surveys remains unchanged, most of the Europeans to be sampled in 2010 have already been born. In every country except Ireland, the cohorts born between 1976 and 1985 and between 1986 and 1995 are projected to be smaller than the cohorts born between 1956 and 1965 and between 1966 and 1975, and in Ireland they are projected to be the same size as these two older cohorts. As a result of low birth rates, therefore, replacement will be relatively slow. As we saw, in the two decades between the end of 1970 and the end of 1990, 35 per cent of the German adult population had been replaced; during the two decades (actually nineteen years) between the end of 1990 and the beginning of 2010, only 25 per cent will be replaced.47During the two decades covered by our surveys, 37 per cent of the British population was replaced; between 1990 and 2010, only 31 per cent will be replaced. Thirty-nine per cent of the adult population in the Netherlands was replaced between 1970 and 1990; during the next two decades, only 29 per cent will be. In France, 36 per cent of the adult population was replaced during the past two decades, but only 31 per cent will be replaced during the next two. In Belgium, 37 per cent of the adult population was replaced between 1970 and 1990; between 1990 and 2010 only 28 per cent will be. In Italy, 38 per cent of the adult population was replaced during the past two decades; between 1990 and 2000 only 25 per cent will be. During the seventeen years between the end of 1973 and the end of 1990, 31 per cent of the Danish adult population was replaced; during the next nineteen years, 28 per cent will be. In Ireland, 38 per cent of the adult population
46 See Abramson and Inglehart, 'Generational Replacement and the Future of Post-Materialist Values'. 47 We should remind our readers that these projections were based upon the West German population.
GenerationalReplacementand Value Change
223
was replaced during the seventeen years of our surveys; during the next nineteen years, 34 per cent of it will be. Although algebraic techniques could be employed to predict future value change in each of the eight countries, we will restrict our projections to our combined sample of Germany, Britain,the Netherlands, France, Belgium and Italy. Our first task is to estimate the future cohort distribution of these six countries. As noted above, we have census projections for each of these countries, and the combined results for all six are presented in Table 12. During the next two decades, the older cohorts will greatly diminish in size. At the end of 1990, the cohorts born before 1936 made up 31 per cent of the adult population.48 As Table 12 reveals, by the beginning of 2000, they will make up only 20 per cent and by the beginning of 2010 they will make up only 10 per cent. According to our calculations, between the end of 1990 and the beginning of 2000, 30,000,000 West Europeans will reach adulthood, and by the beginning of 2010, there will be over 60,000,000 new adults. But both the 1976-85 and the 1986-95 cohorts will be smaller than the cohorts born between 1956 and 1965 and between 1966 and 1975. As a result, replacement will be relatively slow. As we reported above, in the two decades between 1970 and 1990, 37 per cent of these countries' adult population had been replaced. During the nine years between the end of 1990 and the beginning of 2000, only 14 per cent of it will be replaced and during the nineteen years between the end of 1990 and the beginning of 2010 only 28 per cent will be. In making our projections about the future impact of replacement upon European values, we must use information about the current values of these cohorts, and we shall base our projections upon their PDI scores of these cohorts as of 1990.49The main uncertainty is in making these projections is estimating the future values of cohorts that have yet to be sampled. In fact, we have no sample of Europeans born after 1975 and therefore have no information about the actual values of the two youngest cohorts. However, we do know that in all seventeen survey years the youngest full ten-year cohort in all our surveys has had higher PDI scores than the second youngest cohort.50 None the less, for our first projection we assume that all cohorts born after 1975 will enter adulthood with a value score identical to that of the cohort born between 1966 and 1975. For our second projection, we will assume that, as in all previous surveys, the entering cohorts will be more Postmaterialist than the adjacent older cohorts. Our basic projection assumes that cohorts maintain their 1990 levels of Post48 See Abramson and Inglehart, 'Generational Replacement and Value Change in Eight West European Societies', Table A10. 49 We also made similar projections based upon the mean of the cohort values for 1988, 1989 and 1990. These projections are only negligibly different from the results we present in Figure 11. 50 For surveys between 1970-71 and 1979 we compare the 1946-55 cohort with the 1936-45 cohort; for surveys between 1980 and 1990, we compare the 1956-65 cohort with the 1946-55 cohort.
224
TABLE
ABRAMSON
12
AND
INGLEHART
Projected CombinedAdult Population of Six West European Publics in 2000 and 2010, by Yearsof Birth Year of projection 2000
2010
Years of birth
Number in thousands
%
1986-95 1976-85 1966-75 1956-65 1946-55 1936-45 1926-35 1916-25
30,543 37,923 40,048 35,263 29,050 24,029 13,945
0.0 14.2 17.6 18.6 16.3 13.5 11.1 6.5
4,917
2.3
Before 1916
Total
215,718
100.1
Number in thousands
%
30,815 30,057 37,727 39,251 33,233 24,957 16,158
14.2 13.8 17.3 18.0 15.3 11.5 7.4
5,464
2.5
217,662
100.0
Source: Recalculated from census projections in Statistical Office of the European Communities,
Statistics(Luxembourg: StatisticalOfficeof theEuropeanCommunities,1990),Tables Demographic 1-3 and 1-4. The estimates are as of 1 January 2000 and 1 January 2010. The results combined
populationprojectionsfor WestGermany,Britain,the Netherlands,France,BelgiumandItaly. Note: The oldest cohort for 2010 includes Europeans born before 1926.
materialism. In view of past patterns, this is a conservative assumption, since we found no evidence that cohorts became more Materialist with age. Moreover, this assumption allows us to estimate the impact of future replacement, since any change in the value index can result only from changes in cohort composition. The results of our estimates are presented in Figure 11. The solid line shows the actual PDI scores among the European public between 1970 and 1990; the broken line shows our projection given these stable values. We make this projection by multiplying the observed PDI scores in 1990 (Table 11) by the projected cohort distribution in 2000 and 2010 (Table 12) and by summing these products. As can be seen, the PDI score rises slightly (to a reading of +0) by 2000 and rises somewhat more by 2010 (to +4), a gain of 8 points during these two decades. Of course, the specific projected values for 2000 and 2010 are a function of the observed PDI scores for 1990 as well as the distribution of values among the cohorts. But the finding that future replacement will exert long-term pressure towards Postmaterialism is robust, as long as young Europeans are more Postmaterialist than their elders - a finding observed for all seventeen survey years. Overall levels of Postmaterialism will be somewhat higher if the cohorts entering the adult population during the next two decades are more
GenerationalReplacementand Value Change
225
40 30 20 -
10 -
-10 -20 -
-30 -40 -50 -60
1980
1970
1990
2000
2010
ActualScores FutureScores: Cohorts FutureScores: New Cohorts MorePostmaterialist Retain1990 Values Fig. 11. Projected PDI scores for six West Europeanpublics in 2000 and 2010 Source: European Community Surveys. Notes: We use combined national samples of Germany, Britain, the Netherlands, France, Belgium and Italy. For 1970-71 through 1990 we present the actual survey results. Projections for 2000 and 2010 are based upon 1990 cohort values, and upon assumptions about population replacement using national census projections. For the PDI scores among the cohorts in 1990, see Table 11. For our estimates of the future cohort distribution of the combined population of these six societies, see Table 12.
Postmaterialist than the cohort born between 1966 and 1975. As we noted, during the past two decades, the youngest full ten-year cohort has always been more Postmaterialist than the second youngest. The mean gap between the 1946-55 and the 1936-45 cohort is 10.1 points, the greatest gap between any two adjacent cohorts. This sharp difference results, in our view, from the substantially different formative socialization experiences of the cohort born after the Second World War, and the older cohort that experienced the war and the post-war economic deprivation. But there is also a substantial gap between the value scores of the two youngest ten-year cohorts. The 1956-65 cohort scored on average 8.5 points higher on the PDI than the 1946-55 cohort.51 The older cohorts do not differ as much from each other, but there is still a clear gap in PDI scores among them. The mean gap between the 1936-45 51 Based
upon comparisons between 1980 and 1990, the only years for which full ten-year cohorts can be compared.
226
ABRAMSON
AND
INGLEHART
cohort and the 1926-35 cohort is 8.1 points; the gap between the 1926-35 cohort and the 1916-25 cohort is only 3.4 points; and the gap between the 1916-25 cohort and the 1906-15 cohort is 6.9 points. The mean gap for all five comparisons is 7.4 points. We project this value forward and assume that the 1976-85 cohort will score 7.4 points higher on our value index than the 1966-75 cohort and that the 1986-95 cohort will score 7.4 points higher than the 1976-85 cohort. For our second projection we assume that all the cohorts actually sampled in 1990 will retain their 1990 values but that the two new entering cohorts will have these higher levels of Postmaterialism. The dotted line in Figure 11 shows our results based upon these assumptions. Given that cohorts born after 1975 are relatively small, the projected PDI is only slightly higher than with our first assumption. By 2000 the PDI rises to +1, a gain of 5 points over 1990, and by 2010 the PDI rises to +7, a gain of 11 points over the observed value in our 1990 surveys. These projections suggest that slowing rates of generational replacement may lead to slower rates of value change. Between 1970-71 and 1990 there was a 25-point gain on our value index among the European public. Nearly threefourths of this gain, a total of 18 points, resulted from replacement. On the basis of our first assumption, we expect the PDI to increase only 8 points during the next two decades, and on the basis of our second assumption it will increase some 11 points. If the PDI rises more, these gains are unlikely to result solely from generational replacement; they would probably be due, in part, to short-term forces conducive to Postmaterialism. Even though replacement is slowing, it is likely to remain a long-term force pushing Postmaterialism upwards. There are conditions under which replacement would not have this effect. If short-term forces lead to the erosion of Postmaterialist values, overall levels of Materialism might rise, but even under these conditions replacement is likely to impede the movement towards Materialism. DISCUSSION
Our analyses reveal that replacement has had a wide variety of effects during the past two decades. In Germany, Britain, the Netherlands and Denmark generational replacement contributed to the trend towards Postmaterialism, and in France, Italy and Ireland replacement was the major force creating the trend towards Postmaterialist values. Even in Belgium, where there was only a small move towards Postmaterialism, replacement may have prevented a movement towards Materialism. For the European public as a whole, replacement was the major force contributing to the rise of Postmaterialism. Moreover, replacement is likely to continue to influence the future distribution of values. Even though replacement will be at a slower rate during the coming two decades, it is likely to exert continued pressure pushing Postmaterialism upwards. These analyses underscore the gradualness of generational replacement. Two
GenerationalReplacementand Value Change
227
basic factors account for this gradualness. Firstly, population replacement is slow in advanced industrial societies, since they have relatively low birth rates and death rates. The low birth rates during the mid-1970s and the 1980s will lead to even slower rates of replacement in future decades. Of course, during the four decades between 1970 and 2010 there will be considerable change. According to our calculations, just over half the West European adult population (50.4 per cent) will be replaced during the twenty-nine years between the end of 1970 and the beginning of 2000. Half the Europeans to be surveyed in 2000 will be old enough to have been sampled in our earliest surveys. Between the end of 1970 and the beginning of 2010, over three-fifths (63.4 per cent) of the West European population will be replaced. Even so, nearly two-fifths of the Europeans sampled in 2010 will be old enough to have been included in our baseline surveys. Secondly, even though there are strong and consistent age-group differences in political values, all West Europeans share to some extent a common political culture. Older Europeans were socialized during periods of economic dislocation, yet they value Postmaterialist goals. In the 1990 EuroBarometer survey, nearly two out of three West Europeans born before 1926 chose at least one Postmaterialist goal. And, although the younger cohorts are more Postmaterialist, they, too, have concerns about economic and social security. Indeed, even among the cohort born after 1965, nearly three out of four chose at least one Materialist goal. Despite the gradual impact of replacement, it still seems likely that by 2010 Postmaterialists will outnumber Materialists. Assuming that the cohorts born after 1975 are no more Postmaterialist than the 1966-75 cohort (our first assumption), 23 per cent of the West Europeans will be Postmaterialists by the year 2010. If the new cohorts are more Postmaterialist (our second assumption), by 2010, 24 per cent will be Postmaterialists. Although Postmaterialists would still be a minority of the total population, the overall proportion of Postmaterialists would be more than twice as great as it was in 1970-71, when only one European in nine was a Postmaterialist. Moreover, a key comparison may be the ratio of Materialists to Postmaterialists. At the time of our first surveys, in 1970-71, Materialists held an overwhelming preponderance over Postmaterialists, outnumbering them by four to one. By 1990, the balance had already shifted dramatically, to a point where Materialists only slightly outnumbered Postmaterialists. If the projections based upon our first assumption prove correct, by 2000 there will be an equal number of Postmaterialists and Materialists, and by 2010 Postmaterialists will outnumber Materialists by a ratio of about six to five. And, if our second assumption proves correct, by 2010 Postmaterialists will outnumber Materialists by a ratio of about five to three. Given that Postmaterialists tend to be more highly educated and articulate than Materialists, they are likely to have a substantial impact on many issues, for they can often set the political agenda. The policy consequences of the growth of Postmaterialism are difficult to predict. Postmaterialists, for example, tend to support the peace movement,
228
ABRAMSON
AND
INGLEHART
but the pressures for decreasing defence expenditure currently result more from the breakdown of the Soviet military threat than from a shift in values. Postmaterialists tend to support the environmentalist movement, but environmental policies are also influenced by the changing price of imported fuel. And although Postmaterialists often favour left-wing parties, the growth of Postmaterialism could benefit conservative political forces by splitting the Left. Moreover, the success of left-wing political parties also depends upon the political skills of their leaders. The rise of Postmaterialism in Germany, for example, benefited the Greens during the 1980s, but that party's lack of enthusiasm for German unification led to their electoral collapse in 1990 in the states of what used to comprise West Germany. But in 1991, a Postmaterialist party in the Netherlands - Democrats, '66 - following a more adept electoral strategy, became the second strongest party in Dutch opinion polls. People's values alone do not determine what happens in politics: they interact with social and economic factors in specific political settings. Further speculation about the effects of growing Postmaterialism goes beyond the scope of this article. However, our goal has been accomplished. We have provided considerable evidence that the trend towards Postmaterialism during the past two decades was largely the result of generational replacement. Moreover, we have demonstrated that replacement is likely to be a long-term force contributing to the further spread of Postmaterialist values.