Generative Semantic Clustering in Spatial Hypertext Andruid Kerne, Eunyee Koh, Vikram Sundaram, J. Michael Mistrot Interface Ecology Lab Center for Study of Digital Libraries | Computer Science Department Texas A&M University, College Station, TX 77843, USA
{andruid, eunyee, vikram}@csdl.tamu.edu,
[email protected] ABSTRACT
1. INTRODUCTION
This paper presents an iterative method for generative semantic clustering of related information elements in spatial hypertext documents. The goal is to automatically organize them in ways that are meaningful to the user. We consider a process in which elements are gradually added to a spatial hypertext. The method for generating meaningful layout is based on a quantitative model that measures and represents the mutual relatedness between each new element and those already in the document. The measurement is based on attributes such as metadata, term vectors, user interest expressions, and document locations. We call this model relatedness potential, because it represents how much the new element is related and thus attracted to existing elements as a vector field across the space. Using this field as a gradient potential, the new element will be placed near the most attracted elements, forming clusters of related elements. The relative magnitude of contribution of attributes to relatedness potential can be controlled through an interactive interface.
Spatial hypertext allows people to organize documents to visually represent the implicit relationships between information elements. However, people are awash in information, and may not always have time to engage in organization. We need to discover methods for generating semantically meaningful document layouts to help people organize information according to their own significant criteria. Many daily activities involve monitoring news from a variety of sources, collecting articles on topics of interest, relating them to ongoing collections, and organizing them around new initiatives. As there are many information sources to monitor, such tasks take considerable time and attention. For example, an RSS feed can provide a stream of references to new articles on a topic [19]. Ideally, a generative system will collect the articles and elements that are most relevant to the user and organize these elements to facilitate browsing, understanding, and discovering. This paper develops a method for automatically generating meaningful semantic organization of incoming streams of information elements, and to provide user-centered mixed-initiative means for regenerating alternative organizations/layouts of the same elements in a spatial hypertext document.
Unlike prior clustering methods such as k-means and selforganizing-maps, relatedness potential works well in iterative systems, in which the collection of elements is not defined a priori. Further, users can invoke relatedness potential to re-cluster elements, as they engage in on-the-fly provisional acts of direct manipulation reorganization and latching of a few most significant elements. A preliminary study indicates that users find this method generates spatial hypertext documents that are easier to read.
Marshall and Shipman define information triage as the process of sorting through relevant materials, and organizing them to meet the needs of the task at hand [15]. Different people have different approaches to sorting through information and different criteria for grouping them. Further, the individual may take a context specific approach to organization across different triaging activities. Priorities as bases for organization may vary.
Categories and Subject Descriptors H.5.4 [Information Interfaces and Presentation]: Hypertext/Hypermedia –navigation and user issues. I.7.2 [Document Preparation]: Document Preparation – Hypertext/hypermedia and Multi/mixed media.
Thus, modeling users’ organizational approaches is a hard problem. It involves understanding how users work, and identifying and quantifying the metrics they have in mind for performing the particular triaging task at hand. A system model of common approaches to organizing collections can be useful in automating the process of organization, and thus reducing the workload of triaging activities.
General Terms Documentation, Design, Human Factors
Keywords
A first step in modeling the triaging process of an individual is to quantify useful features [5] that can distinguish or classify the elements in the document that need to be triaged, based on the user’s task. Once a feature set for classifying, or clustering related elements is defined, the user must be able to tailor its application. Uniform application of such features could interfere with, rather than support processes of triage and organization [25]. It is important to discover an incremental formalization [26] method that is non-intrusive, intuitive, and easily reversible, in order to specify the user model for the organization.
spatial hypertext, generative hypermedia, clustering, mixedinitiatives, information triage, collections, document layout Permission to make digital or hard copies of all or part of this work for personal or classroom use is granted without fee provided that copies are not made or distributed for profit or commercial advantage and that copies bear this notice and the full citation on the first page. To copy otherwise, or republish, to post on servers or to redistribute to lists, requires prior specific permission and/or a fee. DocEng’05, November 2–4, 2005, Bristol, United Kingdom. Copyright 2005 ACM 1-59593-240-2/05/0011...$5.00.
84
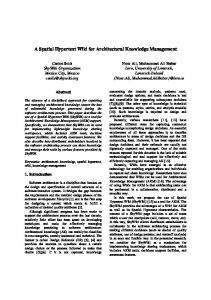
Figure 1. Spatial Hypertext Documents generated by combinFormation. The metadata and local tools of each information element are shown with mouse-over. The labels were added afterwards by hand. To provide background for this research, we first present relevant prior work in fields such as information visualization, information retrieval, and pattern recognition. The next two sections describe the information extraction process from existing documents and the clustering algorithm that is used to generate semantically clustered spatial hypertext. Then, the preliminary evaluation results for the proposed semantic clustering algorithm are presented. Finally, the discussion section will explore the benefits and limitations of the relatedness potential method for semantic clustering.
In this present research, we assume that in many cases people create semantic regions or clusters in a document where entities within each region are related to each other. We define features to measure relatedness for use in a clustering algorithm, which generates a semantically clustered layout of information elements in a spatial hypertext document. The documents discussed in this paper are created by combinFormation [8, 12]. This is a mixed-initiative [7] system for browsing, searching, and collecting information elements in an information space. The initiatives are the system’s generative actions, and the user’s direct manipulation actions. This system proactively collects information from information sources located on the Internet or the local hard disk, in formats such as RSS, HTML, and PDF. Concurrently, it also gradually generates a spatial hypertext layout of image and text elements. The user can modify the resulting information space through a set of editing and authoring operations, which include drag and drop, removing existing elements, creating and editing text elements, moving elements around, resizing elements, turning alpha-blending on/off for image elements, and changing the color/font-size/font-face of text elements. Besides these existing features supported by combinFormation, users can control the magnitude of contribution of attributes of the clustering algorithm proposed in this paper.
2. PRIOR WORK Users tend to work with and interact repeatedly with small clusters of information in which the individual elements need to be structured, grouped and spatially laid out. The WebForager and WebBook [1, 2] are particularly illustrative of this concept. The WebBook provides a structure for grouping web pages, while the WebForager provides a workspace for organizing and managing many WebBooks and lower level structures. Prior work has also addressed clustering documents for different purposes, which include speeding up searches, query expansion, and improving ease of information access. The Scatter/Gatherer system by Cutting et al [3, 4, 6] utilizes the Buckshot and Fractionation algorithms to define document cluster centers, given
85
a set of documents; it then uses the k-means algorithm to refine the generated clusters. Their system produced textual summaries for each document cluster, based on an aggregation of topical terms within that cluster. Scatter/Gatherer produces hierarchical clusters of similar documents, whereas our present goal is to produce visual clusters of related information elements in spatial hypertext. Further, Scatter/Gatherer primarily uses only the TermVector model [23] of document text to classify documents; whereas our system seeks to classify information elements on a number of attributes such as the information element’s TermVectors, metadata TermVectors, the domains the information elements came from, and the level of interest the user has expressed in them. Roussinov develops an interesting approach to visualizing and clustering a set of documents using scalable self-organizing maps [21]. Roussinov’s approach clusters documents and produces topical keyword summaries for the different regions of the self-organizing map. The nodes of the self-organizing map and the corresponding regions in the visual space get tuned to particular document TermVectors. The problem for a dynamic iterative system is that this is hard to change without subsequent re-training with different documents. Our goal as a user-centered application working with incoming streams of documents is to make the visual workspace adapt to new information and ongoing user expression. Users’ goals and sense of what is important may change iteratively [26]. So, we need an information space which can dynamically develop and change the sense of semantic significance, and thus of visual clusters.
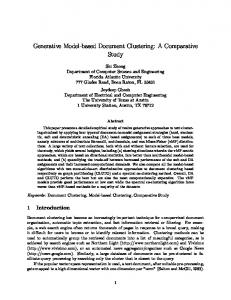
Figure 2. Visual workspace divided into matrix of cells, with each cell keeping track of the information elements that are placed upon it. structures. One is the hypermedia graph model, which connects elements to source container documents, and to hyperlinked documents. Weights are computed such that the more hyperlinks have been traversed, the lower the resulting weight, which favors breadth-first traversal. The other is the vector space model of information retrieval [23], which connects elements by common terms. These terms are stemmed [18] and added into the composite TermVector, except for stop words. Our stop word list includes usual terms, such as ‘a’ and ‘the’, and special web stop words, such as ‘adv’, ‘click’, and ‘e-mail’. Term vectors are supplemented by a pre-built term dictionary, which contains frequency counts for the set of terms discovered in 6000 web pages. This enables the computation of significance weights using inverse document frequency statistics.
NewsMap uses a tree-map visualization [27] to visually represent the relationships between news data and the unseen patterns in news media [28]. NewsMap retrieves news articles from the Google News aggregator, which is a dynamic information source, organizes them within specific regions for different categories such as business and technology, and colors each category differently. NewsMap is similar to the combinFormation news collage [8], except that the former uses title, instead of information elements as surrogates, and uses non-overlapping layout to deal with a collection of articles.
The models of information are used to drive decision-making in several generative threads of execution, which together can be said to comprise the agent that executes the systems’ initiatives. One of the agent threads is a web crawler, which periodically chooses a candidate hyperlink, and downloads the associated document, and processes it as above. Another thread directs the downloading of images.
Kang describes MediaFinder [9], a personal media management tool that develops the concept of rectangular Semantic Regions drawn and arranged in 2D space with semantics representative of the user’s mental models towards their personal media data. The user simply drags and drops media collection elements onto the MediaFinder workspace, and the system organizes it into the different semantic regions created. However, the semantic attributes of each region need to be explicitly specified, whereas our goal is to allow these regions to be developed spontaneously.
Yet another thread generates the spatial hypertext information space. It iteratively chooses a candidate information element to add to the space. This is a maximum select operation, based on the weights of elements in the candidate set. Next, it assigns a size to the new element. The size is chosen from a predetermined range, by doing a linear interpolation that measures the relative importance of the new element, compared to that of elements already in the information space. The next step is to place the element in the spatial hypertext.
3. SPATIAL HYPERTEXT GENERATION combinFormation is a mixed-initiative system for browsing, searching, and collecting that uses an extended form of spatial hypertext to represent information spaces [8]. combinFormation sessions are seeded through one of several mechanisms: a user can pick one of provided collections, enter search queries, or input site URLs to launch the system. Then, the system processes the specified documents, and extracts and collects text and image elements, as well as hyperlinks. Processed elements are added to pools of candidate elements. In order to assign weights to the significance of individual elements, as well as their relatedness, the system models the information elements through two
3.1 Placement Algorithm The regular operating mode of the software agent is to iteratively generate information elements for placement in the generative spatial hypertext. One element is added to the information space in each step. The steps are iterated approximately 1 second apart, though the user can change the rate or pause the process [11]. The generative system must decide where to place each new element. Through this series of decisions, the layout emerges.
86
container’s metadata. There can also be element specific metadata such as a caption for images, which is derived during source document processing from the alt attribute of the HTML img element. In order to gather more metadata, we also mine terms from the source document and image URL. This is accomplished by breaking the URL on separators such as slash, underscore, period, and case change. Terms extracted in this manner are only used if they are found in the global dictionary of all terms encountered during the session union those in the pre-built dictionary described above in Section 3.
To support the operation of the placement algorithm, the visual workspace in combinFormation is divided into a matrix of rectangle regions (interchangeably referred to as cells in this document). Each cell is aware of the information elements that substantially overlap with the cell’s region (see figure 2). A weight is assigned to the cell, which is simply the weight of the element overlapping the cell that is currently on top. The size of the new element can be expressed in terms of grid cells. Based on this size, we can establish a set of candidate locations in which to perhaps place the new element. With each such location is associated a region of grid cells, known as the candidate region. A weight is assigned to each candidate region by simply integrating, or adding, the weights of its constituent grid cells. From these calculations, we derive a set of candidate positions for placement, and associated grid region candidate weights. The new element is placed at the location of the minimum weight, so that it covers the region of least importance.
3.3.2 Composite TermVector Each text and image element has its own TermVector. We call it the composite TermVector because it is the union of all terms from the element itself and every metadata field from the element. The quality of the metadata, and the resulting composite TermVector plays a crucial role in the subsequent operation of the semantic clustering algorithm.
At the end of this process, the elements in the space are sorted, based on their weights. They are then restacked, so that the most important elements are on top. If the system considers the space to be full, based on a preset threshold of element density, the least important element will also be removed from the information space as part of this process.
3.3.3 Interest expression and age The user can express interest in any element in the spatial hypertext by selecting and clicking. In this way, each information element serves as an affordance that elicits relevance feedback [20] from the user. The basic idea of the relevance feedback algorithm is to extract expansion terms from the top-ranked documents to formulate a new query for a second round retrieval. Instead of using the top-ranked documents, combinFormation extracts terms from the composite TermVector of information elements, in which a user expresses interest. Terms from elements in which positive interest has been expressed are added into the feedback terms with positive magnitude to attract similarity, and terms from elements with negative interest repel elements with similar terms. Using this term-based feedback, combinFormation chooses the next element to be displayed.
3.2 Directing the Agent: Latch and Cool Space A number of interactive affordances have been developed to support the user in directing the operation of the agent. Two of these are the latch, and the cool space. The latch tool [10] is a mechanism that was previously designed to afford non-linear history traversal in combinFormation. Information elements that are latched by the user will not be covered or removed from the information space by the system. The latch can also be used with the history playback system to override previous operations [10].
4. SEMANTIC CLUSTERING: RELATEDNESS POTENTIAL
The cool space [14] is the inner square area shown in figure 1. This space is reserved for spatial hypertext design by the human, only. The outer area is the mixed-initiative hot space. As it engages in generating the spatial hypertext document, the system adds elements here; as the space fills, it will also remove the least important elements from this region of space.
In this section, the placement scheme is described that enables the generative evolution of visual clusters of related and similar information elements in the information space. The prior placement algorithm (see Section 3.1) has the beneficial property of covering up the elements of least importance. However, the problem is that it did nothing to spatialize semantic relationships, so that related elements were not placed in proximity. The new clustering algorithm organizes semantic relationships among the elements in the space. Often this will appear in the result as a perceptible sense of visual clustering, even though explicit clustering semantics are not employed.
3.3 Feature Extraction In order to operate, the new semantic clustering algorithm needs features that are associated with each information element. These features are extracted during the spatial hypertext document generation process. Those features are listed in Table 1. Here we describe the underlying process which enables feature acquisition.
Our generative spatial hypertext is characterized by the periodic introduction of new elements into the information space. Each time a new element is added to the space, a measure named relatedness potential is associated with each cellular region of the visual workspace. This measure describes how related the information elements already present in this cellular region are to the new element.
3.3.1 Container and Metadata A container object is created for each source document. When the system processes the document, the container gathers all the information about the document. This includes metadata, such as its mime-type, domain information, title, and description. The container also keeps track of in-links and out-links, which are used to operate and maintain the model. Principally, it maintains the collections of text and image elements from the document. Likewise, each text and image element maintains a reference to its container. Thus, each of these elements can be associated with its
4.1 Feature Set In order to measure relatedness, for each visual element placed on the combinFormation workspace a feature set of parameters is
87
Table 1. Descriptions, weights, similarity metrics for each dimension of the feature vector. Information Field
Information Element α
Information Element β
Weight
Similarity
Media Type
MediaTypeα
MediaType β
WeightMediaType
SimilarityMediaType = { 1 if same, 0 otherwise }
Domain
Hrefα
Href β
WeightDomain
SimilarityDomain = { 1 if same, 0 otherwise }
Container Document Type
MIMEα
MIME β
WeightContainerDocumentType
SimilarityContainerDocumentType =
Composite Term Vector
TermVectorα
Age
Ageα
Age β
WeightAge
SimilarityAge = | Ageα - Age β |
Interest Expression
Interestα
Interest β
WeightInterest
SimilarityInterest= Difference in # of positive clicks OR difference in # of negative clicks or difference in # of neutral clicks; 0 otherwise
{ 1 if same, 0 otherwise } TermVector β
WeightCompositeTermVector
SimilarityCompositeTermVector = Total sharpness1 of common terms between TermVectorα and TermVector β
1
sharpness of the term :
sharpnessterm = log
N / log N nterm
computed as a weighted summation of the similarity across each dimension in a feature space. Let F be the feature set.
defined. The potential value computed for each cell is derived with contribution from each of these features. The user is able to define the relative weighting of the features (See section 4.3). Currently, the feature set includes:
PairSimila rity λ ,γ =
∑ Weight
i
× Similarity i
(1)
i∈F
• Media Type: Image Element or Text Element
Each cell in the visual workspace has a list of the information elements that visually overlap with the cell’s region. We compute the relatedness potential for each cell α in relation to the new information element λ to be placed in the space, by iterating over each element γ already in the information space and overlapping cell α:
• Composite Term Vector: The vector of stemmed terms obtained from the content of a text information element, the caption from image elements, title and description information obtained from the container document, and metadata obtained explicitly from semantic web and digital library sources. • Domain: The internet domain of the source URL that the information elements are from.
CellActivationPotentialα =
∑ PairSimilarityλ γ (2) ,
γ ∈α
• Document Type: the MIME type of the document that this information element was parsed from.
The relatedness potential is a measure of how attractive this cell is for the next information element to be placed, based purely on the existing set of information elements that overlap with this cell’s region. The relatedness potential is computed for every cell in the visual workspace. The set of these potential measures across the set of cells constitutes a low-resolution potential vector field. Selecting the cell with maximum relatedness potential would place the new information element on this cell. However, by simply selecting the cell with maximal potential, the result will be a layout in which similar information elements are made to overlap and obscure each other. Instead, we develop the clustering algorithm so that it will position the similar information element adjacent to the most attractive cell, inasmuch as this is possible, rather than piling related elements on top of each other. That is, empty cells neighboring the maximally related cells should have greater relatedness potential for the new information element.
• Age: How long the information element has been in the spatial hypertext document, while the generative process is running. • Interest Expressed: Number of times the user has clicked (or dragged) the information element with positive, negative or neutral interest.
4.2 Computing Relatedness Potential At the root of the relatedness potential positioning algorithm is the pairwise comparison of information elements. We need to find the set of cells in the space with the maximum relatedness potential in relationship to a new element being placed into the space by the generative agent. The similarity computation between feature points of two information elements λ and γ for each information field is described in table 1. A weight is associated with the contribution of each feature as a scaling factor. The total similarity between element λ and γ is therefore
Additionally, we treat the center and peripherae differently. One reason for this is in order to disperse the positions of emerging clusters, so that they form in relatively distinct areas across the
88
The aggregate potential for each cell is computed as the summation of the potential of all the cells covered by placing the upper left hand corner of the new information element in the cell under consideration. Thus, aggregate potential is computed for all candidate upper left hand corner positions for the new element. In case there is a tie, the final cell selected in randomly picked from the set of cells having the maximum aggregate potential. An example of a system generated visually clustered document is shown in figure 4.
space. Another reason, for visual design purposes, is to reduce the amount of clutter in the center, so that the eye can rest there more easily. Thus, we make cells that are of greater distance from the center of the visual space be more attractive. New information elements that have no similarity with information elements already in the space should be pushed away from these similarity clusters. This is accomplished with the factor Distαcenter in Eq. 3. In order to incorporate our design goals into the clustering algorithm, a spreading activation [22] scheme is used. The relatedness potential of each cell α is spread to neighboring cells within a specified spread radius. In order to promote the use of empty space, and reduce the depth of piling, empty neighboring cells receive a raised activation, whereas non-empty neighboring cells receive a damped activation. The overall relatedness measure of each cell towards the next information element will be called to calculate the potential. The spreading activation schema is described by the equations below:
4.3 Side-effects of order The relatedness potential algorithm is strongly influenced by the order in which elements are added to the spatial hypertext. The early distribution of elements across the mostly empty space has strong side effects on where clusters can form. A new element is placed based on the existing elements. If the stream of previous elements is all unrelated, those elements would cover each other, so a new element might not placed together with its related elements. If the existing elements are all somewhat related, but based on a feature that turns out not to be of essential importance, the system would place them together those elements in a certain area without making a cluster layout based on more refined semantic basis.
When the cell α is empty, the greater distance from the center distance of the visual space will have a bigger relatedness potential, Pα,t+1. Assume that Pα,t is the previous relatedness potential and Pα,t+1 is the updated relatedness potential.
Pα , t +1 = Pα , t +
Distα , center × DistWeight MaxDist
(3)
5. INTERACTIVE MECHANISMS The primary benefit of the relatedness potential algorithm for semantic clustering is the ability to dynamically respond to newly available information, and evolving user needs. Thus, we are developing a vocabulary of interactive mechanisms that enable the user to spontaneously affect how the algorithm operates. As mentioned above (Section 3.3.3), the interest expression interface enables the user to provide relevance feedback about particular features values, Other interactive mechanisms include the latch and re-cluster, which enables re-definition of cluster centers, and the pie-menu, which enables shifting the weights of features.
When the cell α has a positive relatedness potential and the neighboring cell β is empty, the greater distance between the cells α and β (within a defined spread activation radius) and the smaller the number of overlapped elements across the cells α and β (oEα,β), the higher raised activation the cell β will get. The raising factor is a constant value, which is used to raise the relatedness potential of neighboring cells (rF). Distα , β
Pβ ,t +1 = Pβ ,t + {(1 + rF ) − rF
oEα , β
} × Pα ,t
(4)
5.1 Latching and the Re-cluster Operation
When the cell α has a positive relatedness potential and the neighboring cell β is not empty, we define the relatedness potential for β such that the greater the distance between cells α and β (within a defined spread activation radius) and the smaller the number of overlapping elements in cells α and β, the less damped activation the cell β will receive. The damping factor is a constant value, which is used to damp the relatedness potential of neighboring cells (dF).
The clustering algorithm described above does not leave any footprint or trail of what elements existed in any region of the visual space at any time. That is, every time a new element needs to be placed on screen, the clustering algorithm re-computes the aggregate potential of each cell on the cellular matrix. If a user reorganizes the information elements on the workspace, the clustering algorithm is automatically adapted to the new
Distα , β
Pβ ,t +1 = Pβ ,t + {dF
oEα , β
} × Pα ,t
(5)
When the cell α has a negative or zero relatedness potential, the relatedness potential of the neighboring cell β will be decreased by the number of elements in the cell α (nOα) and the overlapping degree with the cell α. The greater the distance between the cell α and β (within a defined spread activation radius), the smaller the decrease in relatedness potential for the cell β.
Pβ ,t +1 = Pβ ,t −
nOα × oEα ,i Dist α , β
× Pβ ,t
(6)
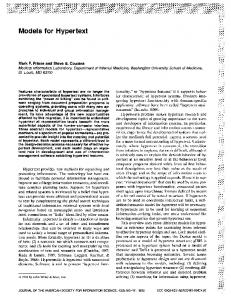
Figure 3. Pie Chart Slider for Manipulating Weights 89
user with influence over the relative importance of features utilized by the relatedness potential semantic clustering algorithm. This mechanism makes the weighting coefficients of contribution of each feature accessible through a visual pie chart. A pie chart is a commonly used visual representation of quantitative information by means of a circle divided into sectors where the relative areas of the sectors correspond to the relative sizes or proportion of the different quantities. The primary benefit of this slider is that it affords manipulation of the relative magnitudes of the coefficients, while constraining them to always sum to 100%. The pie chart seemed to be an intuitive interface metaphor for representing and manipulating quantities in relative proportion (see figure 3).
arrangement. There are many cases in which a user might want to rearrange information elements in order to express certain relationships between elements, because his/her goal is to understand, collect and organize information elements, not just to see what system generates for him/her. In the current research, we use the latching mechanism to provide the basis for a user-directed re-clustering operation. The user essentially chooses cluster anchors by latching. S/he can distribute these key elements across the space, so as to guide the subsequent utilization of spatial regions and the formation of clusters. The re-clustering operation removes all unlatched information elements from the screen. Then re-adds them iteratively, while computing relatedness potential for each. The re-cluster operation clusters similar elements around the anchor elements that have been latched by the user. This method can be used to reorganize existing non-clustered documents generated by combinFormation or to re-clustering existing clustered documents to improve the definition of clustering semantics so they are more compatible with the goals of the user’s task at hand.. A reclustered layout generated from an existing non-clustered document is shown in figure 5.
We implemented the weight manipulator as a pie chart, where the dividers between the sectors in the chart are rotate-able. The colors and the sectors are mapped to appropriate feature weights, and these are made visible in a legend, which is available to the user by right clicking on the pie chart. The dividers between the sectors can be rotated in the clockwise or anti-clockwise direction by dragging the mouse appropriately. The changes in the areas of the sectors affected by the rotation are propagated to their corresponding feature weights, and these new weights are used in the placement of the next information element by the clustering algorithm (see Figure 3).
5.2 Pie Chart Slider Two methods through which the combinFormation user can dynamically affect the spatial organization of the information elements in the system are by moving information elements around in the visual workspace using the grab tool [14], or by using the re-cluster operation explained in the section 4.2.
6. EVALUATION The experiment was designed and executed to evaluate a preliminary version of the system-generated documents with the new clustering algorithm. The user tasks compared the experience of working with the generative spatial hypertext with and without
Additionally, we have developed a mechanism for providing the
Figure 4. Semantically Clustered Spatial Hypertext generated by combinFormation with news seeds. The boxes delimiting semantically clustered regions and the associated labels were added afterwards by hand.
90
of news sources, including CNN, The Guardian, The New York Times, the BBC, and ABC, for this evaluation.
generative semantic clustering. The questionnaires and discussions in this experiment were not only about these particular experiences with spatial hypertext and clustering documents generated by combinFormation; they also addressed participants’ experiences with other documents and tools for collecting and organizing information.
When the information space seemed full, the second step began. The subject was asked, “to read the news.” Without being directly prompted, subjects voluntarily engaged in a process of active reading [24]. During the course of “reading,” they used the interactive affordances to re-arrange elements, remove elements, express interest in elements, and continue generation. The experimenter remained available to answer participants questions about how to operate the system. This step ended when the participant indicated that they had finished reading the news, which took 5-10 minutes. These generated and somewhat edited spatial hypertext documents were saved in XML, and used later in the evaluation. After this, a similar process was conducted with the other generative condition, either non-clustered, or clustered, in alternation within subjects with the one used the first time. At this point, participants answered a questionnaire comparing the experience of working with the clustered and non-clustered generative spatial hypertext conditions.
6.1 Method and Procedure Nine students from Texas A&M University were recruited to participate in this evaluation. All participants were proficient in English. Their ages ranged from 20-30 years old. The experimental goal was to evaluate generative semantic clustering of information elements in spatial hypertext documents. The evaluation has two parts; one is for participants to compare clustered and non-clustered documents, and the other is for participants to experience the re-cluster operation. It took 30-60 minutes for each participant to complete this evaluation. The process began with a pre-questionnaire. For the first part of the evaluation, two types of spatial hypertext documents were generated by combinFormation: clustered and non-clustered. In the first step of the first part, each participant watched as combinFormation generated either a clustered or nonclustered spatial hypertext document. The order of this condition was alternated between subjects. While the generation process was occurring, the experimenter explained to the participant about the various interactive tools and other affordances available for editing and authoring in combinFormation. However, none of these mechanisms were used during this time period.
The second part of evaluation used the documents generated in the previous evaluation. Using combinFormation, saved XML documents were opened. Participants were asked to engage in partial re-arrangement of key elements in meaningful ways that could form the basis of semantic clusters across the information space, and to use the latch tool to fix the locations of these key elements. After doing this, they used the re-cluster operation to automatically reorganize the rest of the elements. Some subjects experimented iteratively with different provisional configurations, before settling on the layout they wanted. The process was repeated with both the non-clustered and clustered documents saved in the first part of the experiment. Finally, the participants answered a post-questionnaire.
The content for the generated spatial hypertext was chosen to be of general interest to the participants. According to the Pew Internet and American Life data, around 70% of internet users’ activities involve getting news [17]. Thus, we chose a collection
Figure 5. A document generated after a re-cluster operation with the non-clustered document in Figure 1. The boxes delimiting semantically clustered regions and the associated labels were added afterwards by hand.
91
they engage in on-the-fly provisional acts of direct manipulation reorganization and latching of a few most significant elements. Users prefer documents generated with semantic clustering by relatedness potential, because they sense that this reduces the effort they need to spend to organize related information in spatial hypertext. This method can be used to separate out different or unrelated information from a single document, or to cluster related or similar information elements from multiple documents. It could also be used, for example, to translate an unorganized collection of bookmarks into semantically clustered spatial hypertext. The preliminary evaluation results show that most of participants prefer the clustered document and they said that a clustered document is easier to organize and more helpful to understand than a non-clustered document.
6.2 Results The pre-questionnaire asked participants how they usually organize information when collecting information in a document. Eight out of nine subjects answered that they put semantically related information together (significance measured by a paired ttest, F(1,8)=-3.5, p