TAO, Vol. 16, No. 4, 805-841, October 2005
Geochemical Characterization and Temporal Changes in Parietal Gas Emissions at Mt. Etna (Italy) During the Period July 2000 - July 2003 1,
Giovannella Pecoraino
* and Salvatore Giammanco1
(Manuscript received 4 October 2004, in final form 20 July 2005)
ABSTRACT Several types of natural gas emissions (soil gas, low temperature fumaroles, gas bubbling in mud pools) were collected monthly on Mt. Etna volcano between July 2000 and July 2003 both from its summit and its flanks. Samples were analysed for the determination of the concentrations of CO 2 , CH 4, He, H 2 , CO as well as the isotopic ratios of 13 C/ 14 C of CO 2 ( δ 13 C ) and He (R/Ra). The analysed gases were chemically divided into two groups: air-contaminated (from sites closer to the summit vents of Mt. Etna) and CO 2 - rich. Among the latter, samples from the lower SW flank of the volcano showed high contents of biogenic thermogenic and/or microbial 13 CH 4 . Isotopic shift in the δ C values is caused by input of organic CO 2 and/or by interaction between magmatic CO 2 and shallow ground water as a function of water temperature and CO 2 flux from depth. Based on a graphic method applied to δ 13 C TDIC of some ground water, the inferred isotopic composition of the pristine magmatic gas at Mt. Etna is characterised by δ 13 C values ranging from -2 to -1 0 00 . During the period July 2000 - July 2003 significant variations were observed in many of the investigated parameters almost at all monitored sites. Seasonal influences were generally found to be negligible, with only a limited effect of air temperature changes on soil CO 2 and ground temperature in only two of the air-contaminated sites. The largest chemical anomalies were observed in the air-contaminated sites, probably because of the strong buffering power of local ground water on gases released through the most peripheral areas where the CO 2 -rich sites are located. The anomalous changes observed during the study period can be explained in terms of
1
Istituto Nazionale di Geofisica e Vulcanologia - Sezione di Palermo, Palermo, Italy
* Corresponding author address: Dr. Giovannella Pecoraino, Istituto Nazionale di Geofisica e Vulcanologia - Sezione di Palermo, Via Ugo La Malfa 153, Palermo, Italy; E-mail:
[email protected]
805
806
TAO, Vol. 16, No. 4, October 2005 progressive gas release from separate batches of magma that ascend towards the surface in a step-wise manner. Data relevant to the period following the 2002-03 eruption suggest that magma kept accumulating beneath the volcano, thus increasing the probability of a new large eruption at Mt. Etna. (Key words: Mt. Etna, Geochemistry, Gases, Eruptive activity)
1. INTRODUCTION 2
Mount Etna is the largest volcano in Europe (~1200 km of total surface with a maximum height of ~ 3300 m above sea level) and is one of the most active in the world. A prominent feature of Etna’s activity is the persistent emission of a huge volcanic plume arising from its four summit craters (“Voragine”, “Bocca Nuova”, South-east and North-east, see Fig. 1) both during quiescent and eruptive magma degassing. Other types of gas manifestations (mofettes, “mud volcanoes”, diffuse soil degassing, bubbling gases in surface and ground water) also occur in peripheral sectors of the volcano. Many studies in the last years have focused particularly on soil degassing (Aubert and Baubron 1988; Allard et al. 1991; D'Alessandro et al. 1992, 1997a; Anzà et al. 1993; Giammanco et al. 1995, 1997, 1998a, b, 1999; Parello et al. 1995; Baubron 1996; Bruno et al. 2001; Caracausi et al. 2003a, b). Anomalous soil gas emissions in the Etna area occur mostly, if not exclusively, along active tectonic structures. Carbon dioxide ( CO 2 ) is generally the most abundant species emitted, but several other gases (methane, helium, hydrogen, carbon monoxide, radon) can be found as well, with concentrations well above those in the air. The origin of CO 2 is magmatic, with a very small contribution from biogenic and/or organic sources. The temporal variations in the concentrations of some of these soil gases, and in particular in the efflux of CO 2 , have shown significant correlations with variations in volcanic activity. In this paper we present original data on the temporal evolution of the chemical and isotopic characteristics of gases collected simultaneously from low-temperature (T < 100°C) fumaroles, soil emissions, mofettes and mud volcanoes in and around the Mt. Etna area. Data were collected during the period July 2000 - June 2003. The results were compared to the temporal evolution of Etna’s volcanic activity in a period of particularly strong eruptive events.
2. FIELD OBSERVATIONS, SAMPLING AND ANALYTICAL METHODS Gas samples were collected from July 2000 to June 2003 in six sites in the Mt. Etna area (Fig. 1). The sampling frequency varied from once a month to twice a week, depending on the state of volcanic activity. RNE, TDF and BLV are fumarole emissions located close to the summit of the volcano (altitude > 2000 m a.s.l.) (Fig. 1); they are characterised by emissions of water vapour with outlet temperature generally lower than 100°C (RNE and BLV) or by diffuse soil gas anomalies accompanied by a weak thermal anomaly in the ground (TDF). In
Giovannella Pecoraino & Salvatore Giammanco
807
Fig. 1. Location of sampled gas emissions in the Etna area (solid diamonds). Altitudes in metres. particular, RNE is located along the so-called NE rift. This volcano-tectonic feature consists of a group of eruptive fissures, radial in respect to Etna’s summit, located on the upper northeastern slope of the volcano, between 2500 and 1300 m of altitude. According to Giammanco et al. (1999), fumaroles in this area release magmatic gas through fractures connected with the main feeding conduit of the volcano. TDF is located near the summit craters (altitude of 2750 m a.s.l.), some metres south of the Torre del Filosofo hut (now buried by the tephra emitted during the 2002 eruption). It is connected to an active N-S-trending volcano-tectonic structure that belongs to the so-called SE Rift, and is probably related to the main feeding conduits of the volcano (Giammanco et al. 1998a). The site of BLV is also located along the SE Rift, at altitude of 2720 m a.s.l., but along a different fracture than that feeding TDF gas emissions. The BLV fumarolic field formed during the 1991-93 eruption where the 1991-93 eruptive fissure crossed the edge of the Valle del Bove morphological depression (Fig. 1). Site P78 is
808
TAO, Vol. 16, No. 4, October 2005
located on the lower eastern flank of the volcanic edifice about 3 km east of the village of Zafferana Etnea, at an altitude of about 320 m a.s.l. It is characterised by anomalous emissions of soil gases along an inferred fault directed about WNW-ESE. Furthermore, in this site both CO 2 efflux and CO 2 concentration showed a high variability in relation with volcanic activity (Giammanco et al. 1998a). Based on the temporal variation of combined soil CO 2 degassing and crater plume SO 2 flux (Bruno et al. 2001), anomalous soil degassing at site P78 originates from magma stored in a relatively shallow level (5 - 10 km deep) of the magma column inside the main feeding conduits of Etna. Site P39 is located on the lower southwestern flank about 2 km southwest of the town of Paternò (altitude of about 115 m a.s.l) and approximately 20 km SSW of Etna’s summit craters. It is a mofette characterised by huge emissions of CO 2 and CH 4 from the ground (Giammanco et al. 1998a). According to Bruno et al. (2001), soil gases at P39 are inferred to leak from a deep magma reservoir. Site VS is also located on the southwestern foot of Etna, just a few kilometres east of site P39. It is part of a large mud volcano (Vallone Salato, which is one of the three mud volcanoes locally known as “Salinelle”, because they emit not only gas and mud, but also highly saline waters) that occupies an area of some hundred square metres. Lastly, site Naftia is a mofette that is today exploited for the production of industrial CO 2 (Mofeta dei Palici plant, CO 2 output estimated as about 200 tons/day, R. Romano pers. comm.) and is located about 40 km SW of Mt. Etna near the city of Palagonia. The last 3 sites are close to a major NE-SW fault system that probably runs across eastern Sicily and passes through Etna (Bosquet et al. 1988; Gurrieri et al. 1998). This fault system would also correspond to one of the main directions of magma rise beneath Etna (Rasa et al. 1995). The collected gas samples were analysed in the lab for the determination of CO 2 , He, H 2 , O 2 , N 2 , CH 4 and CO concentrations, together with the isotopic ratios of carbon (δ 13 C ) and oxygen ( δ 18 O ) of CO 2 and He (R/Ra). Samples of fumarole and soil gases were collected at a depth of 50 cm through steel tubes connected to a syringe and were then stored into glass flasks equipped with vacuum stopcocks. Upon collection, samples for carbon isotopes analyses were first passed through a tube containing lead acetate in order to eliminate H 2S and water vapour. Chemical analyses were done by using a Perkin Elmer 8500 gas chromatograph with argon as carrier gas and equipped with a 4 m Carbosieve S II column. In order to evaluate the concentration of He, H 2 , O 2 , N 2 and CO 2 a TCD detector was used, while CH 4 and CO concentrations were determined using a FID detector coupled with a methanizer. The detection limits were about 6 ppm vol. for He, 2 ppm vol. for H 2, 1 ppm vol. for CO, 2 ppm vol. for CH 4 0.05% vol. for O 2 and 0.1% vol. for N 2 . Analyses of carbon and oxygen isotopes of CO 2 were carried out by using a Finnigan Delta plus mass spectrometer. Values of carbon isotope of CO 2 are expressed in δ 0 00 vs. PBD, accuracy being 0.1 δ 0 00 . Values of oxygen isotopes of CO 2 are expressed in δ 0 00 vs V-SMOW, accuracy being 0.2 δ 0 00 . The 3 He/ 4 He ratios were measured by a double collector VG Masstorr FX (error ± 1%) and the 4 He/ 20 Ne ratio by a quadruple mass spectrometer VG Masstorr FX (accuracy ± 5%). Soil CO 2 emissions were determined using the “dynamic concentration” method of Gurrieri and Valenza (1988), also described in Giammanco et al. (1995). The analytical results for all the collected gas samples are shown in Table 1.
Giovannella Pecoraino & Salvatore Giammanco Table. 1. Chemical and isotopic composition of the sampled points. Analytical data are expressed as %vol ( CO 2 , N 2 , O 2 ) and ppmvol (He, H 2, CO, CH 4 ), dynamic concentration of CO 2 as ppmvol.
809
810
TAO, Vol. 16, No. 4, October 2005 Table. 1. Continued.
Giovannella Pecoraino & Salvatore Giammanco Table. 1. Continued.
811
812
TAO, Vol. 16, No. 4, October 2005 Table. 1. Continued.
Pecoraino & Giammanco Table. 1. Continued.
813
814
TAO, Vol. 16, No. 4, October 2005 Table. 1. Continued.
Giovannella Pecoraino & Salvatore Giammanco Table. 1. Continued.
815
816
TAO, Vol. 16, No. 4, October 2005 Table. 1. Continued.
Giovannella Pecoraino & Salvatore Giammanco Table. 1. Continued.
817
818
TAO, Vol. 16, No. 4, October 2005 Table. 1. Continued.
Giovannella Pecoraino & Salvatore Giammanco
819
3. ETNA PLUMBING SYSTEM 3.1 Deep Magma Reservoir Several lines of evidence indicate that Mt. Etna’s plumbing system is quite complex. Geophysical, petrological and geochemical evidences strongly support the existence of a large and deep magma reservoir beneath Mt. Etna. These include the distribution of hypocentral depths of volcanic earthquakes (Cardaci et al. 1993), the detection of an upwarped lower-crust boundary beneath the volcano from seismic refraction studies (Hirn et al. 1997), large-scale ground deformation of the volcanic pile associated with recent large eruptions (Bonaccorso et al. 1994; Bonaccorso 1996), 226 Re-230 Th radioactive disequilibria studies (Condomines et al. 1995), and overall chemical composition of recently erupted lavas (Tanguy et al. 1997). The width of this reservoir was estimated by Sharp et al. (1980) to be in the range of 20 to 30 km. More recently, Caracausi et al. (2003a) indicated a minimum width of 60 km for this reservoir. The depth of this reservoir was estimated at about 20 km below sea level (Hirn et al. 1997) and its nature was identified by Allard (1997), D’Alessandro et al. (1997b) and Caracausi et al. (2003a) as an up-warped asthenosphere where large convective movements of molten material take place. This assumption was based on the large imbalance between volumes of erupted lava and volumes of non-eruptive degassing magma inferred from the budget of volcanic gas emitted from Mt. Etna (the latter is about 10 times higher than the former). Gvirtzman and Nur (1999) related the asthenospheric upwelling underneath Mt. Etna to slab rollback in the south Tyrrhenian subduction zone. 3.2 Shallow Magma Reservoirs Shallow magma reservoirs were also identified beneath Mt. Etna mainly on the basis of ground deformation (Bonaccorso et al. 1994; Bonaccorso 1996) and seismic data (Murru et al. 1999; Patanè et al. 2003). In particular, Murru et al. (1999) found evidence of at least two magma reservoirs. One has a radius less than 2 km and is located WSW of the summit at about 3 ± 2 km b.s.l.; the other has a radius less than 5 km and is located 2 km E of the summit at about 10 ± 3 km b.s.l.. According to Murray (1990), such shallow reservoirs are temporary and are occupied by magma only during the relatively short periods (a few days to a few years) that precede eruptions. However, it cannot be excluded that some degassed magma can occupy those shallow reservoirs for longer times and is periodically replaced by fresh, gas-rich magma, hence producing small-scale convective overturn of magma within the upper feeding system of the volcano, as already suggested by Allard (1997) and Bruno et al. (1999). According to these authors, degassed magma would tend to sink down into the magma column due to its increased density and would be in part recycled and in part stored into intrusive bodies at depth within the crust.
4. VOLCANIC ACTIVITY DURING THE PERIOD JULY 2000 - JULY 2003 During the period of the present study volcanic activity at Mt. Etna was remarkable, par-
820
TAO, Vol. 16, No. 4, October 2005
ticularly at the South-east crater (henceforth indicated with SEC), varying from strong strombolian explosions to violent lava fountaining to eventually a lateral eruption. The first eruptive episodes occurred at the SEC on August 28 and 29, 2000. Both were paroxysmal episodes, consisting of violent lava fountaining from the SEC’s main vent or from secondary vents that opened along fissures at the crater’s foot. This explosive activity was accompanied by emission of fluid lava flows. At the end of November the SEC re-activated with about ten days of weak summit strombolian activity. Then, for about two weeks a slow and viscous lava flow was gently emitted from its northeastern slope and produced a small lava flow field. Afterwards, eruptive activity resumed at SEC on January 20, 2001. Lava was discontinuously effused until July 2001, often accompanied by strombolian explosions or lava 3 −1 fountaining, with an output rate ranging from 1 to 10 m s . In particular, a new short cycle of strong paroxysmal events started on June 7, 2001. The intensity of such episodes was ever increasing with emission of well-fed lava flows from the NE foot of the cone. Simultaneously, strong strombolian activity, often evolving to short-lived lava fountaining, took place at the top of the cone. This cycle ended on July 17 after 15 eruptive episodes, followed right after by the complex sub-terminal and lateral July-August 2001 eruption. During the period preceding the July-August 2001 eruption, a progressive increase in strombolian activity at the Bocca Nuova was observed. Periodic explosions occurred mainly during the period September-October 2000 and more evidently in February-March 2001, when bursts of lava increased both in frequency and intensity. At the end of February 2001 weak explosive activity resumed at North-East Crater, too. Conversely, the Voragine showed only quiet degassing activity throughout the whole period. After a strong seismic swarm on July 12, between July 13 and July 20 a 7 km-long system of dry fractures formed on the upper southern flank of Mt. Etna, starting from the southern side of the SEC at about 2900 m a.s.l., mainly oriented N-S. This fissure developed further south down to 2700 m of altitude. A few days later, another fissure formed on the uppermost NE flank of the volcano, again starting from the SEC. Lava was erupted from several points along the two fissures. The main lava flows were emitted from the lower southern fissure, and flowed down to an altitude of 1040 m a.s.l.. The eruption ended on August 9, 2001, after emitting a 3 volume of lava estimated between 30 (Behncke and Neri 2003) and 48 million m (INGV-CT 2001). The 2001 eruption was followed by periodic ash emission and weak to strong strombolian activity at North-east crater and Bocca Nuova. Between the 26 and the 27 of October 2002 a new flank eruption started both along the North-east Rift (where the eruptive activity stopped on November 5) and on the upper southern flank of the volcano. Here the eruption was more intense and lasted for three months. It formed two large cones at about 2750 - 2800 m a.s.l. and a highly composed lava flow field. A 2 - 3 km-high sustained eruptive column produced an abundant ash and tephra fallout for most of the first two months of eruption, then the explosive and effusive activity gradually decreased and on January 28, 2003 the eruption ended.
Giovannella Pecoraino & Salvatore Giammanco
821
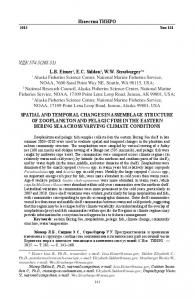
5. CHEMICAL CHARACTERIZATION OF ETNA’S SOIL AND FUMAROLE GASES Carbon dioxide is the major constituent of gas samples from the low altitude sites (Naftìa, VS and P39), followed by CH 4 and He, CO and H 2 . Conversely, all other samples show remarkable air pollution, as evidenced by the high amounts of O 2 and N 2 , followed by CO 2 and by variable concentrations of CO, CH 4 , H 2 and He. This feature is due to the combined effect of high soil permeability and relatively low, although anomalous, gas flux through the ground. Among the air-contaminated sites, that of BLV deserves a particular attention, because the fumaroles there present are characterised by the highest temperature (84.8 to 105.0°C), the highest concentration of CO 2 and He values slightly exceeding that of air (5.4 ppmv). According to Giammanco et al. (1998a, and literature therein cited), the high concentrations of CH 4 and He in the gas samples from sites P39, VS and Naftìa (Fig. 2) would result from CO 2 depletion in the gas phase after interaction between deep CO 2 -rich gases and shallow CO 2 unsaturated groundwaters. This phenomenon causes He enrichment in the residual gas phase and its intensity is a function of both the pH of water and the flux of incoming CO 2 that interacts with the aquifer. Methane enrichment relative to CO 2 is particularly evident in the samples from site P39 and even more so in those from VS (Fig. 2). This can be in part explained by interactions between magmatic gas and CO 2 -unsaturated groundwater similar to −1 those inferred for the He enrichment, because CH 4 has a solubility coefficient (18 ml l ) −1 −1 much lower than that of CO 2 (759 ml l ) and close to that of He (8.75 ml l ) (Capasso and Inguaggiato 1998). In addition to this, interactions between magmatic gas and relatively shallow hydrocarbon reservoirs can also be invoked, as deduced by Parello et al. (1995) and Giammanco et al. (1998a) and confirmed by the isotopic composition of carbon and deuterium of CH 4 (Grassa et al. 2004).
6. He AND C(CO 2 ) ISOTOPES OF ETNA’S GASES 6.1 Isotopic Markers of C and He of Etna’s Magma In recent years, many studies were aimed at assessing the pristine isotopic composition of helium and carbon of CO 2 in Etna’s magma. The reason for this lies in the differences between Etna’s values and those typical of MORBs. According to the classic interpretations (e.g., Taylor et al. 1967; Deines 1970; Allard 1983, 1986), MORB values of δ13C(CO 2 ) range from -8 to -5% and those of He are 8 ± 1 Ra. R/Ra values in inferred Etna’s magmatic endmember (< 8 Ra) are always lower than MORB ones. Inferred magmatic values of δ13C(CO 2 ) at Etna are always remarkably more positive than MORB ones, as they reach values as high as -1 0 00 . Such isotopic characteristics have been generally explained in terms of strong crustal contamination of a MORB-type source (Allard 1983; Allard et al. 1997; Tedesco 1997). However, according to other studies (Marty et al. 1994; D’Alessandro et al. 1997b; Nakai et al. 1997; Giammanco et al. 1998a) the observed δ13C(CO 2 ) values would be peculiar of the mantle source of gas beneath Mt. Etna, thus making this source significantly different from MORBs. In particular, Nakai et al. (1997) investigated the isotopic features of noble gases
822
TAO, Vol. 16, No. 4, October 2005
Fig. 2. He - CO 2 - CH 4 triangular plot for the CO 2 -rich samples collected at Mt. Etna. This plot highlights the enrichment both in He and in CH 4 due to interaction between CO 2 -rich gases and local ground waters. For samples from P39 and VS, input of CH 4 from a hydrocarbon reservoir (“hydrocarbon contribution” line in the plot) is also assumed ( P39; VS; Naftìa). derived from the mantle beneath Etna’s magmatic system, showing that the isotopic signature of He in Etna’s magma only partly overlaps the lower range inferred for MORB-type magma (8 ± 1 R/Ra) because of “recent” mixing between a depleted upper mantle (MORB-like source) 4 and fluids enriched in radiogenic He . Furthermore, recent determinations of the 3 He/ 4 He ratio in magmatic gases trapped at depth into olivine crystals from Etna’s basalts (Marty et al. 1994) showed values ranging from 4.9 to 8.2 Ra (mean value of 6.7 ± 0.4 Ra). In the case of carbon isotopes, a major contribution of carbonatic CO 2 from the widespread and thick layers of limestone in the sedimentary basement of Etna was often invoked to explain its atypical δ13C(CO 2 ) values (Allard 1983; Allard et al. 1991; Tedesco 1997). However, according to other recent studies (D’Alessandro et al. 1997b; Giammanco et al. 1998a), there is no significant contribution from CO 2 derived from heated carbonate sediments of Etna’s basement. According to Allard el al. (1997) the carbon isotopic composition of magmatic CO 2 from Etna is about -4 0 00 . Conversely, Giammanco et al. (1998a), on the basis of the temporal correlation between volcanic activity and variations both of δ13C(CO 2 ) and CO 2 fluxes measured in sites of focused degassing, indicated δ13C(CO 2 ) values of deep magmatic gas in the
Pecoraino & Giammanco
823
range -2 to -1 0 00 . Deviations from the mantle values of δ13C(CO 2 ) in gas emissions at the surface were explained as caused by interaction between deep CO 2 and shallow fluids, such as cold and thermal ground water as well as biogenic gases (Giammanco et al. 1998a). In this case, an important role is played by the flux of CO 2 coming from depth (the higher the flux of CO 2 , the lesser the interaction between magmatic CO 2 and the surrounding environment; Giammanco et al. 1998a). A final solution to the question of the pristine magmatic value or carbon isotopes at Etna would come from the analysis of CO 2 trapped into fluid inclusions. Unfortunately, no such data are available, mainly because of the difficulty in finding fluid inclusions into Etna’s volcanics that are suitable for isotopic analyses of carbon. Furthermore, it is highly probable that any CO 2 found in fluid inclusion would be strongly fractionated isotopically because CO 2 has an early exsolution in magma caused by its low solubility in silicate melts (Stolper and Holloway, 1988). In order to find support in favour of either one of the above hypotheses on the isotopic marker of magmatic CO 2 at Etna, we used the graphic method (Fig. 3) proposed by Inguaggiato et al. (2000) applied to δ13C(TDIC) values in groundwater samples from the Paternò area collected in recent years (Allard et al. 1997; D’Alessandro et al. 1997). The δ13C values of TDIC of Etna’s groundwaters measured by Allard et al. (1997) were plotted versus the corresponding values of HCO 3− /TDIC molar ratio. The graph allows to estimate the pristine isotopic composition of C of CO 2 gas that has interacted with the aquifer. The
− HCO 3 /TDIC
Fig. 3. Isotope composition of δ13C(TDIC) vs. HCO 3− /TDIC ratio at values of initial δ13C of CO 2 gas of -1 0 00 and -4 0 00 .
Giovannella Pecoraino & Salvatore Giammanco
823
range -2 to -1 0 00 . Deviations from the mantle values of δ13C(CO 2 ) in gas emissions at the surface were explained as caused by interaction between deep CO 2 and shallow fluids, such as cold and thermal ground water as well as biogenic gases (Giammanco et al. 1998a). In this case, an important role is played by the flux of CO 2 coming from depth (the higher the flux of CO 2 , the lesser the interaction between magmatic CO 2 and the surrounding environment; Giammanco et al. 1998a). A final solution to the question of the pristine magmatic value or carbon isotopes at Etna would come from the analysis of CO 2 trapped into fluid inclusions. Unfortunately, no such data are available, mainly because of the difficulty in finding fluid inclusions into Etna’s volcanics that are suitable for isotopic analyses of carbon. Furthermore, it is highly probable that any CO 2 found in fluid inclusion would be strongly fractionated isotopically because CO 2 has an early exsolution in magma caused by its low solubility in silicate melts (Stolper and Holloway, 1988). In order to find support in favour of either one of the above hypotheses on the isotopic marker of magmatic CO 2 at Etna, we used the graphic method (Fig. 3) proposed by Inguaggiato et al. (2000) applied to δ13C(TDIC) values in groundwater samples from the Paternò area collected in recent years (Allard et al. 1997; D’Alessandro et al. 1997). The δ13C values of TDIC of Etna’s groundwaters measured by Allard et al. (1997) were plotted versus the corresponding values of HCO 3− /TDIC molar ratio. The graph allows to estimate the pristine isotopic composition of C of CO 2 gas that has interacted with the aquifer. The
− HCO 3 /TDIC
Fig. 3. Isotope composition of δ13C(TDIC) vs. HCO 3− /TDIC ratio at values of initial δ13C of CO 2 gas of -1 0 00 and -4 0 00 .
824
TAO, Vol. 16, No. 4, October 2005
curves in the plot represent the theoretical δ13C(TDIC) values calculated as a function both of temperature and of carbon molar ratio in water. Assuming initial magmatic δ13C(CO 2 ) values of -4 0 00 , the resulting data points fall on curves corresponding to equilibration temperatures of about 50°C. On the contrary, assuming a δ13C(CO 2 ) of -1 0 00 almost all of the points fall between the curves corresponding to the equilibrium temperatures of 100°C and 150°C. These temperature values match those deduced by Chiodini et al. (1996) on the basis of geothermometric estimates on gases and waters collected in the same area. Lastly, it is generally accepted that any contribution of He and organic C from the crust to the gases emitted from fumaroles and focused degassing sites in the Etna area is negligible (Allard et al. 1997; D’Alessandro et al. 1997b; Giammanco et al. 1998a). In this work we will therefore consider magmatic values of He of about 6.7 ± 0.4 Ra, and values of δ13C(CO 2 ) in the range -2 to -1 0 00 , in agreement with the hypothesis formulated by Giammanco et al. (1998a). 6.2 Isotopic Composition of Gases During the Period 2000-2003 Isotope analyses on δ13C(CO 2 ) and He in the gases sampled during the period of this study showed values ranging from -22 to +1.6 0 00 and from 1.2 to 7.5 Ra, respectively (Table 1). The variability of both parameters, both among different sites and within the same site, may be a consequence of mixing between deep gas and atmosphere, as in the case of He, and/or isotopic fractionation in the case of carbon, as above described (Fig. 4). Contrary to what stated by Allard et al. (1997), we may rule out isotopic exchange between C of magmatic CO 2 and C of atmospheric CO 2 , because of the lack of correlation (0.017 < R < 0.37) between the measured values of N 2 and those of δ13C(CO 2 ) in the samples most contaminated with air (P78, TDF, BLV and RNE). Samples from sites BLV, TDF and RNE showed δ 13 C values ranging from -4 to -1 0 00 . Because of the absence of vegetation or other organic sources of C, the most negative values at these sites can be related to CO 2 fractionated after partial dissolution of deep gas in the local cold aquifer. In these samples, the He isotope composition ranges from 1.3 to 2.4 Ra and the He/Ne ratio is around 0.4 (A. Rizzo, pers. comm.), which is an indication of marked contamination by atmospheric helium. No correction was made on the R/Ra values from these sites, however, because of the large errors involved in the calculation. 13 Samples from site P78 show the largest variability in δ C values (-21.7 to -2.8 0 00 , Table 1). According to various authors (Parello et al. 1995; Giammanco et al. 1998a), δ13C(CO 2 ) values from P78 are the result of interaction among three different C sources: i) pristine magmatic CO 2 (with carbon isotopic values between -1 and -2 0 00 ); ii) CO 2 derived from biological activity in the soil (with carbon isotopic values between -15 and -25 0 00 ); iii) CO 2 fractionated after partial dissolution of deep gas in the local aquifer at temperature lower than 120°C (because heavier carbon concentrates in the dissolved HCO 3− ions). Giammanco et al. (1998a) observed that when soil CO 2 fluxes at P78 are low, the “organic” source becomes progressively more evident, with an isotopic shift towards more negative δ 13 C values (up to -19 0 00 ). Conversely, when soil CO 2 fluxes are high the “magmatic” source becomes more influent. However, even in the latter case, fractionation of magmatic CO 2 due to isotopic exchange with C of HCO 3− dissolved in ground water produces a final composition slightly more negative than that inferred for the magmatic source (Fig. 4).
Pecoraino & Giammanco
825
Fig. 4. R/Ra values plotted vs. δ13C(CO 2 ) values in the sampled gases. Arrows indicate isotopic fractionation and/or mixing processes. Grey box labelled A represents the compositional range of magmatic gas at Mt. Etna. Grey box labelled B represents the compositional range of the organic component. Symbol indicates the isotopic composition of air ( P39; VS; Naftìa; RNE; TDF; BLV; P78). Samples from sites P39, VS and Naftìa show very similar He isotope values. R/Ra values range, respectively, from 6.7 to 7.5, from 6.5 to 7.1 and from 6.2 to 7.2 (Table 1). These values are all compatible with a magmatic origin of He (Nakai et al. 1997). Conversely, δ13C(CO 2 ) values in these samples differ markedly from one site to the other. Samples from site Naftìa were characterized by very stable δ 13 C values (around -1 0 00 ). Such isotopic composition indicates a strong contribution of deep magmatic CO 2 (De Gregorio et al. 2002). The low variability of isotopic values of C and He at this site seems to indicate very low or even no interaction with ground water, in apparent contrast with the indication from the chemical features of the emitted gases. This can be explained considering the huge flux of CO 2 (about 200 t/d) issuing from the Naftìa vent; such a large amount of CO 2 prevents any significant isotopic exchange between deep carbon gas and carbon dissolved into shallow aquifers, although permitting some degree of chemical interaction. Samples from site P39 showed δ 13 C values in the range 0.5 to 1.6 0 00 . Such positive values are consequence of isotopic fractionation of carbon due to interaction between magmatic CO 2 and thermal groundwater at temperature > 120°C (Giammanco et al. 1998a), which favours 13 C enrichment in the residual gas phase.
826
TAO, Vol. 16, No. 4, October 2005
Samples from site VS showed δ13C(CO 2 ) values ranging from -3.8 to -1.4 0 00 (Table 1). The slightly more negative values from this site relative to the others in this group could be the result of interaction between magmatic CO 2 and cold groundwater, similar to what described for site P78.
7. TEMPORAL VARIATIONS OF GEOCHEMICAL PARAMETRES 7.1 General Considerations During the period July 2000 - July 2003 (Figs. 5 - 12) large variations were observed in the chemical and isotopic composition of sampled gases, as well as in the efflux of CO 2 through the soil, at all of the sampled sites. Anomalous changes were also recorded in the outlet temperature of the sampled fumaroles. Comparison of geochemical data with local atmospheric parametres concurrently acquired showed that only air temperature had an apparent 2 effect on CO 2 dynamic concentration ( R 2 = 0.55), on soil CO 2 concentration ( R = 0.48) 2 measured at site P78, as well as on soil temperature measured at site TDF ( R = 0.55). In the case of TDF, the computation was made without taking into account the two very high values recorded in May and June 2003, because they are almost certainly due to residual cooling of the nearby magma dike of the 2002-03 eruption. No other significant correlation was found between atmospheric and geochemical parametres as noticed in other volcanic systems (Tatum Volcano Group in Northern Taiwan, Lee et al. 2005). The parameters that were found correlated with air temperature were filtered for the seasonal influence. Soil CO 2 data from P78 were filtered and normalized following a procedure similar to that used by Giammanco et al. (1995) and also by Bruno et al. (2001). Soil temperature data from TDF were filtered by simply subtracting the relevant air temperature values. All the filtered data above described will be used in the following discussion. 7.2 Variations in the CO 2 -Rich Sites (Naftìa, P39, VS) Both at P39 and at VS CO 2 is anticorrelated with He as well as with CH 4 , and this evidence was first reported by Giammanco et al. (1998a). In particular, Giammanco et al. (1998a) used the observed anticorrelation between CO 2 and CH 4 to derive the different origin of the two gases. Because the source of CH 4 is a slowly depleting, shallow hydrocarbon reservoir, it releases gas at a rate that can be considered constant, at least in the time span of some years. Therefore, as specified above, any variation in CH 4 emission at the surface is only due to changes in the flux of magmatic CO 2 that interacts with the CH 4 reservoir. Without taking into account the few very low values due to strong air contamination of our samples (Table 1), the entity of the temporal variations of CO 2 concentration at sites Naftìa, P39 and VS during the studied period (Fig. 5) was minimal in the site with the highest average CO 2 content (Naftìa) and greatest in the site with lowest average CO 2 concentration (VS). However, some common patterns can be recognised at all of these sites. In general, relatively higher CO 2 values were observed in late year 2000 at Naftìa and VS. Some samples
Pecoraino & Giammanco
827
Fig. 5. Temporal variations of CO 2 concentration in the CO 2 - rich sites during the studied period. Grey bars indicate the main lateral eruptions of Mt. Etna ( P39; VS; Naftìa). collected from P39 during the same period showed a strong air pollution due to some problems during gas sampling (the ground was saturated with water spilling out of a nearby channel), and have not been plotted in the graph of Fig. 5. Therefore, information on the pattern of CO 2 at this site during late 2000 is largely incomplete. Since December 2000 we moved our sampling point at P39 just a few meters away from the previous one, in dry soil. Concentrations of CO 2 higher than the respective normal values were again observed at all sites right after the end of the July-August 2001 eruption, in particular from late August to November 2001, then in March-April 2002, from December 2002 to January 2003 and lastly from May to June 2003. Increases of CO 2 content in the gases emitted from these sites suggest increase of magmatic gas pressure at great depth, probably in the deepest magma reservoir inferred from geophysical and geochemical data. Conversely, decreases in CO 2 concentration, such as those observed at all these sites before the 2001 eruption, should indicate rapid depressurisation at depth due to transfer of magma to the upper intermediate reservoir.
828
TAO, Vol. 16, No. 4, October 2005
Carbon monoxide (Fig. 6a) was practically absent at all points until mid-June 2001, that is about one month before the 2001 eruption. During the same period H 2 was high only at P39, but decreased to air values already at the end of 2000 (Fig. 6b). Conversely, after mid-June 2001 CO was frequently observed, although with variable intensity and always with a spikelike character. Almost the same behaviour characterized the H 2 values at P39 and VS, whereas
Fig. 6. Temporal variations of a) CO concentration and b) H 2 concentration in the CO 2 - rich sites during the studied period. Grey bars indicate the main lateral eruptions of Mt. Etna ( P39; VS).
Pecoraino & Giammanco
829
at Naftìa H 2 was always absent. Sites P39 and VS were also characterised by significant variations of δ 13 C values (Fig. 7). Particularly at site VS more positive δ 13 C values, closer to those inferred for Etna’s magmatic source, were measured in the first months of 2001. At the end of the 2001 eruption δ 13 C values became markedly negative, but soon after an increasing trend was observed, although with oscillations. This trend ended at the beginning of the 200203 eruption, when values stabilized close to -2.0 0 00 . Similar values were on average measured until the end of our observations. The variations in the δ 13 C values observed at Naftìa were instead very small and stable around -1 0 00 . The He isotopic values (R/Ra) measured were generally higher at all these sites (Fig. 8) until the beginning of 2002, with highest values during the 2001 eruption. Significantly lower R/Ra values were recorded afterwards. In both periods, several sequences of negative peaks immediately followed by positive peaks were observed in all sites. According to the degassing model proposed by Nuccio and Valenza (1998) and later developed for the Etna area by Caracausi et al. (2003a, b), sequences of minima in the R/Ra values soon followed by maxima are to be interpreted as single episodes of magma ascent. The isotopic composition of the emitted helium results from the balance be-
Fig. 7. Temporal variations of δ13C(CO 2 ) values in the CO 2 - rich sites during the studied period. Grey bars indicate the main lateral eruptions of Mt. Etna ( P39; VS; Naftìa).
830
TAO, Vol. 16, No. 4, October 2005
Fig. 8. Temporal variations of R/Ra values in the CO 2 - rich sites during the studied period. Grey bars indicate the main lateral eruptions of Mt. Etna ( P39; VS; Naftìa). tween He released from less degassed magmas, marked by a high 3 He/ 4 He ratio, and 3 He depleted gases coming from more degassed melt. The higher R/Ra values before 2002 indicate important accumulation of new volatile-rich magma at relatively deep levels of the Etnean volcanic system. In particular, Caracausi et al. (2003a) recognised the ascent of a batch of fresh magma at depth between May and June 2001. The significant general decrease in the R/Ra values after early 2002 would be caused by important migration of magma towards the uppermost portions of the volcano, a possible indication of the following eruptive activity of 2002 - 2003. After early 2002, other sharp variations were observed in the R/Ra values, such as in summer of 2002 and in May-June 2003, which can be interpreted as new arrivals of gasrich melts at depth. However, these magmatic episodes did not seem to be volumetrically important, because they did not induce an appreciable increase in the average R/Ra values.
Pecoraino & Giammanco
831
7.3 Variations in the Air-Contaminated Sites (P78, BLV, TDF, RNE) In these sites the most evident anomalous changes were observed in the CO 2 emissions, in the CO and CH 4 concentrations and in the fumarole temperature. A good correlation can be found between soil CO 2 contents and soil CO 2 dynamic concentrations. As regards the CO 2 emissions (Fig. 9), many anomalous values were recorded throughout the study period. This indicates the occurrence of repeated episodes of intrusion and upward migration of CO 2 - rich magma within the shallowest portions of Etna’s feeder system. It is to be noted that anomalous
Fig. 9. Temporal variations of CO 2 concentrations at a) high-altitude sites and b) P78 during the studied period. Grey bars indicate the main lateral eruptions of Mt. Etna ( RNE; TDF; BLV; P78).
832
TAO, Vol. 16, No. 4, October 2005
increases in CO 2 emission at P78 occurred before those at the other sites located at higher altitude on the volcano. This is compatible with a progressive upward migration of magma towards the uppermost part of the volcanic system. The temporal behaviour of CO at the air-contaminated sites (Fig. 10) was quite similar to that observed at the CO 2 - rich sites: almost no CO emission was recorded before mid-June 2001, whereas after that moment CO was often found. Differently from the CO 2 - rich sites, however, from March-April 2002 until the end of the study period CO contents were almost constantly high and showed two sudden increases followed by a slow decreasing trend. In
Fig. 10. Temporal variations of CO concentrations at a) high-altitude sites and b) P78 during the studied period. Grey bars indicate the main lateral eruptions of Mt. Etna ( RNE; TDF; BLV; P78).
Pecoraino & Giammanco
833
particular, the onset of these two anomalies (March - April 2002 and March - April 2003) coincide with anomalous high CO 2 and CH 4 emissions in the same sites. This would strengthen the hypothesis of arrival of fresh magma in the shallowest portions of Etna’s feeder system, but differently from what observed before March 2002, a higher gas velocity, probably related to a higher gas pressure, has to be invoked to justify the constantly high emission of such a fast reacting and fast re-equilibrating gas species as CO (Giggenbach 1991). It must be noted that the anomalies in CO concentrations continued both during and after the occurrence of the 2002 - 03 eruption. This would suggest that magmatic pressure kept accumulating inside the volcano despite that lateral eruption. Values of δ 13 C at site P78, as already described, showed the strongest positive shift when soil CO 2 emissions were highest. In the other sites of this group carbon isotopes showed quite synchronous variations, although with different intensities. In these sites, δ 13 C values shifted towards those inferred for the magmatic source of Etna not only right before the two main eruptions, but also in November 2001 and in May 2002 (Fig. 11). The temporal changes in fumarole temperature at RNE and BLV (Fig. 12) showed similar anomalous periods as for the other parameters. It is to be noted that site BLV temperature values recorded between the two lateral eruptions were constantly higher than the background values measured before the 2001 eruption and after the 2002 - 03 eruption. In the same site it is worth mentioning the very high temperature value measured in June 2003, which well exceeded the boiling temperature of water at that altitude and would indicate a particularly strong input of high-enthalpy fluids in the shallow water table beneath the site. Temperature values at TDF, after filtering from the influence of air temperature, show a higher mean (+3.8 °C) during the period July 2000 - January 2002 compared to that of the following period (-1.9°C), without taking into account the very high values measured in may and June 2003.
8. DISCUSSIONS AND CONCLUSIONS As a general rule, variations in the concentration and/or flux of gases issuing from the flanks of active or quiescent volcanoes can be due basically to changes in two different types of factors: environmental or volcanic. Environmental factors include atmospheric parametres such as air temperature, barometric pressure, air humidity, wind speed, rain or snow fall. These are normally characterised by periodic variations (daily, seasonal, etc.) that may be reflected in the variations of some geochemical parametres, particularly in sites with relatively low gas efflux (Hinkle 1990; Giammanco et al. 1995). Other influencing environmental parametres are those linked to the characteristics of the ground through which the gases diffuse or flow. Some of these characteristics depend on atmospheric factors: for example, soil permeability may change as a function of rain fall, which may heavily increase the amount of pore water; furthermore, rain water infiltrates and feeds underground aquifers, whose presence and volume can trigger and govern the interaction between groundwater and deep gas. Volcanic factors include increases in the efflux of magmatic fluids due to upward motion of gas-rich magma and its consequent progressive saturation in, and release of, the least soluble gas species. In particular, impulsive increases in the emission of reduced gas species (mostly H 2 and CO)
834
TAO, Vol. 16, No. 4, October 2005
may be due to disequilibrium conditions in the gas phase dissolved in the magma imposed by a rapid migration of magma towards shallower and more oxidised portions of crust (e.g., Sato and McGee 1981; Sato 1988; Giammanco et al. 1998a). According to recent geochemical models based on the relations between gas bubbles formation and migration within magma and velocity of magma migration within the volcanic edifice (Giammanco et al. 1995, 1998a; Nuccio and Valenza 1998; Bruno et al. 2001), increases in the emission of CO 2 from the flanks of the volcanic edifice (in fumaroles and soil emissions) would indicate higher gas release from a deep source due to increased exsolution
Fig. 11. Temporal variations of δ13C(CO 2 ) values in the N 2 - rich sites during the studied period. Grey bars indicate the main lateral eruptions of Mt. Etna ( RNE; TDF; BLV; P78).
Pecoraino & Giammanco
835
Fig. 12. Temporal variations of fumarole temperature values at BLV, TDF and RNE during the studied period ( RNE; TDF; BLV; P78). Values from TDF were filtered from the seasonal variations (see text). Grey bars indicate the main lateral eruptions of Mt. Etna. of gas from an ascending, gas-rich magma. Furthermore, sudden and/or marked decreases can be ascribed to rapid magma migration within the volcanic edifice, either upwards or laterally. During the period July 2000 - July 2003, five periods of marked anomalies were recognized: August - December 2000, April - September 2001, October - December 2001, April - November 2002 and May - June 2003. Because of the general lack of environmental influences on the entity and variation of parietal degassing at Mt. Etna, the observed anomalous signals are coherent in indicating as increased magmatic degassing from an up-rising body of fresh magma. Occurrence of gas anomalies in the majority, if not in all, of the sites, some of which located at great linear distance (up to 50 km) one from the other, suggests increase of magmatic gas pressure in a deep magma reservoir beneath Mt. Etna. This reservoir probably corresponds to the deepest one (> 10 km depth) inferred from geophysical and geochemical data. The large width of this magma reservoir, indicated by Caracausi et al. (2003a) to be about 60 km, was hypothesised to explain the almost synchronous variations in the isotope composition of He observed in sites located both at the foot of Etna (P39 and VS) and almost 40 km away from its
836
TAO, Vol. 16, No. 4, October 2005
boundary (Naftìa). According to Caracausi et al. (2003a), the site Naftìa with its huge emission of CO 2 is directly linked to an active magma intrusion in the uppermost 30 km of crust. More recently, Caracausi et al. (2003b), based on the computed pressures for the gases feeding the Naftìa emissions, invoked the presence of magma into dikes that probably extend up to 3 4 km beneath the surface and are frequently replenished with fresh magma. Support to this assumption came from the reported high heat fluxes (up to 100 mW m−2, according to Cataldi et al. 1995; Barbier et al. 1998) close to this site, along a fault system directed NE-SW. In our opinion, an alternative model is that the site Naftía is the surface expression of a “gas dike” formed into the lithospheric NE-SW-trending faults. According to Carrigan (2000), a gas dike can form when hydraulic fracturing induced by hot magmatic gas under pressure causes crustal breaking and the fracture is kept open. In the case of magma intrusion, the following applies:
Ptip mag = Pmag − ρmag g 1