Research Article
Spatial and temporal functional changes in alpine summit vegetation are driven by increases in shrubs and graminoids Susanna Venn 1,2*, Catherine Pickering 1 and Ken Green 3 1 2 3
School of Environment, Environmental Futures Centre, Griffith University, Gold Coast, QLD 4222, Australia Department of Botany, Research Centre for Applied Alpine Ecology, La Trobe University, Bundoora, VIC 3086, Australia New South Wales National Parks and Wildlife Service, Snowy Mountains Region, PO Box 2228, Jindabyne, NSW 2627, Australia
Received: 14 October 2013; Accepted: 24 January 2014; Published: 21 February 2014 Citation: Venn S, Pickering C, Green K. 2014. Spatial and temporal functional changes in alpine summit vegetation are driven by increases in shrubs and graminoids. AoB PLANTS 6: plu008; doi:10.1093/aobpla/plu008
Abstract. Classical approaches to investigating temporal and spatial changes in community composition offer only partial insight into the ecology that drives species distribution, community patterns and processes, whereas a functional approach can help to determine many of the underlying mechanisms that drive such patterns. Here, we aim to bring these two approaches together to understand such drivers, using an elevation gradient of sites, a repeat species survey and species functional traits. We used data from a repeat vegetation survey on five alpine summits and measured plant height, leaf area, leaf dry matter content and specific leaf area (SLA) for every species recorded in the surveys. We combined species abundances with trait values to produce a community trait-weighted mean (CTWM) for each trait, and then combined survey results with the CTWMs. Across the gradient of summits, more favourable conditions for plant growth (warmer, longer growing season) occurred at the lower elevations. Vegetation composition changes between 2004 and 2011 (according to non-metric multi-dimensional scaling ordination) were strongly affected by the high and increasing abundance of species with high SLA at high elevations. Species life-form categories strongly affected compositional changes and functional composition, with increasing dominance of tall shrubs and graminoids at the lower-elevation summits, and an overall increase in graminoids across the gradient. The CTWM for plant height and leaf dry matter content significantly decreased with elevation, whereas for leaf area and SLA it significantly increased. The significant relationships between CTWM and elevation may suggest specific ecological processes, namely plant competition and local productivity, influencing vegetation preferentially across the elevation gradient, with the dominance of shrubs and graminoids driving the patterns in the CTWMs. Keywords:
Alpine vegetation; community composition; functional composition; functional traits; GLORIA; Snowy Mountains.
Introduction In the context of environmental change, linking quantitative measures of plant species physical characteristics, for example their functional traits or life form, with species distributions and local environmental factors can reveal the processes that drive patterns in vegetation
composition (Dı´az and Cabido 1997; Tilman et al. 2001; Lavorel and Garnier 2002; McGill et al. 2006). The interaction among functional groups of species with climatic changes undoubtedly affects community composition and underlying ecosystem functioning (Hooper and Vitousek 1997; Westoby and Wright 2006; Spasojevic and Suding 2012). Hence, measures of functional traits,
* Corresponding author’s e-mail address:
[email protected]
Published by Oxford University Press on behalf of the Annals of Botany Company. This is an Open Access article distributed under the terms of the Creative Commons Attribution License (http://creativecommons.org/ licenses/by/3.0/), which permits unrestricted reuse, distribution, and reproduction in any medium, provided the original work is properly cited.
AoB PLANTS www.aobplants.oxfordjournals.org
& The Authors 2014
1
Venn et al. — Functional change in alpine summit vegetation
functional diversity or functional composition, in combination with measures of species composition and diversity, may provide greater insights into the assembly processes that drive community composition and for gauging ecosystem stability in changing environments (Tilman et al. 1997). Using environmental gradients is a simple way to examine natural variation in vegetation and community responses to environmental changes (McGill et al. 2006). Intraspecific variation and species turnover can cause shifts in trait values differentially across gradients, and thus functional diversity across environmental gradients is a function of biotic and abiotic interactions (Venn et al. 2011; Scho¨b et al. 2012; Spasojevic and Suding 2012), disturbance regimes (Choler 2005), population dynamics (Pollock et al. 2012) and biogeochemical cycling (Mason et al. 2012) at local, regional and biome scales (Reich et al. 1997). Mountainous regions are therefore ideal for testing the role of plant functional traits across environmental gradients in determining community composition and shifts therein; over relatively short spatial scales, rapid changes in elevation interact with local topography to create steep gradients in temperature and precipitation (Ko¨rner 1999). Thus, the variation in species abundance across an environmental or elevation gradient will impact on community composition and ecosystem functioning (Tilman et al. 1997), as different processes are affected by different species via changes in the representation of species functional traits (Chapin et al. 1996). The interrelation between a species life form and its functional traits is exemplified across elevation gradients in alpine regions; for example, shrubs (taller, long-lived, woody plants) dominate in favourable environments. Through their morphological and physiological traits, shrub species can modify a wide range of ecosystem processes, including alteration of local snow depths and associated hydrological dynamics, nutrient exchange and associated net carbon balance (Myers-Smith et al. 2011). In addition, shrub species are often taller than neighbouring forbs and they can be competitively superior, forming dense thickets with closed canopies. Increases in shrub cover and height can also potentially restrict the growth of other plant species by limiting light availability (Myers-Smith et al. 2011). Graminoids, namely grasses and sedges, however, may compete with shrubs in the more favourable environments, recruit within the canopy of senescing shrubs (Williams and Ashton 1988) and are well adapted to a range of environmental conditions; many C3 grasses and sedges can also rapidly increase in abundance after sufficient rainfall and improved abiotic conditions (Jarrad et al. 2009). Here, we use community trait-weighted means (CTWMs) to explore the driving mechanisms of temporal
2
AoB PLANTS www.aobplants.oxfordjournals.org
change in vegetation composition across an elevation gradient of alpine summits. We used four easily measured morphological traits: plant height at maturity, leaf area, leaf dry matter content (LDMC) and specific leaf area (SLA); some of these are interrelated, but all represent important dimensions of functional and strategic variation among plant species (Westoby 1998; Weiher et al. 1999) and are responsible for some of the most striking and important patterns in species distributions in the field (Westoby et al. 2002; Choler 2005). In addition, large-scale comparisons among biomes provide evidence that these traits may be viewed as relevant functional markers suitable for predicting species performance along gradients (Reich et al. 1997). While we did not measure community assembly processes directly, these chosen traits are important for various assembly processes and population dynamics such as competition, facilitation, productivity, and stress tolerance and longevity (Grime 1977; Westoby 1998; Cornelissen et al. 2003; Scho¨b et al. 2012; Michalet et al. 2014). We can therefore infer the mechanisms behind changes in community composition based on life forms, individual traits and patterns in the CTWMs. The elevation gradient of sites represents a strong gradient of temperatures, snowmelt date and growing season length, and therefore represents an important gradient across which community composition and functional composition are expected to vary preferentially, according to position along the gradient. Specifically we ask: what is the spatial and temporal variation in species composition across the gradient of sites; and where are various combinations of traits and life forms most prevalent? We then discuss how these composition patterns and functional traits interact with species’ ecology preferentially across the gradient of sites.
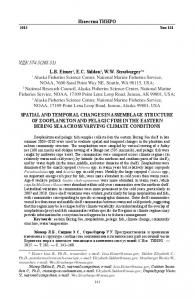
Methods Study sites We used five alpine summits in this study that represent the Australian contribution to the Global Observation Research Initiative in Alpine Environments (GLORIA): an ongoing, empirical study with the specific aim of detecting alpine vegetation change on summits in relation to climate change. In January 2011, we re-surveyed the summits that were originally marked and surveyed in January 2004 that exist along a continuous ridge from close to the valley floor to the summit of Mt Clarke (Pickering et al. 2008; Pickering and Green 2009) (Fig. 1). The summits cover an elevation range of 301 m from the lowest at 1813 m (Clarke 5) through to the highest at 2114 m (Clarke 1) (Table 1) and cover a horizontal distance of 1600 m. The summits were selected for long-term
& The Authors 2014
Venn et al. — Functional change in alpine summit vegetation
Figure 1. Location of the Snowy Mountains in Australia and study site locations at Mt Clarke 1 –5 (CL1, CL2, CL3, CL4, CL5) representing the five summits.
monitoring under the GLORIA sampling protocols (Pauli et al. 2004), as they experience similar effects of exposure and differences in climate that are most likely due to the elevation gradient. They are all relatively flat, rather than cone-shaped peaks, and the vegetation is characteristic of nearby summits. The soils are around 350 + 110 mm in depth (K. Green, unpubl. res.), well-formed alpine humus soils (Costin 1954). The highest summits are dominated by tall alpine herbfield (a mixture of forbs and graminoids), whereas the lower summits are characterized by shrubs. As a result of the continuous, mostly perennial vegetation cover, biomass is high compared with some other alpine regions (Costin 1954). There are some rock outcrops, but these are not a defining feature of the summits. Disturbance is minimal as cattle grazing ceased .60 years ago, the historical stock travelling route avoided these summits and there are few native and no exotic burrowing mammals at these elevations. No walking tracks cross the summits, resulting in low visitation rates.
Variation in abiotic variables across the gradient of summits The variation in soil temperatures, nutrients and minerals across the elevation gradient has been described previously for the summits (Pickering et al. 2008; Pickering and Green 2009; Venn et al. 2012a). Temperature recording began at the summits in January 2002 using
AoB PLANTS www.aobplants.oxfordjournals.org
temperature loggers (Tinytag Plus—Gemini Data Loggers, Chichester, UK) buried 10 cm below the ground surface. From January 2004 to the present, loggers have been in position at the ‘corner’ of each aspect of each summit. Temperatures were recorded every 2 h. Temperature data from 2004 to 2011 were used to calculate annual values of absolute minimum soil temperature, annual daily mean soil temperature, absolute maximum soil temperature, temperature sums (.5 8C), growing degree days and the length of the growing season across the years sampled. Several climate parameters were derived from these data and used in previously published analyses (Pickering and Green 2009; Venn et al. 2012a). Precipitation data were collected from 2003 to 2011 from a Bureau of Meteorology automated weather station about 8 km to the south at Thredbo (1957 m), and from Pengilley Bog (1730 m, during the growing season only), 13 km to the north-east. Soil samples were collected in 2003 at each summit, on each aspect close to the 1-m2 quadrat clusters, giving a total of four individual soil samples per summit. A minimum of 500 g was collected in a single sample, taking the top 10 cm of soil through a 75-mm core. Samples were air-dried, sieved through a 2-mm mesh and analysed by the CSIRO Division of Soil and Water, Canberra, Australia. Samples were analysed for 17 minerals/nutrients (see Pickering and Green 2009 for full details).
& The Authors 2014
3
4 Clarke 1 Clarke 2 Clarke 3 Clarke 4 Clarke 5 ................................................................................................................................................................................................................................. Location E 148.2875, S 36.4328 E 148.2911, S 36.4328 E 148.2961, S 36.4347 E 148.3000, S 36.4356 E 148.3078, S 36.4356 Elevation (m.a.s.l.)
2114
2079
1992
1948
1813
5 m SAS area (m )
4722
3373
2860
3435
2212
10 m SAS area (m2)
7581
8196
8551
8920
8664
Mean species richness per area
2011
Change +/2
2011
Change +/2
2011
Change +/2
2011
Change +/2
2011
Change +/2
Upper mountain SAS (mean of aspects)
21.2
20.5
23
+0.3
31.8
+0.5
31
+2.3
30.3
21.3
Lower mountain SAS (mean of aspects)
25
+4
28.5
+2.8
34.5
+4
34.7
+11.5
32.3
+4.5
2011
Change (%)
2011
Change (%)
2011
Change (%)
2011
Change (%)
2011
Change (%)
Graminoids
72.6
+22.4
50.9
+30.4
82.6
+90.7
67.3
+115
79.1
+324.7
Forbs
25.6
25.0
14.2
+10.2
13.7
233.8
18.9
+11.3
12.3
+85
Shrubs
9.5
+29.1
42.6
+23.9
14.2
+12.5
50.5
+34
92.7
+38.4
62.0
+25.7
68.6
+46.3
81.1
+75.4
63.1
+96.1
81.6
+150.3
2
Vegetation (overlapping cover %) Upper mountain SAS (sum for summit)
Lower mountain SAS (sum for summit) Graminoids Forbs
34.3
+10.8
25.5
217.6
18.4
226.3
28.8
+46.5
22.2
+349.4
Shrubs
18.1
+18.1
30.4
+53.5
14.6
28.0
47.7
+12.6
65.4
+12.7
2011
Change (%)
2011
Change (%)
2011
Change (%)
2011
Change (%)
2011
Change (%)
Community trait-weighted mean Upper mountain SAS (mean of aspects) Height (mm)
128.0
23.3
116.3
+4.5
154.1
210.1
180.9
25.1
227.5
221.2
Leaf area (mm2)
396.2
28.9
237.5
+3.7
291.7
21.6
208.7
+10.3
138.3
+104.4
LDMC (mg g21)
192.0
+4.8
299.5
27.5
183.3
214.3
335.2
27.8
382.3
216.1
38.4
+6.8
30.2
+4.7
40.6
+21.6
28.5
+19.6
20.6
+92.8
2
SLA (mm mg
21
)
& The Authors 2014
Lower mountain SAS (mean of aspects) 121.6
+0.5
123.9
+0.8
144.6
26.7
187.9
212.9
226.5
227.4
2
354.9
+2.5
297.5
215.9
307.1
+13.7
258.3
+16.1
163.4
+110.3
)
225.2
23.9
248.7
+6.3
184.3
218.8
317.7
26.2
346.8
216.6
32.5
+6.8
35.2
+14.7
41.1
+26.8
28.0
+18.4
22.2
+84.6
Height (mm) Leaf area (mm ) 21
LDMC (mg g 2
SLA (mm mg
21
)
Venn et al. — Functional change in alpine summit vegetation
AoB PLANTS www.aobplants.oxfordjournals.org
Table 1. Summit details including locations, elevation (metres above sea level (m.a.s.l.)) and area (m2); the mean species richness and overlapping vegetation cover for each of the upper and lower SASs divided into three life-form groups (graminoids, forbs and shrubs) for 2011 and the change in mean species richness since 2004 (increase + or decrease 2) at each summit; and the CTWM for four traits (height, leaf area, LDMC and SLA) for each of the sampling units for 2011 and the change in overlapping cover (%) since 2004 at each summit.
Venn et al. — Functional change in alpine summit vegetation
Vegetation sampling The top section of each summit was divided into eight summit area sections (SASs), four covering the area down to 5 m below the summit, the 5-m isoline, for each of the four cardinal compass bearings (hereafter referred to as the upper or 5-m SAS), and another four covering the four compass bearings down to the 10-m isoline (hereafter referred to as the lower or 10-m SAS) (Pauli et al. 2011). Where the summit was exceptionally flat, the upper sampling area extended 50 m from the summit and the lower area extended 100 m. In each of the eight SASs the percentage cover of each vascular plant species was estimated using a random step-pointing method (200 points per area). In this method, vegetation is sampled at randomly generated points across the site, and hits are summed for each species in order to provide a measure of species abundance. Any species not sampled by the step-point method were visually assessed for cover (Pauli et al. 2011). Sampling in 2011 was conducted ‘blind’ without referring to the 2004 data, and was performed by the same people to ensure consistency in the data over the days of fieldwork (Vittoz et al. 2010). Postsampling, a rigorous species identification checking procedure, was used to
ensure that changes in species between 2004 and 2011 were accurate. All species names follow Costin et al. (2000) to be consistent with the initial 2004 survey. We selected four important, character-based plant traits (plant height, leaf area, LDMC and SLA) (Table 2) to use in the functional composition analyses. Trait data, including destructive sampling, were not directly measured from plants within the study sites; rather all traits were collected from adjacent areas ,200 m from the study sites, from within the Kosciuszko National Park alpine area in growing seasons of 2010, 2011 and 2012, using 10 adult individuals for each measurement. We chose these traits based on the individual plant and ecosystem functions in which they are involved (Lepsˇ et al. 2006; Petchey and Gaston 2006), in the context of alpine plant community dynamics (Table 2).
Data analysis Vegetation composition. In order to determine shifts in species composition and abundance between 2004 and 2011 across the gradient of sites, we used non-metric multi-dimensional scaling (NMDS) and ordination. Species abundance data from the upper and lower SASs were log + 1 transformed to down-weight very
Table 2. Plant traits measured for all species recorded in the upper and lower SASs. Traits were measured in the field and laboratory based on protocols outlined by Cornelissen et al. (2003). Trait (unit) Description Functional indicator ............................................................................................................................................................................ Plant height (mm) Shortest distance between the upper boundary of the A measure of species overall competitive ability at plant main photosynthetic material (usually the canopy) and
maturity. Species that are relatively taller will be more
ground level
competitive, usually for light. Indirect measurement for biomass, lateral spread, rooting depth and leaf size
2
Leaf area (mm )
One-sided projected surface area of an average leaf
A measure of stress tolerance. Small leaves tend to be favoured under heat stress, cold stress, drought stress and high-radiation stress. Within a climate zone, leaf size tends to increase with plant height and soil nutrients, but decreases with disturbance. Larger leaves are expected in more productive landscapes
21
LDMC (mg g
)
The ratio of the oven-dry mass of a leaf to the fresh
Indirectly represents the mean density of leaf tissue, relates
weight of the leaf
to the inverse of SLA. Low LDMC can indicate fast resource acquisition. Leaves tend to be more resistant to physical stress such as wind and hail. Species with low LDMC tend to be associated with highly disturbed environments and high productivity
2
SLA (mm mg
21
)
Ratio of one-sided area of a fresh leaf to its oven-dry
Low values correspond to relatively high investments in
mass
defences to harsh conditions including long life spans and structural adaptations. Reflects the expected return on previously captured resources such as light and nutrients. A good positive correlate of potential growth rate
AoB PLANTS www.aobplants.oxfordjournals.org
& The Authors 2014
5
Venn et al. — Functional change in alpine summit vegetation
common species, and dissimilarities between all pairs of aspects from the upper and lower SASs were calculated using the Bray– Curtis dissimilarity coefficient (after 999 iterations), previously noted as a robust measure in recovering ecological distance over a range of models and stochastic variations in the data (Bray and Curtis 1957; Quinn and Keough 2003). How good the dissimilarity matrix is was determined by the stress value (Kruskal 1964; McCune and Mefford 1999). Stress values ,0.2 are recommended (Clarke 1993) as values above this threshold may mislead interpretations. The difference in vegetation composition between 2004 and 2011 was analysed by an analysis of similarities (ANOSIM) procedure (Clarke 1993; Quinn and Keough 2003). This procedure is analogous to an analysis of variance comparing between-group and within-group variation. The ANOSIM procedure tests the null hypothesis that there are no differences between a priori defined groups (in this case years), or that the average rank of dissimilarities between all possible pairs of objects in different groups is the same as the average rank of dissimilarities between pairs of objects in the same groups (Quinn and Keough 2003). All ANOSIM procedures for abundance data from the three spatial scales used permutation/randomization methods on a similarity matrix to allocate objects randomly to groups and then generate the distribution of R under the null hypothesis that all random allocations are equally likely (Clarke 1993; Quinn and Keough 2003). The R distribution is scaled between pairs of objects in the same group with values between 21 and 1. Differences between groups would be suggested by R values greater than zero where objects are more dissimilar between groups than within groups. R values of zero indicate that the null hypothesis is true. R ¼ 1 indicates that all samples within groups are more similar to each other than to those in different groups (Quinn and Keough 2003). The dominant character species, those that are useful in discriminating between years at each of the spatial scales, were explored using the similarity percentages (SIMPER) procedure (Clarke 1993), performed using the PRIMER 6 package (Plymouth Routines in Multivariate Ecological Research 5.1.2. 2010). This procedure utilizes the similarity and dissimilarity indices between all pairs of samples to identify typical species within a site/year, as well as important species that distinguish between years. Community trait-weighted means. In order to illustrate functional changes between 2004 and 2011 across the gradient of summits, we calculated the CTWM for the assemblages of plants recorded in the upper and lower SASs at every summit, for each of the four traits. The
6
AoB PLANTS www.aobplants.oxfordjournals.org
CTWMs were calculated by the method proposed by Mason et al. (2003), interpreted by Mason et al. (2005) and modified by Lepsˇ et al. (2006). This method allowed us to calculate the relative abundance of individual trait responses to the gradient of sites and over time, weighted by the absolute individual species abundances, rather than provide an aggregate index based on multi-trait space (Villeger et al. 2008). We utilized the software of Lepsˇ and de Bello (2008) to assist in scaling our trait and abundance values for the data from the three spatial scales and to calculate the CTWM values. Temporal change across the summits in CTWM was measured as the per cent difference between mean values between 2004 and 2011, and by examining the overlap of 95 % confidence intervals from a normal distribution of the data across the three spatial scales (Cumming and Finch 2005). Combining all sites, the difference between the 2004 and 2011 values of functional composition for each trait was compared with paired t-tests using the quadrants of each site (aspects) as replicates. The relationships between site elevation and the abundance-weighted trait means were assessed with simple linear regression. Additionally, the relationships between the vegetation composition across sites and trends in the CTWMs at those sites were illustrated by overlaying vectors on each of the two-dimensional ordinations, for both the upper and lower SASs, in order to illustrate which traits are more abundant and display any trends across the ordination, as well as their direction and influence in relation to the compositional floristic data. Only the community-weighted trait means were used as vectors, and only those with correlations to each ordination where R 2 . 0.5 are displayed. Ordinations, ANOSIM and SIMPER routines were performed using the PRIMER 6 package (Plymouth Routines in Multivariate Ecological Research 2010). SYSTAT ver. 10 (Copyright SPSS Inc., 2000) was used for all other statistical analyses.
Results Variation in abiotic variables across the elevation gradient Across the gradient of sites, soil temperature and growing season length have been shown in previous analyses to vary predictably with elevation. Repeatedly, more favourable conditions for plant growth have been found at the lower-elevation summits, with cooler, shorter growing seasons with (often) less available nutrients at the higher summits (Pickering and Green 2009; Venn et al. 2012a). As previously described in Venn et al. (2012a), there were no consistent summit-specific trends (increases or decreases) in climatic variables across the summits
& The Authors 2014
Venn et al. — Functional change in alpine summit vegetation
between 2004 and 2011, although relationships between summit elevation and climate between 2004 and 2011 remained consistent; minimum temperatures (linear regression: R 2 ¼ 0.28, P ¼ 0.016), mean temperatures (linear regression: R 2 ¼ 0.44, P ¼ 0.005) and number of growing season (snow-free) days (linear regression: R 2 ¼ 0.23, P ¼ 0.032) all significantly decreased with increasing elevation but not maximum temperatures (using the data from four temperature loggers at each site as replicates) (Venn et al. 2012a). Although precipitation was not specifically measured at each summit, data from the nearby rain gauges revealed substantial increases in annual and growing season precipitation over the 2010/2011 growing season (October to April) in comparison with previous years in which the region experienced low rainfall conditions for almost a decade (Venn et al. 2012a, b). At Thredbo, there was a 30 % increase in annual precipitation in 2011 compared with 2004 (mean precipitation between 2004 and 2009 was 1136 mm, whereas in 2011 it was 1647 mm). Growing season precipitation at Pengilley Bog was about 50 % higher in 2011 compared with previous years (mean growing season precipitation between 2003/2004 and 2009/2010 was 575 mm, whereas in 2010/2011 it was 1182 mm) (Venn et al. 2012a). Soil nutrient analyses conducted in 2003 revealed few trends across the elevational gradient of sites (Pickering and Green 2009). Importantly, however, organic carbon (%), available nitrogen (as ammonium) and aluminium (mg kg21) all decreased with increasing elevation.
Temporal change in vegetation composition Overall, species richness between 2004 and 2011 tended to increase at all sites (Table 1), with the largest mean increase occurring in the lower mountain SAS at Clarke 4 (+11.5 species). Vegetation composition changes between 2004 and 2011 across the gradient of sites were most pronounced among graminoids and forbs at the lowest site, Clarke 5, with an increase in forb abundance of up to 350 % in the lower mountain SAS (Table 1). Notable increases in graminoids were partly made up of the presence of new species in 2011 in many SASs across all summits, namely Agrostis sp., Deyeuxia crassilisica, Australopyrum velutinum (Poaceae), Carex breviculmis (Cyperaceae) and Luzula alpestris (Juncaceae). Changes in abundance across life forms were generally within the same order of magnitude between the upper and lower SASs on each summit. Shrub abundance increased substantially in the lower SASs at the two highest sites, Clarke 1 and 2 (Table 1). Simple linear regression revealed few discernible patterns in the change in abundance of particular life forms between years across the gradient of sites, except for within graminoids in the
AoB PLANTS www.aobplants.oxfordjournals.org
upper and lower SASs, with per cent change decreasing significantly with site elevation (upper SAS: R 2 ¼ 0.92, P ¼ 0.008; lower SAS: R 2 ¼ 0.99, P ¼ ,0.001). Compositional changes between 2004 and 2011, illustrated by the ordination diagrams, point to similar directional changes across all summits and sampling areas. In general, the vegetation composition in 2011 has changed in a consistent manner within and among sites in ordination space (Fig. 2), tending towards groupings of species with similarly high SLA. This also indicates that the turnover and abundances of key species have been similar across sites. This is most pronounced in the diagram illustrating the combined summit data for the lower SASs, indicating that the vegetation composition between 2004 and 2011 changed similarly across summits (Fig. 2B). The ANOSIM results point to significant differences in the vegetation composition between sample times, using aspects as replicates across sites (Table 3) within quadrats, the upper and lower summit areas. The vectors that represent the functional composition in the community-weighted trait means, overlaid on the ordination diagrams, point clearly to the higherelevation summits having high abundances of species with higher SLA ratios and larger leaf areas (Fig. 2). Conversely, the lower-elevation summits appear to have proportionally higher abundances of species that are taller and have larger LDMC values. Graminoid and shrub abundance tended to contribute to the majority of the differences between 2004 and 2011, revealed through the SIMPER analyses, using aspects on summits as replicates and with the data combined for each summit (Table 4). The abundances of the top 10 most influential and discerning species generally increased between sample times (Table 4), leading to the dissimilarity in vegetation composition between 2004 and 2011 as identified in the ANOSIM analyses. At the lower and higher SASs across sites, shrub species were identified as the most influential in determining differences between years (at least 5/10 of the top species were shrubs, using aspects as replicates and with data combined for each summit respectively) (Table 4). Graminoid species were the second most influential group leading to dissimilarity between years.
Spatial and temporal patterns in functional traits and CTWMs The most substantial differences in the CTWM occurred at the lowest summit, Clarke 5, of up to 110 % for leaf area and SLA traits between years. At the higher-elevation summits, the CTWM for leaf area and SLA traits increased by up to 26 % in 2011, with the largest increases within the lower SASs (Table 1). The CTWM for SLA increased significantly between 2004 and 2011 in both the upper and
& The Authors 2014
7
Venn et al. — Functional change in alpine summit vegetation
Figure 2. Non-metric multi-dimensional scaling ordinations of the (A) upper and (B) lower SASs at two levels of replication, within the five Mt Clarke summits using aspects, north, east, south, west, as replicates, and whole summits, to illustrate differences in vegetation composition (abundance) between 2004 (closed shapes) and 2011 (open shapes). Sites (shapes) close to each other in ordination space indicate high levels of similarity in species composition. Vector lines represent the CTWM values for the plant traits (height, leaf area, LDMC, SLA) with a Pearson’s correlation of .50 % with the vegetation data for each year and sampling unit. Vector lines indicate the degree to which those functional traits affect the groupings (similarity) of sites in ordination space.
Table 3. Results from the ANOSIM procedure across summits at the three sampling units and two levels of replication within sites (summits), comparing the similarity in vegetation data between 2004 and 2011. Sampling unit/replication n Global R P .................................................................................. Upper SAS/summit aspects 10 0.04 0.01 Upper SAS/summits Lower SAS/summit aspects Lower SAS/summits
5
0.09
0.19
10
0.07
0.05
5
0.06
0.25
lower SASs of Clarke 5 (1813 m) and Clarke 3 (1992 m) (Fig. 3). The CTWM for leaf area was significantly greater at Clarke 5 in the upper SASs between 2004 and 2011 and the CTWM for plant height decreased significantly between 2004 and 2011 at Clarke 5 in the upper and lower SASs (Fig. 3). Paired t-tests between the CTWM for each trait, combining all sites and using summit aspects as replicates
8
AoB PLANTS www.aobplants.oxfordjournals.org
(n ¼ 20 for each test), revealed several significant differences between years; on the upper summit areas the CTWM for plant height and LDMC were significantly lower in 2011 (P ¼ 0.004 and P ¼ 0.003, respectively), whereas the CTWM for SLA was significantly higher (P , 0.001). On the lower summit areas, the significant differences trended in the same direction (plant height, P ¼ 0.019; LDMC, P ¼ 0.011; SLA, P , 0.001). Across the gradient of summits there were several significant linear relationships with good predictive power between the CTWM value for each of the measured traits and site elevation. Notably, plant height (decrease with elevation), leaf area (increase with elevation), LDMC (decrease with elevation) and SLA (increase with elevation) were all significantly related to elevation in 2004, whereas only plant height and leaf area were significantly related to elevation in 2011 (Fig. 3). Considering species preferentially organize themselves across the gradient in relation to environmental variables (Pickering and Green 2009; Venn et al. 2012a), we are confident that
& The Authors 2014
Venn et al. — Functional change in alpine summit vegetation
any intraspecific trait variation will be overridden by the strong patterns in species distributions and life forms at these sites. The relationships between site elevation and the CTWM values for each trait (Fig. 3) demonstrate how the CTWM of each site is determined floristically (by abundance) across the gradient of sites. Additionally, the significant increases in the CTWM for SLA between 2004 and 2011 can be attributed to the changes in mean abundance of key shrub species (Table 4) with small, tough leaves such as Kunzea muelleri which increased in abundance. The significant decreases in the CTWM for plant height at Clarke 5 (Fig. 3), however, can mostly be attributed to the relative increases of the short/prostrate shrub Eparcis microphylla (Ericaceae) on this summit.
Discussion Linking changes in vegetation composition with functional composition Our exploratory analyses have demonstrated how a short-term change in vegetation composition affects the CTWM and how it varies preferentially across the gradient of summits. Not surprisingly, the patterns in life forms across sites strongly reinforce the patterns in the CTWM, as do broad functional groups of species across other environmental gradients (Reich et al. 1997; Choler 2005). In general, with increasing elevation within both the lower and upper SASs, shrub species appear less abundant and forb species more so, whereas the proportion of graminoid species tends to increase in abundance with elevation, a trend similarly reported in other local studies (Venn and Morgan 2005; Venn 2007). Across the gradient, the CTWM for plant height decreases significantly with elevation as the proportion of tall shrub species (particularly Phebalium ovatifolium) decreases with longer snow seasons and lower temperatures at higher elevations. Similarly, the CTWM for the leaf traits corresponds with the higher proportion of forbs and graminoids at the higher elevations; SLA and leaf area increase with elevation and LDMC decreases, reflecting the higher abundances of smaller, compact forb and graminoid species (particularly the sedges Carex hebes, C. breviculmis) at the higher elevations, as is found in similar studies (Kudo et al. 1999; Choler 2005; Venn et al. 2012a). These trends were also apparent at the scale of SAS within mountains, where directional differences in life form and the CTWM exist between the upper and lower summit areas. Species with small, thick leaves and low SLA are key features of high, wind-exposed sites (Tranquillini 1964; Kudo et al. 1999; Choler 2005), as is the high abundance
AoB PLANTS www.aobplants.oxfordjournals.org
of short-statured species as found at these sites, but also many of the shrub species dominant at the lower elevations, which is typical of many Australian shrubs (Groves 1994). This is consistent with studies relating canopy architecture and plant height to wind in exposed sites (Caldwell et al. 1974; Smith et al. 1995; Ko¨rner 1999) or possibly phylogenetic conservatism of habitat (Cornwell and Ackerly 2009). In the context of this study, high SLA and leaf areas at the higher, supposedly more stressful sites appear counterintuitive and are inconsistent with similar studies of leaf traits across growing season and snowmelt gradients (Kudo et al. 1999; Spasojevic and Suding 2012). In the Snowy Mountains, fewer shrubs are present at higher elevations and forbs at high elevations are generally selected to have smaller leaves, although their leaves are generally fleshy and larger than those of the shrubs, hence the patterns in SLA and leaf area across the gradient. However, at the highest wind-swept areas of feldmark, several tough, dwarf, prostrate shrub species are present (such as Epacris and Chionohebe spp.) in an environment where long-lived species are selected for. Large-scale interspecific comparisons have strengthened the idea that SLA is related negatively with leaf life span and positively with relative growth rate (Reich et al. 1999; Wright et al. 2004), a potentially advantageous strategy in harsh climates with short growing seasons. However, a longer snow season at the higher summits in the Snowy Mountains may actually provide more favourable conditions in early spring when plants are protected from early-season frosts and winds, whereas they would be exposed earlier at the lower summits (Inouye et al. 2002; Venn et al. 2012b), which may have caused these unexpected patterns in the CTWM for SLA across the gradient. This is certainly the case around the edges of late-lying snowpatches in the Snowy Mountains, which melt out earlier than the centre of the snowpatch (Venn et al. 2011), and where tough, high fibrous (low SLA) species are more abundant in the early-exposed alpine areas (Choler 2005). Conversely, low LDMC and large leaf areas at higher elevations may be indicative of fast resource acquisition and relatively high productivity, even in areas where growing seasons are short and unpredictable (Kudo et al. 1999). Only a few studies have documented temporal functional diversity or functional composition change in plant communities, with mixed results; but see the review in Dı´az and Cabido (2001). Here, significant differences in the CTWM of several traits between years, but some nonsignificant differences in terms of species composition (from ANOSIM analyses) point to species abundance change, rather than high turnover or increases of new species. These changes are likely attributable to the overall large increases in shrub and graminoid abundance
& The Authors 2014
9
Venn et al. — Functional change in alpine summit vegetation
Table 4. The mean overlapping cover (%) in 2004 and 2011 of the 10 most typical species within each sampling unit and level of replication that contribute to the differences seen in the ordinations and ANOSIM analyses and the contribution (%) of each species to the total species pool in each group, using the SIMPER routine (Primer ver. 6). Sampling unit/replication
Species
Family
Life form
2004 Mean
2011 Mean
Contribution (%)
abundance (%) abundance (%) ............................................................................................................................................................................ Upper SAS/summit aspects Kunzea muelleri Myrtaceae Shrub 3.08 3.44 9.38
Upper SAS/summits
Lower SAS/summit aspects
Lower SAS/summits
Epacris microphylla
Ericaceae
Shrub
3.76
4.24
9.03
Poa sp.
Poaceae
Graminoid
7.4
9.76
8.33
Celmisia costiniana
Asteraceae
Forb
3.72
3.8
5.69
Empodisma minus
Restionaceae
Graminoid
1.6
2
4.88
Phebalium ovatifolium
Rutaceae
Shrub
1.6
1.52
4.6
Grevillea australis
Proteaceae
Shrub
1.8
1.48
4.59
Trisetum spicatum
Poaceae
Graminoid
2.04
1.88
4.45
Prostanthera cuneata
Lamiaceae
Shrub
1.32
1.32
3.85
Microseris lanceolata
Asteraceae
Forb
1.44
1.44
3.75
Kunzea muelleri
Myrtaceae
Shrub
5.24
5.72
7.13
Phebalium ovatifolium
Rutaceae
Shrub
3.8
3.72
4.88
Grevillea australis
Proteaceae
Shrub
4.28
3.48
4.8
Empodisma minus
Restionaceae
Graminoid
4.6
5.44
4.4
Prostanthera cuneata
Lamiaceae
Shrub
3.2
3.56
4.22
Epacris microphylla
Ericaceae
Shrub
8.32
9.68
4.17
Pentachondra pumila
Ericaceae
Shrub
3.16
2.92
4.08
Agrostis sp.
Poaceae
Graminoid
0.04
3.8
4.05
Carex breviculmis
Cyperaceae
Graminoid
Poa sp.
Poaceae
Graminoid
Kunzea muelleri
Myrtaceae
Poa sp.
3.84
4.02
12.64
0
15.68
3.31
Shrub
2.32
2.72
7.85
Poaceae
Graminoid
7.6
9.92
7.6
Celmisia costiniana
Asteraceae
Forb
4.76
4.6
6.72
Epacris microphylla
Ericaceae
Shrub
3.52
4.08
6.24
Phebalium ovatifolium
Rutaceae
Shrub
2.04
1.8
5.57
Empodisma minus
Restionaceae
Graminoid
1.76
1.8
5.01
Grevillea australis
Proteaceae
Shrub
1.92
1.6
4.5
Trisetum spicatum
Poaceae
Graminoid
2.12
2.2
4.31
Pentachondra pumila
Ericaceae
Shrub
1.4
1.6
3.91
Prostanthera cuneata
Lamiaceae
Shrub
1.12
0.96
3.04
Kunzea muelleri
Myrtaceae
Shrub
4.72
5.28
5.82
Phebalium ovatifolium
Rutaceae
Shrub
4.52
3.96
5.25
Empodisma minus
Restionaceae
Graminoid
4.72
4.32
4.62
Grevillea australis
Proteaceae
Shrub
4.56
3.72
4.21
Agrostis sp.
Poaceae
Graminoid
0
3.64
3.76
Carex breviculmis
Cyperaceae
Graminoid
0.12
3.72
3.59
Continued
10
AoB PLANTS www.aobplants.oxfordjournals.org
& The Authors 2014
Venn et al. — Functional change in alpine summit vegetation
Table 4. Continued Sampling unit/replication
Species
Family
Life form
2004 Mean
2011 Mean
Contribution (%)
abundance (%) abundance (%) ............................................................................................................................................................................ Pentachondra pumila Ericaceae Shrub 3.92 4.4 3.51 Epacris microphylla
Ericaceae
Shrub
7.72
9.04
3.02
Luzula alpestris Acetosella vulgaris
Juncaceae
Graminoid
0.04
2.92
2.89
Polygonaceae
Forb
1.16
3.56
2.87
across the gradient, which in turn has consequences for driving overall community assembly processes given the trait-space and life-history strategies of these broad lifeform groups (Dı´az and Cabido 2001; Westoby et al. 2002). Although temperatures did not change significantly over the study period, precipitation did. The recent spikes in precipitation, however, are unlikely to have caused the patterns observed in the functional composition in this study; instead these may be realized in the subsequent 1 – 2 growing seasons as the herbaceous vegetation responds to the additional rainfall after many years of drought conditions.
Community composition and ecology across the environmental gradient Our analysis of functional patterns from leaf traits may be used to help describe the mechanisms driving community composition across this elevation gradient of summits (McGill et al. 2006). Overall, species have sorted themselves preferentially across the gradient, most likely as a result of abiotic filtering (Venn et al. 2011), the harsh conditions at the higher summits compared with the lower summits, and possibly through the additional implications of biotic interactions. Both interaction types are ultimately predetermined by species’ inherent functional traits and the functional trait space that each species occupies (Dı´az and Cabido 2001). Whereas a significant change in the CTWM across the gradient for a specific trait could indicate a threshold for an abiotic filter, it could also be due in part to biotic filtering, where positive or negative interactions between plants interact with environmental factors preferentially across a gradient to either constrain or facilitate species with certain traits or trait combinations (Scho¨b et al. 2012; Spasojevic and Suding 2012). Although we did not formally address the issue of intraspecific trait variation in this study, we noted that there is little variation in the traits measured within species across the gradient of sites; rather most of the variation in plant traits across the gradient comes from the variation in species abundances, as demonstrated by the
AoB PLANTS www.aobplants.oxfordjournals.org
CTWM. Across gradients such as this one, there is an expectation that the CTWM of each trait will be a reflection of a gradient of abiotic stress: higher at the higherelevation summits and lower at the lower-elevation summits. Conversely, the CTWM for certain traits might reflect some overriding biotic interactions which ameliorate stressful abiotic conditions as per the stress-gradient hypothesis (Bertness and Callaway 1994; Kikvidze et al. 2006): in areas where abiotic stress is low and negative biotic interactions (competition) are expected (at the lower-elevation summits: higher temperatures, longer growing seasons) (Callaway et al. 2002; Cornwell and Ackerly 2009; Venn et al. 2009). This may explain the patterns in two of the four traits considered (the high CTWM values for SLA and leaf area), indicating that biotic filtering likely due to facilitation may be operating at the higher-elevation summits, allowing for relatively high productivity. Further experimental work in situ including measures of below-ground plant interactions will be necessary to unravel the interacting effects of biotic and abiotic filtering (Wilson 1993) at these sites. At the lower summits, we observed relatively higher values in the CTWM for plant height and LDMC, strongly driven by the high proportion of shrub and graminoid species. A high proportion of these species can indicate fast and high biomass accumulation, lateral spread and competitive superiority (Westoby et al. 2002; Cornelissen et al. 2003), as well as leading to increases in soil organic matter and available nitrogen (Myers-Smith et al. 2011; Vankoughnett and Grogan 2013). Here, plants may also be less constrained by (relatively) harsh conditions, but biotic filtering such as competition may override other assembly processes. Trade-offs between an energy-efficient strategy for nutrient conservation, with a high capacity for resource acquisition under harsh conditions, will likely drive future shifts in functional traits and species composition across the gradient (Choler 2005). However, the interaction between abiotic filters (such as growing season length and variability) and biotic filters will ultimately determine whether short-term temporal shifts in species
& The Authors 2014
11
Venn et al. — Functional change in alpine summit vegetation
Figure 3. The CTWM + 95 % confidence intervals for the four functional traits, plant height, leaf area, LDMC and SLA, based on species abundance in the upper and lower SASs. 2004 data ¼ closed circles, 2011 data ¼ open circles. Simple linear relationships (using all site aspect data) between site elevation and CTWM values are only displayed for R 2 ≥ 0.5 and P , 0.05.
composition will eventually manifest as significant changes to observational trait patterns and ecosystem functioning in the long term. In the short term, the
12
AoB PLANTS www.aobplants.oxfordjournals.org
herbaceous species with high SLA and high productivity at high elevations must continue to ‘hold their ground’. However, the relatively tall graminoids and shrubs, with
& The Authors 2014
Venn et al. — Functional change in alpine summit vegetation
thick, tough leaves (low SLA) that dominate the lower summit areas and at lower elevations more generally, are likely to maintain their dominance, increase in abundance and out-compete other life forms in the local species pool.
Chapin FS III, Bret-Harte MS, Hobbie SE, Zhong H. 1996. Plant functional traits as predictors of transient responsers of Arctic vegetation to global change. Journal of Vegetation Science 7: 347 –358.
Sources of Funding
Clarke KR. 1993. Non-parametric multivariate analysis of changes in community structure. Australian Journal of Ecology 18:117 – 143.
Australian Alps Liaison Committee, the New South Wales National Parks and Wildlife Service, the Australian Government and the partners in the National Climate Change Adaptation Research Facility (NCCARF) consortium.
Cornelissen JHC, Lavorel S, Garnier E, Dı´az S, Buchmann N, Gurvich DE, Reich PB, ter Steege H, Morgan HD, van der Heijden MGA, Pausas JG, Poorter H. 2003. A handbook of protocols for standardised and easy measurement of plant functional traits worldwide. Australian Journal of Botany 51:335 – 380.
Contributions by the Authors S.V. was involved in securing funding, data collection, data analysis and manuscript preparation. C.P. and K.G. were involved in securing funding, data collection and editing the manuscript.
Conflicts of Interest Statement None declared.
Acknowledgements This work was supported financially by the Australian Alps Liaison Committee, the New South Wales National Parks and Wildlife Service, the Australian Government and the partners in the National Climate Change Adaptation Research Facility (NCCARF) consortium. The views expressed herein are not necessarily those of the Commonwealth of Australia, and the Commonwealth does not accept responsibility for any information or advice contained herein. Sarah Butler, Nicole Beutel, Rochelle Steven and Craig Hyde assisted with fieldwork. We dedicate this paper to Dr Michael Gottfried in recognition of his outstanding research in alpine plant ecology and commitment to the GLORIA project, without which this work would not have been undertaken.
Literature Cited Bertness M, Callaway RM. 1994. Positive interactions in communities. Trends in Ecology and Evolution 9:191 – 193. Bray RJ, Curtis JT. 1957. An ordination of the upland forest communities of Southern Wisconsin. Ecological Monographs 27: 325 –349. Caldwell MM, Tieszen LL, Fareed M. 1974. The canopy structure of tundra plant communities at Barrow, Alaska, and Niwot Ridge, Colorado. Arctic and Alpine Research 6:151 – 159. Callaway RM, Brooker RW, Choler P, Kikvidze Z, Lortie CJ, Newingham B, Aschehoug ET, Armas C, Kikodze D, Cook BJ. 2002. Positive interactions among alpine plants increase with stress. Nature 417:844 –848.
AoB PLANTS www.aobplants.oxfordjournals.org
Choler P. 2005. Consistent shifts in alpine plant traits along a mesotopographical gradient. Arctic, Antarctic and Alpine Research 37: 444 –453.
Cornwell WK, Ackerly DD. 2009. Community assembly and shifts in plant trait distributions across an environmental gradient in coastal California. Ecological Monographs 79:109 – 126. Costin AB. 1954. A study of the ecosystems of the Monaro region of New South Wales with special reference to soil erosion. Sydney: Soil Conservation Service of New South Wales. Costin AB, Gray M, Totterdell CJ, Wimbush DJ. 2000. Kosciuszko alpine flora. Melbourne: CSIRO. Cumming G, Finch S. 2005. Inference by eye—confidence intervals and how to read pictures of data. American Psychologist 60: 170 –180. Dı´az S, Cabido M. 1997. Plant functional types and ecosystem function in relation to global change. Journal of Vegetation Science 8: 463 –474. Dı´az S, Cabido M. 2001. Vive la diffe´rence: plant functional diversity matters to ecosystem processes. Trends in Ecology & Evolution 16:646 – 655. Grime JP. 1977. Evidence for the existence of three primary strategies in plants and its relevance to ecological and evolutionary theory. American Naturalist 111:1169 –1194. Groves RH. 1994. Australian vegetation, 2nd edn. UK: Cambridge University Press. Hooper DM, Vitousek PM. 1997. The effects of plant composition and diversity on ecosystem processes. Science 277:1302 –1305. Inouye DW, Morales MA, Dodge GJ. 2002. Variation in timing and abundance of flowering by Delphinium barbeyi Huth (Ranunculaceae): the roles of snowpack, frost, and La Nina, in the context of climate change. Oecologia 130:543 – 550. Jarrad FC, Wahren C-H, Williams RJ, Burgman MA. 2009. Impacts of experimental warming and fire on phenology of subalpine openheath species. Australian Journal of Botany 56:617 –629. Kikvidze Z, Khetsuriana L, Kikodze D, Callaway RM. 2006. Seasonal shifts in competition and facilitation in subalpine plant communities of the central Caucasus. Journal of Vegetation Science 17: 77 – 82. Ko¨rner C. 1999. Alpine plant life. Berlin: Springer. Kruskal JB. 1964. Nonmetric multidimensional scaling: a numerical method. Psychometrika 29:115 –129. Kudo G, Nordenha¨ll U, Molau U. 1999. Effects of snowmelt timing on leaf traits, leaf production, and shoot growth of alpine plants: comparisons along a snowmelt gradient in northern Sweden. Ecoscience 6:439 – 450. Lavorel S, Garnier E. 2002. Predicting changes in community composition and ecosystem functioning from plant traits. Functional Ecology 16:545 –546.
& The Authors 2014
13
Venn et al. — Functional change in alpine summit vegetation
Lepsˇ J, de Bello F. 2008. Macro for calculation of functional diversity. Czech Republic: University of South Bohemia. http://botanika.bf. jcu.cz/suspa/FunctDiv.php (1 July 2013). Lepsˇ J, de Bello F, Lavorel S, Berman S. 2006. Quantifying and interpreting functional diversity of natural communities: practical considerations matter. Preslia 78:481 –501. Mason NWH, MacGillivray K, Steel JB, Wilson JB. 2003. An index of functional diversity. Journal of Vegetation Science 14: 571 –578. Mason NWH, Mouillot D, Lee WG, Wilson JB. 2005. Functional richness, functional evenness and functional divergence: the primary components of functional diversity. Oikos 111: 112 –118. Mason NWH, Richardson SJ, Peltzer DA, de Bello F, Wardle DA, Allen RB. 2012. Changes in coexistence mechanisms along a long-term soil chronosequence revealed by functional trait diversity. Journal of Ecology 100:678 –689. McCune B, Mefford MJ. 1999. PC-ORD for Windows. Multivariate analysis of ecological data, Version 4.25 edn. Gleneden Beach, OR, USA: MjM Software. McGill BJ, Enquist BJ, Weiher E, Westoby M. 2006. Rebuilding community ecology from functional traits. Trends in Ecology & Evolution 21:178 – 185. Michalet R, Scho¨b C, Lortie CJ, Brooker RW, Callaway RM. 2014. Partitioning net interactions among plants along altitudinal gradients to study community responses to climate change. Functional Ecology 28:75– 86. Myers-Smith IH, Forbes BC, Wilmking M, Hallinger M, Lantz T, Blok D, Tape KD, Macias-Fauria M, Sass-Klaassen U, Le´vesque E, Boudreau S, Ropars P, Hermanutz L, Trant A, Siegwart Collier L, Weijers S, Rozema J, Rayback SA, Schmidt NM, SchaepmanStrub G, Wipf S, Rixen C, Me´nard CB, Venn S, Goetz S, Andreu-Hayles LA, Elmendorf S, Ravolainen V, Welker J, Grogan P, Epstein HE, Hik DS. 2011. Shrub expansion in tundra ecosystems: dynamics, impacts and research priorities. Environmental Research Letters 6:045509. Pauli H, Gottfried M, Hohenwallner D, Reiter K, Casale R, Grabherr G. 2004. The GLORIA field manual—multi-summit approach. Luxembourg: European Commission. Pauli H, Gottfried M, Hohenwallner D, Reiter K, Grabherr G. 2011. The GLORIA field manual multi-summit approach. Global Observation Research Initiative in Alpine Environments—a contribution to the Global Terrestrial Observing System (GTOS). Vienna: GLORIA co-ordination, Institute of Ecology and Conservation Biology, University of Vienna. Petchey OL, Gaston KJ. 2006. Functional diversity: back to basics and looking forward. Ecology Letters 9:741 – 758. Pickering CM, Green K. 2009. Vascular plant distribution in relation to topography, soils and micro-climate at five GLORIA sites in the Snowy Mountains, Australia. Australian Journal of Botany 57: 189 –199.
Reich PB, Ellsworth DS, Walters MB. 1999. Generality of leaf trait relationships: a test across six biomes. Ecology 80:1955 – 1969. Scho¨b C, Butterfield BJ, Pugnaire FI. 2012. Foundation species influence trait-based community assembly. New Phytologist 196: 824 –834. Smith B, Mark AF, Wilson JB. 1995. A functional analysis of New Zealand alpine vegetation: variation in canopy roughness and functional diversity in response to an experimental wind barrier. Functional Ecology 9:904 – 912. Spasojevic MJ, Suding KN. 2012. Inferring community assembly mechanisms from functional diversity patterns: the importance of multiple assembly processes. Journal of Ecology 100: 652 –661. Tilman D, Knops J, Wedin D, Reich P, Ritchie M, Siemann E. 1997. The influence of functional diversity and composition on ecosystem processes. Science 277:1300 – 1302. Tilman D, Reich PB, Knops J, Wedin D, Mielke T, Lehman C. 2001. Diversity and productivity in a long-term grassland experiment. Science 294: 843 – 845. Tranquillini W. 1964. The physiology of plants at high altitude. Annual Review of Plant Physiology and Plant Molecular Biology 15: 121 –128. Vankoughnett MR, Grogan P. 2013. Nitrogen isotope tracer acquisition in low and tall birch tundra plant communities: a 2 year test of the snow – shrub hypothesis. Biogeochemistry. doi:10.1007/s10533-013-9930-5. Venn SE. 2007. Plant recruitment across alpine summits in southeastern Australia. PhD Thesis, La Trobe University, Bundoora. Venn SE, Morgan JW. 2005. Patterns in alpine vegetation across an altitudinal gradient in Victoria, Australia: an example of ‘space for time substitution’ in order to assess the potential effects of climate change. In: Price MF, ed. Global change in mountain regions. Duncow, UK: Sapiens Publishing, 165 –166. Venn SE, Morgan JW, Green PT. 2009. Do facilitative interactions with neighboring plants assist the growth of seedlings at high altitudes in alpine Australia? Arctic, Antarctic and Alpine Research 41:381 – 387. Venn SE, Green K, Pickering CM, Morgan JM. 2011. Using plant functional traits to explain community composition across a strong environmental filter in Australian alpine snowpatches. Plant Ecology 212:1491 – 1499. Venn SE, Pickering CM, Green K. 2012a. Short-term variation in species richness across an altitudinal gradient of alpine summits. Biodiversity and Conservation 21:3157 – 3186. Venn SE, Morgan JW, Lord JM. 2012b. Foliar freezing resistance of Australian alpine plants over the growing season. Austral Ecology 38:152 – 161.
Pickering CM, Hill W, Green K. 2008. Vascular plant diversity and climate change in the alpine zone of the Snowy Mountains, Australia. Biodiversity and Conservation 17:1627 – 1644.
Villeger S, Mason NWH, Mouillot D. 2008. New multidimensional functional diversity indices for a multifaceted framework in functional ecology. Ecology 89:2290 – 2301.
Pollock LJ, Morris WM, Vesk PA. 2012. The role of functional traits in species distributions revealed through a hierarchical model. Ecography 35:716 – 725.
Vittoz P, Bayfield N, Brooker R, Elston DA, Duff EI, Theurillat J-P, Guisan A. 2010. Reproducibility of species lists, visual cover estimates and frequency methods for recording highmountain vegetation. Journal of Vegetation Science 21: 1035 – 1047.
Quinn GP, Keough MJ. 2003. Experimental design and data analysis for biologists. Port Melbourne: Cambridge University Press.
14
Reich PB, Walters MB, Ellsworth DS. 1997. From tropics to tundra: global convergence in plant functioning. Proceedings of the National Academy of Sciences of the USA 94:13730 –13734.
AoB PLANTS www.aobplants.oxfordjournals.org
& The Authors 2014
Venn et al. — Functional change in alpine summit vegetation
Weiher E, van der Werf A, Thompson K, Roderick M, Garnier E, Eriksson O. 1999. Challenging Theophrastus: a common core list of plant traits for functional ecology. Journal of Vegetation Science 10:609 –620. Westoby M. 1998. A leaf– height – seed (LHS) plant ecology strategy scheme. Plant and Soil 199:213 – 227. Westoby M, Wright IJ. 2006. Land – plant ecology on the basis of functional traits. Trends in Ecology & Evolution 21: 261 –268. Westoby M, Falster DS, Moles AT, Vesk PA, Wright IJ. 2002. Plant ecological strategies: some leading dimensions of variation between species. Annual Review of Ecology and Systematics 33: 125 –159.
AoB PLANTS www.aobplants.oxfordjournals.org
Williams RJ, Ashton DH. 1988. Cyclical patterns of regeneration in the subalpine heathland communities on the Bogong High Plains, Victoria. Australian Journal of Botany 36:605 – 619. Wilson SD. 1993. Competition and resource availability in heath and grassland in the Snowy Mountains of Australia. Journal of Ecology 81:445 – 451. Wright IJ, Reich PB, Westoby M, Ackerly DD, Baruch Z, Bongers F, Cavender-Bares J, Chapin T, Cornelissen JHC, Diemer M, Flexas J, Garnier E, Groom PK, Gulias J, Hikosaka K, Lamont BB, Lee T, Lee W, Lusk C, Midgley JJ, Navas M, Niinemets U, Oleksyn J, Osada N, Poorter H, Poot P, Prior L, Pyankov VI, Roumet C, Thomas SC, Tjoelker MG, Veneklaas EJ, Villar R. 2004. The worldwide leaf economics spectrum. Nature 428:821–827.
& The Authors 2014
15