Journal of Engineering Science and Technology Vol. 12, No. 12 (2017) 3136 - 3147 © School of Engineering, Taylor’s University
GEOTECHNICAL PROPERTIES OF SANDY SOIL CONTAMINATED WITH INDUSTRIAL WASTEWATER MAHDI O. KARKUSH*, DERGHAM A. RESOL Department of Civil Engineering, College of Engineering, University of Baghdad Aljadriah, Baghdad, Iraq *Corresponding Author:
[email protected]
Abstract The present work is devoted for studying the geotechnical and chemical properties of intact and contaminated sandy soil samples. The soil samples were obtained from Al-Kufa city that is located in the south-west of Iraq. The contaminant is a by-product industrial wastewater disposed from the refinery that supplies fuel for the thermal electricity power plant. The intact sandy soil samples were contaminated in the laboratory with four percentages of 10, 20, 40 and 100% of the weight of distilled water used in the soaking process and the soaking process continued for thirty days. The results of tests showed a slight increase in both liquid limit and particle size and a significant increase in the optimum moisture content with increasing the percentages of the contaminant. However, with increasing the percentages of the contaminant, there was a slight decrease in the specific gravity and maximum dry unit weight. In addition, there was a considerable decrease in the angle of internal friction and the coefficient of permeability. The angle of internal friction of contaminated soil samples decreased by 18 to 26% with increasing the contaminant percentage from 10 to 100%. The cohesion of soil samples decreased by 7 to 33% with increasing the contaminant percentage, this conclusion is limited to the soil samples contaminated with 10, 20 and 40%, but the cohesion of soil sample contaminated with 100 % of industrial wastewater increased by 7%. Keywords: Industrial wastewater, Soil contamination, Sandy soil, Geotechnical properties.
1. Introduction Commercial and industrial activities produce solid and toxic chemical wastes, which are disposed in rivers and/or directly to the soil causing the contamination of soil. The human activities produce diverse residues called wastes; these wastes differ in 3136
Geotechnical Properties of Sandy Soil Contaminated with Industrial . . . . 3137
Nomenclatures c cc CL Cp cr Einitial G Gs k LL NP PI PL pH SG SM SP
Cohesion of soil, kPa Compression index Low plasticity clay Collapse potential Recompression index Modulus of elasticity of soil, MPa Shear modulus of soil, MPa Specific gravity Coefficient of permeability, m/s Liquid limit, % Non-plastic Plasticity index, % Plastic limit, % Hydrogen-ion activity Specific gravity of petroleum liquid Silty sand soil Poorly graded sand
Greek Symbols γd,max Maximum dry unit weight, kN/m3 γPL Unit weight of petroleum liquid, kN/m3 γw Unit weight of water, kN/m3 φ Angle of internal friction, deg. ωopt Optimum moisture content, % Abbreviations API ASTM BS DST EPA TDS UUT
American Petroleum Institute American Society for Testing and Materials British standards Direct shear test Environment Protection Agency Total dissolved solids Unconsolidated undrained triaxial test
terms of quantity and quality from one place to another depending on the degree of urbanization of that place. Therefore, geoenvironmental engineering is devoted for studying the diverse effects of wastes on the geotechnical properties of soil and groundwater [1-3]. Deane et al. [4] studied the transport and fate of hydrophobic organic chemicals (HOCs) in consolidated sediments and saturated soils by conducting long-term one-dimensional diffusion experiments and numerical modeling to verify the experimental work results. The results demonstrated that the HOCs in the consolidated sediments are far from a steadystate chemical equilibrium. Shin et al. [5] studied the effects of crude oil contamination on the shear strength parameters of sandy soil and the ultimate bearing capacity of a shallow strip footing founded on it. The results indicated a decrease in the angle of internal friction by 25% and a decrease in the bearing capacity of 75% when the crude oil content increases from zero to 1.3%. Saikia and Goswami [6] studied the effects of industrial effluents on the geotechnical
Journal of Engineering Science and Technology
December 2017, Vol. 12(12)
3138
M. O. Karkush and D. A. Resol
properties of intact soil samples. Based on the test results, they concluded the following points: (i) decreasing of LL and PL of soils contaminated with crude oil and soap factory waste. However, opposite trends were observed for soils contaminated with paper and pharmaceutical effluent; (ii) there was an increase in the compression index; (iii) shear strength decreased slightly due to paper mill contamination, and (iv) coefficient of permeability was increased for all soils. Khamehchiyan et al. [7] examined the effects of crude oil contaminant on the geotechnical properties of three types of soil (CL, SP, and SM). The soil samples were contaminated by mixing the soils with four percentages of crude oil (4, 8, 12 and 16) % by weight of dry soil samples. The results of the study showed a nonuniform effect of the crude oil on the shear strength parameters and it depends on the type of soil. Gratchev and Towhata [8] studied the effects of acidic contamination on the geotechnical properties of soils obtained from marine deposits. The results of the study showed that, the factors determining the degree of such changes are clay mineralogy, soil structure, and the duration of the clayacid interaction. Karkush et al. [9] studied the effects of four types of contaminants on the geotechnical properties of clayey soil samples. The soil samples were contaminated in the laboratory with two percentages (10 and 25) % of kerosene, ammonium hydroxide, lead nitrate, and copper sulfate. The results of the study showed the following conclusions with increasing the percentage of contaminants; (i) increasing LL and PL; (ii) increasing the maximum dry density and initial void ratio; (iii) increasing cc, cr, and Cp; and (iv) decreasing the specific gravity, optimum moisture content and cohesion. Karkush and Abdul Kareem [10] studied the effects of industrial wastewater on the geotechnical properties of a clayey soil sample. The soil samples were contaminated with four percentages of industrial wastewater (10, 20, 40 and 100) % of solution used in the soaking process, which continued for 30 days. The results showed diverse effects for the industrial wastewater on the geotechnical properties of a clayey soil samples. In Iraq, increasing the untreated industrial wastewater resulting from different industrial activities, especially oil industry that is released to the soil or surface water immensely impacts the environment. The present study devoted to determine the impacts of industrial wastewater that is a by-product disposed from the refinery supplied the fuel for an electrical power plant on the geotechnical properties of sandy soil by conducting an efficient laboratory-testing program on both intact soil and soil samples contaminated with different percentages of industrial wastewater.
2. Soil Contamination The development of modern life mainly depends on the development of industrial activities. This development accompanied with increasing the quality and quantity of wastes which leads to large risk of soil contamination. Soil contamination cannot be caused by municipal and industrial contamination sources only, but also by agricultural measures such as pesticides, chemical fertilizers, animal and poultry excrement's, sludge application on agricultural land, etc. Heavy metals are considered the most harmful contaminants on the physical and mechanical properties of soil depending on the chemical activity and mobility of contaminant in the soil [11]. Most of the wastes are disposed from important industries such as cement, metallurgical, petrochemicals, textiles, food, chemical, and pharmaceutical Journal of Engineering Science and Technology
December 2017, Vol. 12(12)
Geotechnical Properties of Sandy Soil Contaminated with Industrial . . . . 3139
industries. They are also a major contributor to the country’s solid waste problem. In Iraq, many industries have no contaminant release control. Old technology of production process results in the inefficient utilization of natural resources and raw materials and is a significant source of contamination [12]. The wastes can be classified according to the source of generation into two main categories that are municipal wastes and industrial wastes. Municipal wastes are wastes produced from commercial activities, educational establishments, residential units, health facilities, cleaning streets, gardens, hotels, and recreational areas. It also covers waste of small factories and camps. Municipal waste is comprised of a relatively high percentage of organic matter. The municipal wastes may contain some hazardous materials such as chemicals, paints, drug residues, expired medicines, household insecticides, used batteries, electrical, and electronic equipment [1-3]. Industrial wastes resulting from industrial activities contain ingredients; scrap metals, trash, oil, solvents, chemicals, and others. Industrial waste, which may be solid, liquid or gasses held in containers. Nonhazardous industrial wastes are those that do not meet the EPA's definition of hazardous waste and are not municipal waste. If improperly managed, this waste can pose dangerous to the health and environmental consequences and that may affect negatively the geotechnical properties of soil [1-3]. One of the major sources of industrial wastes is the electricity power plants.
3. Experimental Work The soil samples used in this work are obtained from Al-Kufa city in Al-Najaf governorate located in the south-west of Iraq. The soil of study area is mostly sandy soil with a low percentage of organic matter [13]. Also, the groundwater table ranged from 2 to 2.5 m from existing ground level. The soil samples were obtained from a depth equal to 1.75m which is above the groundwater table by using hand drilling. The soil samples were contaminated in the laboratory with four percentages of industrial wastewater (10, 20, 40 and 100) % by weight of the distilled water used in the soaking process. The industrial wastewater used in the present work is a by-product disposed from the refinery that supplies fuel to the Al-Musyib electricity power plant in the north of Babylon governorate. The density and chemical composition of the contaminant are given in Table 1. Table 1. Chemical analysis of contaminant. Density kg/m3
pH
1001.3
2.65
Mineral Na NO3 SO3 Cl-1 Ca Mg
Concentration % Mineral 0.0228 K 0.0200 Zn 0.1172 Cr 0.0180 Ni 0.2101 Fe 0.0040 ALK
% 0.00841 0.0071 0.0001 0.0002 0.1517 0.0
Four soil samples were tested in this study. The contamination process of soil consists of putting a 90 kg of disturbed soil sample in a plastic container of dimensions 100×100×100 cm and covered with 60 kg of contamination solution. So, the contamination solution consists of distilled water and industrial wastewater.
Journal of Engineering Science and Technology
December 2017, Vol. 12(12)
3140
M. O. Karkush and D. A. Resol
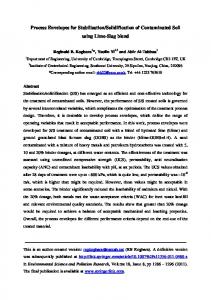
The soil samples tested in the present study were designated as follows: k0 is the intact soil sample; k1 is the soil sample contaminated with 90% of distilled water and 10% of industrial wastewater; k2 is the soil sample contaminated with 80% of distilled water and 20% of industrial wastewater; and k3 is the soil sample contaminated with 60% of distilled water and 40% of industrial wastewater; while k4 is the soil sample contaminated with 100% of industrial wastewater. The soil samples were soaked in contamination solutions for 30 days in plastic covered container as shown in Fig. 1.
Fig. 1. Soil sample soaking process. The distilled water used in the contamination solution to get the sufficient quantity of solution, which is enough to cover the soil sample and to help the industrial wastewater to infiltrate the soil mass. According to ASTM D278, the API gravity of industrial wastewater is equal to 9.53 degree; therefore the contaminant is considered heavy oil [14].
API Gravity , deg ree
141.5 131.5 SG
(1)
where SG is the specific gravity of petroleum liquid.
SG
PL w
(2)
where PL is the unit weight of petroleum liquid and
w
is the unit weight of
water at the same temperature. The physical tests include particle-size distribution, Atterberg's limits, water content, specific gravity, permeability, maximum dry unit weight and optimum moisture content are measured according to the ASTM and BS. The mechanical tests include measuring the compression properties and shear strength parameters through conducting the 1-D compression test, DST, and the UUT. These tests were conducted according to ASTM. In DST, the applied rate of strain was 0.002 mm/min, while in UUT; the applied rate of strain was 0.002 mm/min [14-18]. The Journal of Engineering Science and Technology
December 2017, Vol. 12(12)
Geotechnical Properties of Sandy Soil Contaminated with Industrial . . . . 3141
chemical composition of soil is important to determine the behavior of soil, especially when subjected to contaminants. Also, x-ray diffraction tests were conducted on soil samples to understand the effects of contamination on the mineralogical composition of soil samples. The chemical tests and x-ray diffractions tests include measuring the organic matter (ASTM D2974); chloride content (ASTM D512 A); sulfur trioxide (ASTM D516) and pH value (ASTM D4972). The concentrations of heavy metals (Zn, Cr, Ni, Pb, and Fe) were measured by using the Atomic Absorption Spectrometer Techniques (AA500) [14].
4. Results and Discussion From the results of chemical tests, the industrial wastewater is a strongly acidic solution with a pH value equal to 2.65 that will affect negatively the geotechnical properties of soil. The pH of soil will decrease as contaminant percentage increases because the intact soil has the alkaline property of pH > 7 as shown in Table 2. Table 2. Chemical analysis of contaminated soil samples. Concentration % SO3 Cl-1 CaO TDS Gypsum Na Zn Cr Ni Cd K Fe OM pH (unitless)
k0 2.48000 0.07000 1.74000 4.62000 4.78128 0.00087 0.00035 0.00141 0.00002 0.00040 0.00085 0.11430 0.29000 8.80000
k1 2.6022 0.0700 1.8200 4.82000 5.01786 0.00093 0.00037 0.00144 0.00002 0.00040 0.00094 0.11700 0.11600 8.67000
Soil Samples k2 k3 2.63000 2.64770 0.07000 0.07000 1.94000 1.67000 4.90760 4.98580 5.07168 5.10587 0.00103 0.00120 0.00044 0.00046 0.00152 0.00157 0.00002 0.00002 0.00040 0.00040 0.00098 0.00102 0.12340 0.12570 0.13000 0.15400 8.40000 8.35000
k4 2.67820 0.07000 1.45000 7.30310 5.16501 0.00143 0.00049 0.00168 0.00002 0.00040 0.00116 0.12960 0.15300 8.30000
Increasing the contaminant percentage has no recognized change in the percentage of lead, copper, magnesium. These heavy metals are not active enough with water to convert water to hydrogen gas and hydroxide ions unless the water is steam or very hot. However, these metals are reactive enough to convert H+ ions into hydrogen gas (H2). Moreover, the metal ions (such as Zn+2) do not react with water or H+ ions. Also, there was no change in the concentrations of chloride and nickel due to the low percentage of chloride in both intact soil and industrial wastewater [19, 20]. Increasing the percentage of contaminant causes a gradual increase in the concentration of sodium (Na) and iron metal (Fe) in the contaminated soil samples. The percentage of the total dissolved solids (TDS) increased with increasing the percentage of contaminants, which results from the grinding of soil particles. The contaminant causes increasing the concentration of sulfur trioxide and gypsum content in the soil samples. The calcium oxide ions Journal of Engineering Science and Technology
December 2017, Vol. 12(12)
3142
M. O. Karkush and D. A. Resol
increased initially when soil was contaminated with 10% and 20% of industrial wastewater and then started to decrease in the soil samples contaminated with 40% and 100% of industrial wastewater. This reduction depends on the sulfate ions participation in new reaction with soil mineral [21, 22]. The x-ray diffraction analysis is a method used to investigate the crystal structure of clay minerals and non-clay materials. This is test achieved by x-rays of known wavelength passing through the soil specimen. The d-spacing of minerals, which is the distance between different planes of atoms in the crystal lattice have shown major reflections at 3.340, 3.032 and 4.252 Ǻ. This data reveals the presence of quartz, calcite, and orthoclase. In contaminated soil samples, the x-ray diffraction tests markedly showed a decrease in the d-spacing due to increasing the percentage of contaminant. This decrease results from the grinding of the outer surface of grains due to the effect of the high acidic action of industrial wastewater on the weak and thin layers that covers the surfaces of grains. The results of particle–size distribution, specific gravity, Atterberg’s limits and hydraulic conductivity are given in Table 3. The particles of soil samples become finer after contamination that is either due to the effect of acidic contaminant that causes corrosion of the grains surface during the soaking period or due to the dissolution of the organic matter and salts in soil samples leading to the production of finer particles. In addition, it depends on the solubility of salts in distilled water. Table 3. Physical properties of soil Samples. Property Soil Sample k0 k1 k2 k3 1.97 1.67 1.68 1.33 Gravel, % 97.41 97 96.97 97.28 Sand, % 0.61 1.33 1.35 1.39 Fines, % 2.64 2.62 2.61 2.61 Gs 15 15 17 18 LL, % NP NP NP NP PL, % 10.4 8.91 6.66 4.78 k × 10-6, m/s
k4 1.27 97.33 1.4 2.61 21 NP 4.18
The specific gravity decreases with increasing the percentage of contamination for a specific value of contamination percentage, then becomes constant. This action is due to the low density of the industrial wastewater used in the contamination of soil samples. The contaminant causes an increase in the liquid limit due to the decrease in sizes of soil particles, which causes increasing the surface area of solid particles and required additional water to allow the soil start to flow. On the contrary, no plastic limit can be measured in the soil samples due to the non-cohesive property of soil used in this study. The increase in the percentage of contamination causes a significant decrease in the hydraulic conductivity of contaminated soil samples. This reduction is resulted from increasing the fine particles and growing the cementation between soil particles. The results of standard and modified compaction tests are given in Table 4. The compacted density depends on the composition energy, moisture content, particle shape, particle size, and nature of cations present in the soil. The results of tests indicated decreasing the maximum dry unit weight with increasing the percentage of contaminant in the soil. During the soaking process, a black lightweight material generated at the surface of the soil, which resulted from the chemical reaction Journal of Engineering Science and Technology
December 2017, Vol. 12(12)
Geotechnical Properties of Sandy Soil Contaminated with Industrial . . . . 3143
between soil sample and contaminant or due to corrosion of a weak surface layer of soil particle. The dissolution of salt covered the soil particles causes decreasing the maximum dry unit weight. Table 4. Results of compaction tests on soil samples. Modified Proctor Test γd,max ωopt kN/m3 % 19.85 8.73 19.62 8.11 19.5 8.36 19.42 8.78 19.3 9.14
Soil Sample k0 k1 k2 k3 k4
Standard Proctor Test γd,max ωopt kN/m3 % 19.6 9.76 19.16 9.48 19.05 9.83 18.84 10.40 18.8 10.66
The effects of different percentages of industrial wastewater on the mechanical properties of soil samples are presented in Table 5. The modulus of elasticity (Einitial) and shear modulus (G) are determined from the 1-D compression test. Shear strength parameters, cohesion (c) and angle of internal friction (ϕ) are determined from DST and UUT. In DST, the shear strength parameters were calculated at normal stress levels of 28, 56, and 112 kPa. The modulus of elasticity decreases slightly with increasing the percentage of contaminant, this is may be due to the effects of contaminant on the physical properties of soil samples, but after adding 20% of contaminant, the modulus of elasticity becomes constant. The variation of shearing stress with horizontal displacement for soil samples tested by direct shear tests is shown in Figs. 2 to 6. The cohesion of soil samples decreases at 10% of contaminant, then slightly decreases at 20% of contaminant and then increases to values reaching that of intact soil when the soil samples contaminated with 40 and 100% of industrial wastewater. The angle of internal friction decreases significantly when soil sample contaminated with 10% of industrial wastewater, but a slight decrease was noticed after this percentage of contamination as shown in Table 5. This behavior is due to the corrosion of soil particles, which become finer and the angularity of soil particles is reduced more than that of the intact soil. According to the results obtained from tests, there was a slight decrease in soil sample k1 and a significant gradual increase in the cohesion value of soil samples k2, k3 and k4 due to increasing the percentage of fine particles in the soil samples. This reduction had resulted from the dissolution of salts which causes break down the bands between soil particles [19]. Table 5. Results of DST and UUT of soil samples. Soil Sample
Einitial MPa
G MPa
k0 k1 k2 k3 k4
23 23 22 20 20
8.7 9.0 8.4 7.6 7.8
DST c kPa 27 18 19 25 29
Journal of Engineering Science and Technology
ϕ degree 39 32 30 30 29
UUT c kPa 15.55 15.35 16.58 18.45 24.71
December 2017, Vol. 12(12)
3144
M. O. Karkush and D. A. Resol
120
k0
Shearing Stress (kPa)
100 80 60 40
ـــــϭⁿ=112 kPa ـــــϭⁿ=56 kPa ـــــϭⁿ=28 kPa
20 0 0
1
2 Displacement (mm)
3
4
Fig. 2. Shearing stress versus horizontal displacement of soil sample k0. 120
k1
Shearing Stress (kPa)
100
ـــــϭⁿ=112 kPa ـــــϭⁿ=56 kPa ـــــϭⁿ=28 kPa
80 60 40 20 0 0
1
2 Displacement (mm)
3
4
Fig. 3. Shearing stress versus horizontal displacement of soil sample k1. 120
k2
Shearing Stress (kPa)
100 80 60 40
ـــــϭⁿ=112 kPa ـــــϭⁿ=56 kPa ـــــϭⁿ=28 kPa
20 0 0
1
2 Displacement (mm)
Journal of Engineering Science and Technology
3
4
December 2017, Vol. 12(12)
Geotechnical Properties of Sandy Soil Contaminated with Industrial . . . . 3145
Fig. 4. Shearing stress versus horizontal displacement of soil sample k2. 120
k3 Shearing Stress (kPa)
100 80 60 40 ـــــϭⁿ=112 kPa ـــــϭⁿ=56 kPa ـــــϭⁿ=28 kPa
20 0 0
1
2 Displacement (mm)
3
4
Fig. 5. Shearing stress versus horizontal displacement of soil sample k3. 120
k4
Shearing Stress (kPa)
100 80 60 40
ـــــϭⁿ=112 kPa ـــــϭⁿ=56 kPa ـــــϭⁿ=28 kPa
20 0 0
0.5
1
1.5 2 2.5 Displacement (mm)
3
3.5
4
Fig. 6. Shearing stress versus horizontal displacement of soil sample k4.
5. Conclusions Based on the results of the experimental work conducted in the present study, the following conclusions can be drawn out: Contamination of intact soil with acidic wastewater makes the particles finer than in its natural condition, this is because the acidic solute will grind the outer surface of the particle or release the weak layer covering the soil grains, which are mostly of bulky shape. The liquid limit of contaminated soil samples increases compared with the value of intact soil either because the particle become finer or because the nature of the liquid contaminant uses large quantities of water to neutralize the power of hydrogen of contaminated soil samples. The maximum dry unit weight of contaminated soil samples decreased with increasing the percentage of contaminant added to the intact soil.
Journal of Engineering Science and Technology
December 2017, Vol. 12(12)
3146
M. O. Karkush and D. A. Resol
The hydraulic conductivity of contaminated soil samples significantly decreased in comparison with that of intact soil. A slight decrease in specific gravity of contaminated soil samples. The modulus of elasticity and shear modulus are decreased with increasing the percentage of contaminant, but after adding 40% of contaminant become constant. The angle of internal friction of contaminated soil samples decreased from 39 to 29 degrees with increasing the contaminant percentage from 0 to 100%. The cohesion of soil samples decreased from 27 to 18 kPa with increasing the contaminant percentage. This conclusion is limited to the soil samples contaminated with 10 and 20%, but the cohesion of samples contaminated with 40 and 100% increased from 18 to 29 kPa. This is due to the cementing agents among particles of contaminated soil samples.
References 1.
Rowe, R.K. (2001). Geotechnical and geoenvironmental engineering handbook (Edited). New York: Springer Science+Busines Media, LLC. 2. Reddi, L.N.; and Inyang, H.I. (2000). Geoenvironmental engineering principles and applications. New York: Marcel Dekker Inc. 3. Sharma, H.D.; and Reddi, K.R. (2004). Geoenvironmental engineering site remediation, waste containment, and emerging waste management technologies. John Wiley and Sons Inc. 4. Deane, G.; Chroneer, Z.; and Lick, W. (1999). Diffusion and sorption of hexachlorobenzene in sediments and saturated soils. Journal of Environmental Engineering, 125(8), 689-696. 5. Shin, E.C.; Lee, J.B.; and Das, B.M. (1999). Bearing capacity of a model scale footing on crude oil-contaminated sand. Geotechnical and Geological Engineering, 17(2), 123-132. 6. Saikia, B.D.; and Goswami, R. (2000). A study of industrial wastewater effect on soil properties. Indian Geotechnical Conference (Millennium Conference). Mumbai, India, 233-234. 7. Khamehchiyan, M.; Charkhabi, A.H.; and Tajik, M. (2006). The effects of crude oil on geotechnical properties of Bushehr coastal soils in Iran. IAEG2006, The Geological Society of London, No. 214. 8. Gratchev, I.B.; and Towhata, I. (2009). Effects of acidic contamination on the geotechnical properties of marine soils in Japan. Proceedings of the Nineteenth International Offshore and Polar Engineering Conference. Osaka, Japan, 21-26. 9. Karkush, M.O.; and Abdul Kareem, M.S. (2015). Behavior of pile foundation subjected to lateral cyclic loading in contaminated soils. Journal of Civil Engineering Research, 5(6), 144-150. 10. Karkush, M.O.; Zaboon, A.T.; and Hussien, H.M. (2013). Studying the effects of contamination on the geotechnical properties of clayey soil. Coupled Phenomena in Environmental Geotechnics. London: Taylor & Francis Group, 599-607.
Journal of Engineering Science and Technology
December 2017, Vol. 12(12)
Geotechnical Properties of Sandy Soil Contaminated with Industrial . . . . 3147
11. Raymond, A.W.; and Felix, E.O. (2011). Heavy metals in contaminated soils: a review of sources, chemistry, risks and best available strategies for remediation. International Scholarly Research Network, 2011, Article ID 402647. 12. UNEP Report (2005). Assessment of environmental ‘’Hot Spots’’ in Iraq. Retrieved May 28, 2017, from http://postconflict.unep.ch/publications/ Iraq_ESA.pdf. 13. Najaf Technical Institute (NTI) Report (2008). Soil investigation report, Najaf, Iraq. 14. Annual Book of ASTM Standards (2003). Soil and rock; building; stone; peats. American Society for Testing and Materials. 15. British Standards, BS 1377 (1976). Methods of testing for civil engineering purpose. London: British Standards Institution. 16. Head, K.H. (2006). Manual of soil laboratory testing. Volumes I, (3rd edition). UK, Scotland: Whittle's publishing. 17. Head, K.H. (1994). Manual of soil laboratory testing, Volumes II (2nd edition). Hoboken, New Jersey: John Wiley & Sons, Inc. 18. Head, K.H. (1992). Manual of soil laboratory testing, Volumes III (4th edition). UK:John Wiley & Sons Lt. 19. Amu, O.O.; Origbemide, A.R.; and Saseun, E.O. (2010). Effects of dissolved alum on the geotechnical properties of lateritic soil for road construction. Research Journal of Applied Sciences, Engineering and Technology, 2(6), 543-546. 20. James, E.H. (2008). Inorganic chemistry. Canada: Elsevier Inc. 21. Seracettin, A. (2010). Effect of Chemicals on Geotechnical Properties of Clay Liners: A review. Research Journal of Applied Sciences, Engineering and Technology, 2(8), 765-775. 22. Sydney Environmental and Soil Laboratory (1995). Soil chemistry: Theory and practice handbook. Retrieved May 29, 2017, from http://www.sesl.com. au/ uploads/articles/Kings_School_talk1.pdf.
Journal of Engineering Science and Technology
December 2017, Vol. 12(12)