Software Quality Journal, 11, 313–323, 2003 2003 Kluwer Academic Publishers. Manufactured in The Netherlands.
GEQUAMO—A Generic, Multilayered, Customisable, Software Quality Model ELLI GEORGIADOU
[email protected] Middlesex University, School of Computing Science, Trent Park Campus, Bramley Road, London, N14 4YZ, UK
Abstract. Software quality models have primarily been based on top down process improvement approaches. Such models are based on the fundamental principle of empowerment of all involved and foster a questioning attitude through the active exchange of ideas and criticism ensuring that the most appropriate approach for quality improvements is adopted. The holistic view of systems enables the incorporation of many viewpoints held by different parties within the same organisation and by the same party at different stages of development. In this paper the GEQUAMO (GEneric, multilayered and customisable) QUAlity MOdel is proposed. GEQUAMO encapsulates the requirements of different stakeholders in a dynamic and flexible manner so as to enable each stakeholder (developer, user or sponsor) to construct their own model reflecting the emphasis/weighting for each attribute/requirement. Using a combination of the CFD (Composite Features Diagramming Technique) developed by the author, and Kiviat diagrams a multilayered and dynamic model is constructed. Instances of models are presented together with the algorithm for the computation of the profiles. Indications of future work conclude the paper. Keywords:
Software Quality model, multilayer model, customisable model, profiling, stakeholders’ worldview
1. Introduction As software projects became increasingly large and complex it was realised that a controlled development process with defined stages, estimation and measurement of the resources and the effort involved became necessary. According to SWEBOK (2001) processes can be divided into primary, support and organisational processes. Primary processes are acquisition, supply, development, operation and maintenance. Support processes are documentation, configuration management, quality assurance, verification, validation, joint review, audit and problem resolution. Organisational processes are management, infrastructure, improvement and training. Each process is decomposed into tasks and tasks are further decomposed into activities (Siakas, 2002). The Total Quality Management (TQM) movement uses the principles of empowerment and continuous improvement aiming to find a way of fitting the organisation’s goals with employees’ goals. TQM highlights the need of management commitment in the first place. Management as well as every employee have to be made aware and adopt a quality policy and everyone is expected to commit to quality, without resistance. The software development process is called a life-cycle. The production of quality products depends on the quality of the process. Errors in the early stages of the life-cycle usually result in more re-work and are more difficult to correct and, naturally, even more cost demanding (Burr and Georgiadou, 1995).
314
GEORGIADOU
If quality is high, society will get benefit from the product. If the quality is low, our society’s current standards will decrease to cope with those bad products. That is the smaller the loss, the higher the desirability. The term ‘social loss’ implies: • losses due to poor and varied performance of a product; • failure to meet the customer’s requirements of fitness for use or for prompt delivery; • harmful side-effects caused by the product Social loss (Logothetis and Wynn, 1989; Barbor and Georgiadou, 2002) thus is not only financial but also harmful (examples: Arianne, Cancer treatment in Bristolradiotherapy). Lost opportunities through lack of access to new technologies are immesurable for society. 2. Software quality models, factors and attributes In the late seventies McCall et al. (1977) and Boehm (1989) proposed software quality models which formed the basis for project managers to monitor risks and evaluate quality. By the early 90s ISO9126 (ISO-9126) put the emphasis on maintainability. Dromey (1995) formulated and defined a model for software product quality “by associating a set of quality-carrying properties with each of the structural forms that are used to define the statements and statement components of a programming language.” These quality-carrying properties are in turn linked to the high-level quality attributes of the International Standard for Software Product Evaluation ISO-9126. The model supports building quality into software, definition of language-specific coding standards, systematically classifying quality defects, and the development of automated code auditors for detecting quality defects in software. Dromey added Reusability to the six ISO characteristics possibly reflecting the more recent shift to OO and the emphasis placed on reuse. All these models concentrated on product quality looking at attributes and criteria. Hyatt and Resenberg (1996) produced a critique of these models because of their static approach and also because of using “the terms criteria, goals and attributes interchangeably. . . . Finally, the models do not give any guidance as to the use of the metrics and attributes in the identification and classification of risk.” Hyatt and Rosenberg (1996) proposed the SATC Software Quality Model to assist in the identification and definition of product quality attributes and risks which are “used to derive a core set of metrics relating to the development process and the products, such as requirement and design documents, code and test plans. Measurements for each metric are defined and their usability and applicability discussed”. More recently the IEEE initiative resulting in then publication of the Software Engineering Body Of Knowledge which is the first major attempt to collect, classify and standardise the Software Engineering terms, models, methods and techniques (SWEBOK, 2001). In Siakas et al. (1997) we proposed an “alphabet” for software quality which provides indications of conflicts and compromises, synergy and opposition. In each case (each attribute) the stakeholders ‘concerned’ are indicated together with the degree of their concern. What we attempted to emphasise (Appendix A) is that software quality is multi-faceted, difficult to define and even more difficult to achieve. Many of
GEQUAMO
315
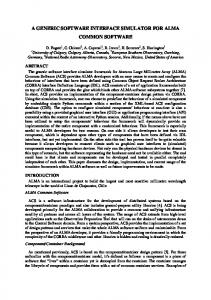
the attributes define the same, similar or interrelated aspects such as learnability and usability. Others are obvious by definition such as portability. Most are difficult to quantify. According to ISO-9126 software quality may be evaluated by six characteristics, namely functionality, reliability, efficiency, usability, maintainability and portability. Each of these characteristics is defined as a “set of attributes that bear on” the relevant aspect of software and can be refined through multiple levels of sub-characteristics (ISO-9126). 3. A multilayered quality model 3.1. Gradual decomposition of attributes into sub-attributes An example of the gradual decomposition into layers of characteristics and subcharacteristics is shown in Figure 1 where the required features of a CASE tool are depicted onto the branches of a tree-like structure showing up to three layers of primary attributes, sub-attributes (secondary) and sub-sub-attributes (tertiary) enables quality profiling. As can be seen each node is exploded into two, three or more sub-characteristics. The proposed Quality model uses the Composite Features Diagram (CFD) comprising a set of concentric circles showing increasingly lower details (sub-characteristics). For legibility’s sake we omit the labels from the characteristics in order to describe the technique. In the example shown in Figure 2 (a generic CFD) we profile an item
Figure 1. Layering of characteristics (applied to a CASE tool).
316
GEORGIADOU
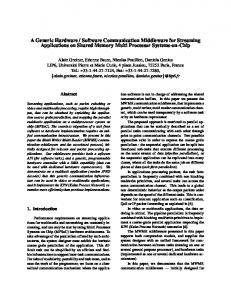
Figure 2. A generic CFD.
Figure 3. Kiviat diagrams for the evaluation and comparison of two tools. (- - -) Treshold values, (—) tool profile.
under evaluation (such as a method, a model, a CASe tool) as having three primary characteristics R1, R2, R3. R1 has two siblings (R1.1, R1.2) and R1.2 has three siblings (R1.2.1, R1.2.2 and R1.2.3). Similarly R2 and R3 are decomposed into three and four sub-characteristics, respectively. The process may continue until simple and thus more easily measurable characteristics are identified. Hence the various branches may be truncated at any layer and any node. The CFD provides a qualitative platform for depicting a profile (absence or presence of features/characteristics/sub-characteristics. Quantitative information can also be captured at least for the outermost branches of the tree-like components of the CFD. At each node and depending on the number of sub-characteristics we can construct a polygon (triangle, rectangle, pentagon and so on). In the case of only two subcharacteristics the average score of the two is propagated inwards (mother branch). These polygons are Kiviat diagrams examples of which are shown in Figure 3. For legibility’s sake we omit the labels from the characteristics in order to describe the technique. Kiviat diagrams can represent quantitative information belonging to the same layer as shown below: It depicts three Requirements/characteristics with actual and threshold values (on a scale of 0–5 where 0 = absence, 1 = poor, 2 = satisfactory, 3 = good, 4 = very good and 5 excellent). It can be seen that tool A satisfies the threshold criteria whilst tool B violates the threshold value for R3. Other criteria such as cost, availability, prestige of supplier, etc., could be considered for further proposals to users.
GEQUAMO
317
Working from the outer layers inwards we can quantify the strength of the parent branch by propagating the normalised values inwards. The initial version of the algorithm was presented in Georgiadou et al. (1998). At each branching point (node) we can construct a Kiviat diagram and carry out the calculation. In the end, the innermost circle is itself a Kiviat diagram which again provides the final measure of the overall quality. Kiviat diagrams can represent quantitative information belonging to the same layer in Table 3. Attributes are represented by radii of the circle. In the polygon (a triangle) is regular indicating that the weight of all three attributes is identical. The area of the polygon can be calculated by adding the areas of the three triangles. The maximum possible value of each attribute on say a scale of 0–5 can also be calculated. Other aspects that can be shown on the Kiviat diagram are threshold of minimum values. The computation is simply using the formula for calculating the area of a triangle when the size of two sides are known as well as the enclosed angle. The algorithm assumes that the circle is divided into equal sectors. Variations of the technique allow for changes in the relative weights and hence to the angles. Area of triangle = 0.5× length of side one × length of side two× sine of enclosed angle: threshold area = 0.5{(2 × 3) + (3 × 4) + (4 × 2)} sin 120◦ , tool A area = 0.5{(3 × 3) + (3 × 5) + (5 × 3)} sin 120◦ , tool B area = 0.5{(4 × 2) + (2 × 3) + (3 × 4)} sin 120◦ , maximum possible area = 3 × 0.5(5 × 5 × sin 120◦ ). The value of the parent branch is thus obtained by the simple calculation: 5 × actual area/maximum. This is propagated inwards and gradually the innermost circle of the primary requirements/features is reached. Thus the final calculation provides an indicator of quality as required, estimated or obtained empirically.
3.2. A customisable model Software quality according to the IEEE Glossary of Software Engineering Terminology (SWEBOK, 2001) is the degree to which software meets customer or user needs or expectations. A quality factor is an attribute of software that contributes to its quality. According to these two definitions it can be said that quality factors are attributes that customers or users expect to find in the software. Thus software quality factors can be said to be customer or user oriented. We argue that different stakeholders have different perceptions about quality attributes. As Functionality and Reliability are indisputably a common concern of all involved we will concentrate on three attributes namely Maintainability, Usability and Productivity which are likely to differ because Developers, Users and Sponsors put different emphasis on each one.
318
GEORGIADOU
3.2.1. Stakeholders and their viewpoints According to ISO-12207 (ISO-12207) there are five systems and thus quality views, namely: 1. The contract view 2. The management view 3. Operating view 4. Engineering view 5. Supporting view
Acquirer, supplier Manager Operator, user Developer, maintainer Support process employer
Users are the persons (internal and/or external to the organisation) who use the finished product (the software). If we group together Acquirers, Suppliers and Managers as Sponsors and all persons who are neither Sponsors nor Users as Developers we have three groups of Stakeholders namely Users, Sponsors and Developers. 3.2.2. Software attributes for use, modification and reuse Software attributes can be grouped as shown in Table 1 adapted from models proposed by (Fenton, 1991) and (Dromey, 1995). Many software systems have a very high level of maintenance mainly due to changes in requirements. These can happen due to customer’s external circumstances change or because customers become more demanding. Maintainability is normally only of indirect interest to customer. According to Ince (1995) very few customers include directives about maintenance in their requirement specifications. Maintainability is important to the developer because there is a correlation between maintainability and the degree of rework. The same reason is relevant to the sponsor but in terms of costs. Portability and Productivity are normally of interest to the sponsor because of competitive reasons and only of indirect interest to the customer. If portability is of interest to the user it should be stated in detail in the requirements analysis. The customer’s concerns on quality factors are rather different from those of the developers and the managers. Customers are mainly requiring a correct software, easy to use, ready in time to a price that gives value for money. Quality attributes considering the product is for the user of greatest interest. Developers are mainly interested in a structured software easy to maintain and to reuse. Sponsors are mainly interested in quality attributes that give satisfied customers to a low cost. Thus, the developer and the sponsor are concerned about quality attributes regarding the process rather than the product. Checkland spoke of different and often conflicting worldviews are held by different stakeholders (Checkland and Scholes, 1990). Table 1. Attributes grouped by use, modification and reuse Use
Modification
Reuse
Correctness Efficiency Integrity Reliability Understandability Usability
Extendibility Flexibility Maintainability Testability
Compatibility Durability Portability Reusability
319
GEQUAMO
3.3. The need for a customisable model As can be seen in Appendix A stakeholders are shown to work in synergy, conflict or compromise. The proposed alphabet (Siakas et al., 1997) did not make any attempt to rationalise or even group the attributes together. Tables 2–4 reveal that functionality and reliability are common concerns to all stakeholders. However, we can safely assume that a software systems developer strives to produce reliable and maintainable systems with maximum functionality. The user desires a system which is reliable, understandable, usable easy to learn and easy to use and with the necessary functionality. The sponsor is extremely interested in maximising productivity i.e. he requires a reliable system with the necessary functionality, produced within acceptable time limits and at the lowest cost possible. Enhanced reliability (usually achieved through testing, walkthroughs, reviews and inspections) will reduce productivity and will therefore increase costs. Both of these Table 2. The developer’s worldview Current system problems
Desirable system characteristics
Reliability: errors, faults, failures (behaviour)
Correctness, consistency, Completeness
Functionality
At worse-preserved functionality
Maintainability
Enhanced functionality, reliability, maintainability
Table 3. The user’s worldview Current system problems
Desirable system characteristics
Reliability: errors, faults, failures (behaviour)
Reliability, robustness
Understandability and usability
Enhanced understandability and usability
Functionality
At worse-preserved functionality, enhanced functionality
Table 4. The sponsor’s worldview Current system problems
Desirable system characteristics
Reliability: errors, faults, failures (behaviour)
Reliability, robustness
Late deliveries (low productivity)
Enhanced productivity
Costs (over budget)
Reduced/minimised costs
Functionality: customer complaints (not meeting requirements)
At worse-preserved functionality, ideally enhanced functionality
320
GEORGIADOU
(a)
(b)
(c)
(d)
Figure 4. Multilayered and customisable view of quality: (a) a generic multilayered quality model; (b) attributes of central interest to developers; (c) attributes of central interest to users; (d) attributes of central interest to sponsors.
cause losses to the sponsor. Enhanced functionality increases costs (in the short term) and causes losses to the sponsor. Usability is enhanced through greater understandability which in turn is enhanced through design correctness and consistency and through training, on-line help and support all of which reduce productivity with the exception of CBD which makes extensive reuse of code and increasingly reuse of designs too. Specific quality attributes are selected based on their importance to the project and their ability to be quantified. Figure 4 is an example of how a generic template CFD can be used to depict a customisable view of requirements by developers, users and sponsors. Figure 5 shows the last part of the computation using Kiviat diagrams. 4. Conclusion The GEQUAMO—generic and hence customisable, multilayered software quality model has been presented together with the profiling/visualisation techniques Composite Features Diagram (CFD) and Kiviat diagrams for qualitative and quantitative representation. It was demonstrated that developers, sponsors and users have synergistic but often conflicting requirements. It is a management decision how to reconcile conflicts for the overall benefit to the company. Future work will concentrate on the improvement of the prototype of the Profiler tool so that industry based surveys, trials and evaluations can take place in order to further formalise the proposed model.
321
GEQUAMO
(a)
(b)
(c)
(d)
Figure 5. Customisable views of quality: (a) The solid line triangle shows the maximum possible and the dotted line triangle shows the threshold values; (b) a quality profile from the Developer’s viewpoint; (c) a quality profile from the User’s viewpoint; (d) a quality profile from the Sponsor’s viewpoint.
Acknowledgements The author extends warm thanks to all the reviewers for the thorough comments on the earlier version of this paper. In particular sincere thanks to Dr. Witold Suryn for his incisive critical and constructive comments. Appendix A Table 5. A software quality alphabet and different viewpoints (from (Siakas et al., 1997)) The alphabet
Sponsor
Developer
User
Availability Boundedness Correctness Durability Functionality Flexibility Genericity Holisticness Integrity Justifiability
+ 0 + + 0 + 0 + + +
0 0 + 0 0 0 + 0 0 +
+ + + + + + − + + −
+ = Direct interest; 0 = indirect interest; − = no interest.
322
GEORGIADOU
Table 6. (Continued.) Know-how support Learnability Maintainability Novelty Operability Portability Quantifiability Reliability Simplicity Testedness Usability Verifiability Worldview eXpandability Y? Yet-another unknown Zoticality
0 0 + + 0 + + + 0 0 + + + + + +
0 0 + 0 0 0 + + + + 0 0 + + + +
+ + 0 0 + + + + + − + − + − + 0
+ = Direct interest; 0 = indirect interest; − = no interest.
Appendix B
Figure 6. Examples of Kiviat dagrams depicting 4 or more sub-characteristics (siblings of the same branch in a CFD node). The ratio of the polygon area (highlighted) to the maximum possible area (shown in dotted lines, regualr polygons) mapped onto the 0–5 scale provides the collective strength of the sub-attributes propagated inwards onto the parent branch.
GEQUAMO
323
References Barbor, N. and Georgiadou, E. 2002. Investigating the applicability of the Taguchi method to software development, Proceedings of Quality Week, San Francisco, USA, July. Boehm, B. 1989. Software Risk Management, IEEE Computer Society Press, CA. Burr, A. and Georgiadou, E. 1995. Software development maturity—a comparison with other industries, 5th World Congress on Total Quality, India, New Delhi, February. Checkland, P. and Scholes, J. 1990. Soft Systems Methodology in Action, Wiley. Dromey, R.G. 1995. A model for software product quality, IEEE Transactions on Software Engineering 21(2): 146–162. Fenton, N. 1991. Software Metrics—A Rigorous Approach, London, Chapman & Hall. Georgiadou, E., Hy, T. and Berki, E. 1998. Automated qualitative and quantitative evaluation of software methods and tools, Proceedings of the 12th International Conference of the Israel Society for Quality, Jerusalem, Israel, December. Hyatt, I. and Rosenberg, L. 1996. A software quality model and metrics for identifying project risks and assessing software quality, http://www.di.ufpe.br/∼inspector/relacionados/stc_qual.html Ince, D. 1995. Software Quality Assurance, New York, McGraw-Hill. ISO-12207. 1998. http://www.sei.cmu.edu/activities/cmm/docs/standards-map.pdf ISO-9126. 2001. http://www.issco.unige.ch/projects/ewg96/node13.html Logothetis, N. and Wynn, H.P. 1989. Quality through Design: Experimental Design, ‘Off-line Quality Control and Taguchi’s Contributions’, Oxford, Oxford Science Publications. McCall, J.A., Richards, P.K. and Walters, G.F. 1977. Factors in software quality, RADC TR-77-369, Us Rome Air Development Center Reports. Siakas, K. 2002. SQM-CODES; Software quality management—cultural and organisational diversity evaluation, Ph.D. thesis submitted November 2002 for the degree of Ph.D. at London Metropolitan University. Siakas, K., Berki, E., Georgiadou, E. and Sadler, C. 1997. The complete alphabet of quality software systems, 7th World Congress for Total Quality Management, New Delhi, India, February. SWEBOK 2001. http://www.swebok.org/documents/trial_Version1.00
Elli Georgiadou is a Principal Lecturer in Software Engineering at Middlesex University, London. Her teaching includes software metrics, methodologies, CASE and project management. She is engaged in research in software measurement for product and process improvement, methodologies, metamodelling, cultural issues and software quality management. She is a member of the University’s Global Campus project (developing and offering ODL). She has extensive experience in academia and industry, and has been active in organising/chairing conferences and workshops under the auspices of the British Computer Society, the ACM British Chapter and various European programmes for Technology Transfer and development of joint curricula. She established a Distance Mode Initiative between a UK University and a Hong Kong Institute developing and offering technology-based learning. She has engaged in developing the pedagogic framework as well as the development of materials. She designed and carried out evaluations of various ODL initiatives in the UK, Greece, Spain, Finland, Hong Kong and Cyprus.