Apr 19, 2008 - in the R package GillespieSSA (i.e., Gillespie's exact method and ..... initial system definitions, and a sub-list of various simulation statistics.
JSS
Journal of Statistical Software April 2008, Volume 25, Issue 12.
http://www.jstatsoft.org/
GillespieSSA: Implementing the Stochastic Simulation Algorithm in R Mario Pineda-Krch University of California, Davis
Abstract The deterministic dynamics of populations in continuous time are traditionally described using coupled, first-order ordinary differential equations. While this approach is accurate for large systems, it is often inadequate for small systems where key species may be present in small numbers or where key reactions occur at a low rate. The Gillespie stochastic simulation algorithm (SSA) is a procedure for generating time-evolution trajectories of finite populations in continuous time and has become the standard algorithm for these types of stochastic models. This article presents a simple-to-use and flexible framework for implementing the SSA using the high-level statistical computing language R and the package GillespieSSA. Using three ecological models as examples (logistic growth, Rosenzweig-MacArthur predator-prey model, and Kermack-McKendrick SIRS metapopulation model), this paper shows how a deterministic model can be formulated as a finite-population stochastic model within the framework of SSA theory and how it can be implemented in R. Simulations of the stochastic models are performed using four different SSA Monte Carlo methods: one exact method (Gillespie’s direct method); and three approximate methods (explicit, binomial, and optimized tau-leap methods). Comparison of simulation results confirms that while the time-evolution trajectories obtained from the different SSA methods are indistinguishable, the approximate methods are up to four orders of magnitude faster than the exact methods.
Keywords: Gillespie’s exact method, Kermack-McKendrick SIRS model, logistic growth, metapopulation model, Rosenzweig-MacArthur predator-prey model, tau-leaping.
1. Introduction It is well known that stochasticity in finite populations can generate dynamics profoundly different from the predictions of the corresponding deterministic model. For example, demographic stochasticity can give rise to regular and persistent population cycles in models that
2
GillespieSSA: Stochastic Simulation Algorithm in R
are deterministically stable (e.g., Nisbet and Gurney 1976; Dushoff et al. 2004; McKane and Newman 2005; Pineda-Krch et al. 2007) and can give rise to molecular noise and noisy gene expression in genetic and chemical systems where key molecules are present in small numbers or where key reactions occur at a low rate (e.g., Arkin et al. 1998; Fedoroff and Fontana 2002; McAdams and Arkin 2005). Because analytical solutions to stochastic time-evolution equations for all but the simplest systems are intractable, while numerical solutions are often prohibitively difficult, stochastic simulations have become an invaluable tool for studying the dynamics of finite biological, chemical, and physical systems. In the 1970s, Daniel T. Gillespie (1977, 1976) developed an exact stochastic simulation approach for chemical kinetics, the Gillespie stochastic simulation algorithm (SSA). The SSA is a procedure for generating time-evolution trajectories of finite populations in continuous time and has since its introduction become the standard algorithm for these types of models. The development of the SSA was also the first effort to accelerate stochastic simulations beyond what is possible using the basic algorithm by Gillespie. Although the SSA and its various exact and accelerated Monte Carlo implementations have largely been developed for models of chemical kinetics and molecular dynamics, the procedures are applicable to any continuous time system that can be described using coupled first-order ordinary differential equations. The examples used in this paper are selected to illustrate how to implement the SSA for different types of ecological models. This article presents a simple-to-use and flexible framework for implementing the SSA using the high-level statistical computing language R (R Development Core Team 2007a). Using three ecological models as examples, I show how the deterministic model can be formulated as a finite-population stochastic model within the framework of the SSA theory and how it can be implemented in R using the GillespieSSA package which provides a simple-to-use and intuitive interface to several SSA Monte Carlo procedures. Section 2 provides a brief background introduction to the theory underlying the SSA and several of its Monte Carlo implementations. Section 3 describes the basic strategy of implementing the SSA using the GillespieSSA package. Section 4 demonstrates the implementation of GillespieSSA using three biological example models. Section 5 provides a discussion of the computational accuracy and performance of the different Monte Carlo methods in light of the examples. Finally, Section 6 provides a brief summary of future developments of the package.
2. The Gillespie stochastic simulation algorithm The Gillespie stochastic simulation algorithm (SSA) is a procedure for generating statistically correct trajectories of finite well-mixed populations in continuous time. The trajectory that is produced is a stochastic version of the trajectory that would be obtained by solving the corresponding stochastic differential equations. While the original SSA (Gillespie 1976, 1977) is numerically exact, it is generally too slow for most practical applications. Over the years, numerous approximate SSA methods have been developed to improve the computational efficiency of the procedure. The SSA methods described in this paper are the ones implemented in the R package GillespieSSA (i.e., Gillespie’s exact method and three accelerated approximate methods). Parameters and variables that are formal arguments in the package are indicated by typewriter font. Unless otherwise indicated they are followed by the default value (e.g., epsilon = 0.03).
Journal of Statistical Software
3
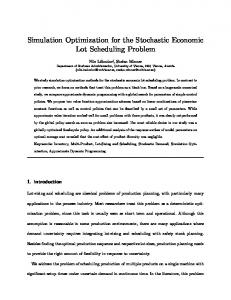
The SSA assumes a population consisting of a finite number of individuals distributed over a finite set of discrete states. Changes in the number of individuals in each state occur due to reactions between interacting states. Given an initial time t0 and initial population state X(t0 ), the SSA generates the time evolution of the state vector X(t) ≡ (X1 (t), . . . , XN (t)) where Xi (t), i = 1, . . . , N , is the population size of state i at time t and N is the number of states. The states interact through M reactions Rj where j = 1, . . . , M denotes the jth reaction. A reaction is defined as any process that instantaneously changes the population size of at least one state. Each reaction Rj is characterized by two quantities. The first is its state-change vector νj = (ν1j , . . . , νN j ), where νij is the population change in state i caused by one Rj reaction. In other words, if the system is in state x, assuming x = X(t), and one Rj reaction occurs, the system instantaneously jumps to state x + νj . The second component of Rj is its propensity function aj (x) which is the probability of one Rj reaction occurring in the infinitesimal time interval [t, t + dt). To illustrate the basic SSA theory, consider the simple radioactive decay model (also known as the irreversible isomerization reaction set, see Gillespie 1977) dX = −cX dt where X is the population density at time t and c is the decay parameter. This system consists of a single state X1 (N = 1) and a single reaction, X → ∅ (M = 1). Assuming X = 1000 and c = 0.5 the SSA can now be applied by setting the initial population state X1 = 1000, the state-change vector ν = −1, and the propensity function a1 = c. This model is available in the package as a demonstration model and can be invoked using demo("radioactiveDecay). Figure 1 shows the output from one realization.
2.1. Exact SSA There are several mathematically equivalent Monte Carlo procedures for constructing exact numerical realizations of the SSA. Perhaps the simplest procedure is the original method by Gillespie, the so-called direct method (Gillespie 1977, 1976). The direct method proceeds by drawing two random numbers r1 and r2 from the uniform distribution in the unit interval. The time step to the next reaction is then determined as τ = 1 ln(1/r1 ) where a0 (x) = a0 (x) P aj (x) and the index of the next reaction to execute Rj is the smallest integer j satisfying Pj j = i=1 ai (x) > r2 a0 (x). The reaction is then executed by replacing t ← t + τ and x ← x + νj . When a0 (x) becomes large, due to large population sizes or high reaction rates, the time increment between reactions decreases, slowing down the simulation. Although computationally more efficient exact methods have been developed (Gibson and Bruck 2000; Cao et al. 2004b), any procedure that simulates one reaction at a time will inevitably be too slow for most practical applications.
2.2. Approximate SSAs Several approximate Monte Carlo procedures have been developed which provide better computational performance than the exact methods. These accelerated procedures sacrifice the exactness of the exact methods for potentially large improvements in computational efficiency.
4
GillespieSSA: Stochastic Simulation Algorithm in R
600 400
D, 13.57 sec, 1000 steps (1 steps/point) ● ● ● ● ● ● ● ● ● ● ● ● ● ● ● ● ● ● ● ● ● ● ● ● ● ● ● ● ● ● ● ● ● ● ● ● ● ● ● ● ● ● ● ● ● ● ● ● ● ● ● ● ● ● ● ● ● ● ● ● ● ● ● ● ● ● ●● ● ● ● ● ● ● ● ● ● ● ● ● ● ● ● ● ● ● ● ● ● ● ● ● ● ● ● ● ● ● ● ● ● ● ● ● ● ●● ● ● ● ● ● ● ● ● ● ● ● ● ● ● ● ● ● ● ● ● ● ● ● ● ● ● ● ● ● ● ● ● ● ● ● ● ● ● ● ● ● ● ● ● ● ● ● ● ● ● ● ● ● ● ● ● ● ● ● ● ● ● ● ● ● ● ● ● ● ● ● ● ● ● ● ● ● ● ● ● ● ● ● ● ● ● ● ● ● ● ● ● ● ● ● ● ● ● ● ● ● ● ● ● ● ● ● ● ● ● ● ● ● ● ● ● ● ● ● ● ● ● ● ● ● ● ● ● ● ● ● ● ● ● ● ● ● ● ● ● ● ● ● ● ● ● ● ● ● ● ● ● ● ● ● ● ● ● ● ● ● ● ● ● ● ● ● ● ● ● ● ● ● ● ● ● ● ● ● ● ● ● ● ● ● ● ● ● ● ● ● ● ● ● ● ● ● ● ● ● ● ● ● ● ● ● ● ● ● ● ● ● ● ● ● ● ● ● ● ● ● ● ● ● ● ● ● ● ● ● ● ● ● ● ● ● ● ● ● ● ● ● ● ● ● ● ● ● ● ● ● ● ● ●● ● ● ● ● ●● ●● ● ● ● ● ● ●● ● ● ● ● ● ● ● ● ● ● ● ● ●● ● ● ● ● ● ● ● ● ● ● ● ● ● ● ● ● ● ● ● ● ● ● ● ● ● ● ● ● ● ● ● ● ● ●● ● ● ● ● ● ● ● ● ● ● ● ● ● ● ● ● ● ● ● ● ● ● ● ● ● ● ● ● ● ● ● ● ● ● ● ● ● ● ● ● ● ● ● ● ● ● ● ● ● ● ● ● ● ●● ● ● ● ● ● ● ● ● ● ● ● ● ● ● ● ● ●● ●● ● ● ● ● ● ● ●● ● ● ● ● ●● ● ● ● ● ●● ● ● ● ● ● ● ● ● ● ● ● ● ● ● ● ● ● ● ● ●● ●● ● ● ● ● ● ● ● ● ● ● ● ● ● ● ● ● ● ● ● ● ● ● ●● ● ● ● ● ● ● ● ● ● ● ● ● ● ● ● ●● ● ● ● ● ● ● ● ● ● ● ● ● ● ● ●● ● ● ● ● ● ● ● ●● ● ● ● ● ● ● ● ● ● ● ● ● ● ● ● ● ● ● ● ● ● ● ● ● ● ● ●● ●● ● ● ● ● ● ● ● ● ● ● ● ● ● ● ● ● ● ● ●● ● ● ● ●● ● ● ● ● ● ● ● ●● ● ● ● ● ● ●● ● ● ●● ●● ● ● ● ● ● ● ●● ● ● ● ● ● ●● ● ● ● ●● ● ● ●● ● ●● ● ● ●● ● ● ● ● ● ● ● ● ● ● ●● ● ●● ● ● ● ● ● ● ● ● ● ●● ● ●● ● ● ●●●● ●● ● ● ● ● ●● ● ●● ● ● ●● ●● ●● ● ●● ●● ●● ● ●● ● ● ● ● ● ●● ● ● ● ●● ● ●● ● ●● ● ● ● ● ● ● ● ● ● ●● ● ● ● ● ● ● ●● ●● ●● ●● ●● ● ● ●● ● ● ● ●● ● ● ●● ● ●● ● ●● ● ● ● ● ● ●
● ●● ● ● ● ● ● ● ● ● ● ●● ●● ● ●●
●●
● ● ●●●
●●● ● ● ● ● ● ● ● ●● ●● ● ●● ● ● ● ● ● ●● ● ●● ● ● ● ●●
●● ● ●● ● ●● ● ● ●● ● ● ● ● ●● ● ●● ●
● ● ● ●● ● ● ●● ●● ● ●●●
●●
● ● ●● ●●● ●●
0
200
Frequency
800
1000
Radioactive decay model
0
2
4
6
●
●
●● ●●
●
● ●● ●
●●
● ●● ● ● ●
●●
●
●
● ● ●
● ●
8
●
● ●
●
●
●
● ● ●
●
10
●
●
●
12
●
●
14
Time
Figure 1: Example of a single realizations of the radioactive decay model using demo("radioactiveDecay"). Each data point represent a single time step.
Instead of simulating a single reaction per time step, reactions are ”bundled” in coarse-grained time increments. As one time step leaps over many reactions, these methods are known as ”leap” or ”accelerated” methods. Under the right conditions, speed-ups of several orders of magnitude can be achieved. An important assumption in all accelerated SSA procedures is that the Leap Condition is satisfied. The Leap Condition requires that the time leap be small enough that the change in the propensity functions are negligible (Gillespie 2007). In other word, aj (x) ≈ constant in [t, t + τ ] for all j. Three approximate SSA methods are presented in this paper: the explicit tau-leap method (ETL); binomial tau-leap method (BTL); and optimized tau-leap method (OTL).
2.3. Explicit tau-leap (ETL) In the explicit tau-leap (ETL) method (Gillespie 2001), the number of firings for each reaction Rj during the time step τ is sampled independently from a Poisson distribution. In the original ETL formulation, the procedure for selecting the step size is computationally inefficient (both in terms of speed and accuracy) (Gillespie 2001). In order to keep the algorithm as simple and as fast as possible the ETL step-size selection procedure is simplified in the GillespieSSA package by assuming a constant user-defined step size (tau = 0.3).
Journal of Statistical Software
5
The ETL method proceeds by generating, for each reaction j = 1, . . . , M , the number of firings kj of reaction Rj in the time step τ as a sample of a Poisson random variable with mean (and variance) aj (x)τ . Assuming x = X(t), the leap is executed by replacing t ← t + τ P and x ← x + M j=1 kj νj . While this version of the ETL method has the advantage of computational simplicity, it does require the user to supply a predefined step size. A heuristic procedure for selecting an appropriate step size is to evaluate the distribution of step sizes obtained from short exploratory simulations using the direct method (this assumes that every time step is recorded, i.e., censusInterval = 0). As a rule of thumb, the step size should be at least a few multiples of the expected time to the next reaction, 1/a0 (x) for the ETL method to be worthwhile implementing (Gillespie 2001). Although the ETL procedure can significantly speed up the simulation, it is not as foolproof as the direct method. Due to the unbounded nature of Poisson random variables and the lack of coordination between reactions during a time step, the population sizes of individual states can become negative.
2.4. Binomial tau-leap (BTL) To address the problem of negative population sizes arising in the ETL method, Tian and Burrage (2004) and Chatterjee et al. (2005) independently developed the binomial tau-leap (BTL) method. The BTL method described here is a slightly modified version of the procedure proposed by Chatterjee et al. (2005). In the ETL method negative population sizes can arise in two ways. Either a reaction can fire more times than the number of available reactants (i.e., individuals) in one of the states, or several reactions firing simultaneously during a time step, can drive the number of individuals in one or several states below zero (Gillespie 2007). By coordinating the number of firings among different reactions during a time step the maximum number of firings per reaction Rj can be bounded by the number of individuals in the limiting state (i.e., the state that would be completely depleted if its consuming reaction were to go to completion). To coordinate the reactions, the maximum number of firings for a given reaction kj∗ is updated between each subsequent firing during a time step. The time increment τ is determined by scaling the expected time to the next reaction 1/a0 (x) by a coarse graining factor, f (assuming f > 1) (f = 10), τ = f /a0 (x). The number of firings of reaction Rj during time step τ is then sampled from the binomial random variable kj = B(kj∗ , p), where kj is the number of successes in kj∗ independent Bernoulli trials, where each trial has the probability of success (i.e., it fire) of p = aj (x)τ /kj∗ . If aj (x)τ > kj∗ (i.e., p > 1) the resulting probability is coerced to unity resulting in kj = kj∗ and the extinction of the limiting state. This occurs when a too high coarse-graining factor, f , has been used. One difference here from the original BTL method of Chatterjee et al. (2005) is that if reaction Rj does not have any limiting populations, the number of firings is sampled from a Poisson distribution with mean aj (x)τ .
2.5. Optimized tau-leap (OTL) The optimized tau-leap (OTL) method was introduced by Cao et al. (2006). It is an improved procedure that efficiently estimates the largest possible step size, while providing more accurate results than previous approximate methods (Gillespie 2007).
6
GillespieSSA: Stochastic Simulation Algorithm in R
The OTL method partitions the reactions into set of critical and noncritial reactions with Jc and Jnc being the sets of indices in j of all critical and noncritical reactions (j = 1, . . . , M ). A reaction is defined as critical if it is within nc (nc = 10) number of firings of depleting any one of its reacting states. The step size selection procedure in the OTL method is based on bounding the relative change in the propensity functions of the noncritical reactions by the same amount (in contrast to the Leap Condition which evaluates the absolute change in each propensity function separately). The OTL method proceeds by calculating a candidate time step τnc , estimating the time step to the next noncritical reaction, for which the estimated fractional change aj (x)/aj (X(t + τ )) of noncritical reactions, j ∈ Jnc , is bounded by a user-specified accuracy-control parameter � (0 < � � 1) (epsilon = 0.03). The largest permissible τnc is selected indirectly by bounding the estimated fractional change in each state i by an amount εi = εi (�, xi ) where the function εi is chosen based on the highest order of the reaction in which state i is involved (see Cao et al. 2006, for further details). If the candidate time step τnc is less than the D multiple (dtf = 10) of 1/a0 (x), the OTL method is temporarily suspended and the next nD steps (nd = 100) are executed as single reaction time steps using the direct method. If the tau-leaping proceeds, i.e., τnc ≥ D/a0 (x), a second candidate time step τc , estimating the time to the next critical reaction,P is generated as a sample of the exponential random variable with mean 1/ac (x), where ac = j∈Jc aj (x). The smaller of the two candidate time steps, τnc and τc , is then chosen as the actual time step τ . The number of firings of each noncritical reaction kj is sampled as a Poisson random variable with mean aj (x), where j ∈ Jnc . If τc ≤ τnc a single critical reaction jc fires once during the current time step. The reaction jc is selected as a sample of the integer random variable with point probabilities aj (x)/ac (x) where j ∈ Jc . If τnc < τc no critical reactions are allowed to fire during the current time leap.
3. Implementing the SSA in R The SSA framework described in this paper is implemented using the R package GillespieSSA (Gillespie’s Stochastic Simulation Algorithm, Pineda-Krch 2008), which is available from the Comprehensive R Archive Network (CRAN) at http://CRAN.R-project.org/package= GillespieSSA. The package is designed to be simple and intuitive to use and is aimed at facilitating rapid prototyping, deployment, and evaluation of continuous time stochastic models while being extensible and flexible enough to allow the development of larger and more complex models. Usually Monte Carlo implementations of the SSA are developed using low-level compiled language such as C, C++ or Fortran, e.g., StochKit (Cao et al. 2004a). While this has the advantage of being computationally efficient and enables true code parallelization it also requires the end user to have a high level of technical skill to successfully utilize these routines. Implementing the SSA in a higher level programming language like R, in particular the functions that provide the end-user interface, has the advantage of allowing faster model prototyping, simpler and shorter model code, platform independence, and a more interactive development cycle (Petzoldt and Rinke 2007). While the simulations will inevitably be slower than in low-level implementations, under certain circumstances, it may be possible to parallelize the
Journal of Statistical Software
7
code by distributing independent computations across nodes of a computational cluster, e.g., by using the snow (Simple Network of Workstations) package (Rossini et al. 2007). Another advantage of implementing the package in R is that the it is required to pass validation checks that require a consistent documentation giving the package a certain “permanence” and making it citable (R Development Core Team 2007b). The main interface function in GillespieSSA is ssa() which is the function most users will use to launch simulations. The ssa() function first checks the consistency of the defined system. Then the function evaluates the propensity functions, sets appropriate default values to SSA arguments that have not been defined by the user, and runs a single Monte Carlo realization using the requested SSA method, ssa.[method name] (). When the simulation terminates ssa(), returns a list object containing the generated time series, a sub-list of the initial system definitions, and a sub-list of various simulation statistics. For a full description of all the options see Pineda-Krch (2008). It is possible to directly invoke the method functions ssa.[method name] (). If all of the functionality of the higher-level interface function ssa() are not required it may be possible to optimize the performance of the simulation code by directly accessing the necessary method function. Because the method functions execute one time step at a time, events taking place between subsequent time steps (e.g., incrementing the time, updating the state vector, reevaluating the propensity functions, and recording the current state of the system) have to be implemented separately by the user. The package manual (Pineda-Krch 2008) provides examples of how such simulations can be set up. Usually the first step in implementing a stochastic model within the framework of SSA theory is to formulate the deterministic model, the set of coupled ordinary differential equations that define the instantaneous rate of change of the population densities in the different states (see for example Equations 1, 2 and 4 below). Although it is possible to formulate the stochastic model without first having a deterministic model, the advantage of starting out with the deterministic formulation is that one can generate predictions for the qualitative dynamics of the model. For example, a local stability analysis can determine parameter regions that would be interesting to explore using the stochastic model. The next step is to identify the reactions and derive their associated quantities — the propensity functions and the state-change vectors — both of which can be derived from the deterministic model. In the propensity functions, the state variables are no longer densities, but the actual (finite) numbers of individuals at any given point in time. Once these quantities have been defined, the stochastic model can be specified within the framework of GillespieSSA with the desired parameters and initial conditions.
4. Example models To illustrate how to define, set up, and run different types of models using the GillespieSSA package, three different biological models are used as examples. Two of the models are classical ecological models, the logistic-growth model (Kot 2001) and the Rosenzweig-MacArthur predator-prey model (Pineda-Krch et al. 2007) while the third model is an epidemiological metapopulation model based on the Kermack-McKendrick SIRS model (Brown and Rothery 1994). The models span a broad range of complexity, ranging from the simple logistic model to the dynamically complex predator-prey model and the more complex formulation of the
8
GillespieSSA: Stochastic Simulation Algorithm in R
metapopulation SIRS model.
4.1. Logistic growth The classical logistic-growth model assumes that the growth of a population decreases with increasing population size and is given by the following equation, � � dN N (1) = rN 1 − dt K where N is the population density, K is the carrying capacity of the environment, and r is the intrinsic per capita growth rate of the population. The model consists of two reactions, birth (R1 ) and death (R2 ). Given r = b − d where b and d are the birth and death rates and assuming x = X(t), the propensity functions for the two reactions are defined from Equation 1 as a1 (x) = bN and a2 (x) = (d + rN/K)N (Pineda-Krch et al. 2007), and the state-change vector is given by ν = (+1, −1). Assuming b = 2, d = 1, K = 1000 and X(0) = (500), the initial state vector, the statechange matrix, and the vector of propensity functions can now be defined in the GillespieSSA framework as R> R> R> R>
parms x0 nu a
tf method simName out
+ + R> + + + +
parms
U N x0 names(x0)


![[PDF] Stochastic Simulation - Google Sites](https://m.moam.info/img/260x300/pdf-stochastic-simulation-google-sites_64784de5097c4786708cac85.jpg)


![Gillespie - The Relevance of Algorithms - CiteSeerX [PDF]](https://m.moam.info/img/260x300/gillespie-the-relevance-of-algorithms-citeseerx-pd_647d0963098a9e74488b459f.jpg)

