areas: A case study of Prague's environment extended by LIDAR data", Ecological Modelling xxx (2006) xxxx - xxxx, www.elsevier.com/ locate/ ecolmodel. 67.
ENGINEER- Vol. XXXXI, No. 05, pp. 59-67, 2008 © The Institution of Engineers, Sri Lanka
GIS Modelling with Rapidly Changing Data sets an Application of Model Builder to Assess Public Accessibility in Colombo City S D Udayasena and N T S Wijesekera Abstract: Geographic Information System modelling with rapidly changing datasets requires systematic development of analysis sequences incorporating sufficient details and establishing flow of each process. Absence of a structured approach would consume a significant time for recalculations to accommodate datasets that require consistent and frequent updating. A typical case is the modelling of the spatial variations of the accessibility in a specific land extent based on zoning changes, unwelcome incidents, national or local ceremonies etc. Apart from such dynamic data the relatively static data such as land use, road network admin boundaries become a part of a GIS model's base data set. A GIS modeller needs the vision to structure a particular application enabling the generation of output maps on each occasion of changes affected either to one, a few or all data layers. Hence it is of great importance to identify the method, strengths and weaknesses of such an application. ModelBuilder is a component of ArcGIS software which enables creating, editing and management of GIS models. There are two basic application methods. One is the capability enabling exploratory project works, and the other includes the development of generic tools that would be reused and shared. The ModelBuilder creations enable the visualization and exploration of results in ArcMap/ArcCatalogue. The ModelBuilder also facilitates the changes of parameter values, rerun selected processes, add or delete processes and intermediate data. The present work is an application of ModelBuilder to assess the spatial variability of accessibility in the city of Colombo. Data sets of 1:50,000 scales were used with ArcGIS software. The systematic development of ModelBuilder assembly and the potential of GIS modelling results generation with ease for varying data layers. Situations are demonstrated. These types of applications enable the public to identify locations suitable for access as a result of various scenarios such as public rallies or public unrest situations which may not be predictable, or due to scenario which may periodically occur within a day such as morning and evening, evening office rush periods, or school traffic durations. Therefore, this ModelBuilder application would help resource managers to customize spatial data set based models to facilitate rapid and rational decision making.
1.0 Introduction
modelling efforts, it is of great importance that model inputs are suitably adjusted whenever changes have taken place.
Geographic Information Systems are cutting edge information technology tools that facilitate the modelling of geographic information to arrive at rational decision making. In case of geographic data modelling or commonly known spatially distributed modelling, there are two kinds of data. They are relatively static data and dynamic data. The relatively static data are such data that can be taken as static within a short time span of about six months or one year. Data corresponding to places of public safety mobilization, similar to locations of meetings, incidents, movement of working population in and out of cities etc., falls into the category of dynamic. Sometimes even zoning demarcations fall in to the category of dynamic data. In
GIS model inputs can change in many ways. The geometric feature and their attributes may vary in one layer or in many layers, thus causing a modeller to perform many operations repeatedly to achieve the appropriate output. In case of real life scenario modelling in GIS, a modeller has to carryout many operations Major S D Udayasena RSP, SL Army Geographic Information for Strategic Defence Applications, Centre for Research & Development, Ministry of Public Administration, Defence, Law and Order, Army Cantonment, Panagoda, Homagania, Sri Ljinka Eng. (Prof.) N.T. Sohan Wijesekera B.Sc. Eng. Hons.fSri Lanka), i'G.Dip (Moratuwa), M.Eng.(Tokyo),D.Eng. (Tokyo), MICE(LIK), FIE(SL), Chartered Civil Engineer, Department of Civil Etigineering, University of Moratuwa, Katubedda, Moratuwa, Sri Lanka
59
ENGINEER
Colombo city often experiences unwelcome incidents such as public meetings, political rallies or protests etc. They are often treated as unwelcome incidents by many, because of the traffic congestions created by such incidents which are unacceptable due to loss of time and increase of fuel expenditure. If a decision-maker could identify the effects of changes causing public accessibility in a geographically distributed manner, then there are opportunities to provide many rational resource mobilization solutions. The case study using information of land use, road network, administration boundaries etc as static data and unwelcome incidents as dynamic data, applies a conceptual GIS model to assess the accessibility. The case study application is carried out with and without the model builder in order to critically evaluate advantages in the use of ModelBuilder for GIS modelling.
involving both single layer and multilayer computations to arrive at acceptable results, which require great care. Such GIS work consumes significant time. Once a particular GIS model is developed scientifically, then changes in the geographic environment would cause only a change in the base data while the process would remain constant. A decision maker therefore, would expect the analysis of a particular system at a very short time if only a few changes for the base data are to be incorporated. Under these circumstances a modeller needs to find ways to customize his/ her model in such a way that once changes are made to the base data, the execution of processes would take place with minimum time. The model builder of ArcGIS software is a tool that enables model components to be first defined as input output modules consisting of process operations and then facilitating the combining of components to a single system. In this assembly, the system flow direction and sequences are clearly defined and therefore, once a system is designed to operate with ModelBuilder tool, it would function efficiently when changes to base data are effected. There are many advantages of using model builder listed in literature. Along with significant easiness to work, use of model builder would also ensure that the GIS databases adhere to the rules of operations, the process sequence would be made fixed and static, would be specially declared, would enable making changes, to each and every component to a section of the model without causing much labour to others, and would enable easy parameter or layer changes with reliability, (http://www.esri.com, http://www.nysgis.state.ny.us [1]) In ad hoc model computations on ArcGIS platform the incorporation of a unique process with a set of base data is not possible. Therefore, repetitive model computations in an ad hoc system would consume a significant time thus making calibration and verification of complex model a cumbersome task. Though it seems obvious that the advantage of model builder is in the saving of time and its reliability, there lacks a comparison of time advantage against the conventional, ad hoc, step by step modelling while attempting to incorporate a real life case study. The present work is a case study of Colombo city accessibility in an environment of changing unwelcome incidents. ENGINEER
2.0 Objective Objective of the study is to develop a GIS model for the assessment of public accessibility in Colombo city with and without incorporation of ModelBuilder tool and to make a critical evaluation.
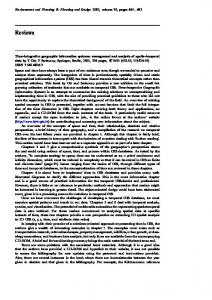
3.0 Study Area Colombo the Capital of Sri Lanka is located on the west coast of the country. Colombo city lies in between 07° 12' and 07° 20' of North latitude, and between 80° 11' and 80° 14' of East longitude. Colombo is considered heavily urbanized when compared with the rest of the country. With the recent security concerns, the law enforcement officials have incorporated a modified boundary for Colombo zoning. Since accessibility studies too need to be closely linked to security, the present study considers that the boundary of the law enforcement units as the study area. In the North, study area is bounded by the Kelani River, West by the sea, South by Dehiwala, Esat by Sri Jayawardanapura and Kolonnawa DS divisions. The study area (Figure 1) consists of 02 complete Divisional Secretary administrative units called DSD. Many important roads and rail communication systems link the Colombo city to other parts of the country. Total spatial area covered by Colombo city is approximately 42
60
The traffic congestion experienced in most roads of the area is considered as extremely high and this is specially during office and school hours. The city's commercial centre Fort and Pettah are considered locations that should be avoided at any time of the day except late night in case if one desires to access a location in these areas. Locations such as Maradana, Borella, Town Hall, Maligawatta also fall in to such category. There are many cricket stadiums, theatres and public meeting places such as Torrington Square and Hyde Park Corner, which attracts a significant number of public and private vehicles creating accessibility problems. The present study covers the accessibility of the road network in relation to the unwelcome incidents that occur at or adjacent to the road network.
Figure 1: Study Area Map
4.0 Methodology km2, tarred road network of 285 km (Table 2) serves a total resident population of about 710,000 and an approximate migrant population about 2 million.
The methodology flow that of the study area is shown in Figure 2. Model concept development included identification of the objective function for the assessment of road accessibility. Accessibility is concerned with the opportunity that an individual at a given location possesses to participate in a particular activity or a set of activities. Accessibility is usually measured in
The land cover distribution and the road distribution in -each of the administrative divisions within study area are shown in Table 1 and Table 2.
Table 1: Land cover Distribution in each of the Administrative Divisions Item 1 2 3 4 5 6 8 11 12 14 16
Description Built up A rea Canals (wide) Water Garden Gras s land/Scrub Jeep or Cart Track MatnRoad(A)snd(B) Minor Road Paddy Sand/B-aci i / Marsh Transport & Utilities Total
Colombo 579 0.10 1.15 5.62 0.39
0.49 2.86 0.14 0.59 0.72 17.84
DSD Tlumbir iga syaya 7.37 0.19 0.02 9.05 0.46 0,07 0.82 3,62 0.26 0.52 22.38
Percentage Koloiuiawa 0.01 0.06 0.08 0.99
0.09 0,09 0.66 0,10 2.09
Total Aiea(sqkm) 13.17 0.35 1,25 15.66 0,85 0.07 140 6,57 1.06 1.21 0.72 42.32
o* 31.13% 0.83% 2.95% 37.01% 2.01% 0.17% 3.31% 15.52% 2.51% 2,86% 1.70% 100.00%
Table 2 : Road Distribution in each of the Adminisrative Divisions Item 1 2
Road Class Main Roa ds Minor Roads Total Length
Colombo 12.34 108.56 120,90
DSD (km) Thimbu ij;d •syaya 18,95 136.76
Kolowaawa 281 5 37
155,71
8,18
61
Total 34,10 250.69 284 79
Percentage 11.97% 88.03% 100.00%
ENGINEER
the accessibility. In this study, a GIS model computes spatial accessibility indicator for land parcels in the study area through simple overlay computations. In the GIS model the spatial accessibility indicator was taken to be directly proportionate to the population density, road network distribution, land use, Entry Exit points and spatial distribution of the unwelcome incidents. A questionnaire survey was carried out to identify the existence of other parameters which governs accessibility indicators. Users were requested to rank the parameters according to the influence on accessibility. A sample of 51 persons who move in and out of Colombo city and who frequently access Colombo were involved for the survey. Users indicated parameters and their importance are as shown in the Table 3.
Resear Question
figure 2 : Methodology Flow Chart terms of travel distance, time or cost. (Zhu et al [2]). A literature survey revealed that accessibility depends on the road network, land use, constraints on road network, population distribution and terrain ( Michael et al [3]) In a spatial assessment of accessibility, if one would identify an accessibility indicator that could be assigned to land parcels which have to be crossed between the source and destination, then the sum of individual land parcel accessibility indicator over the spatial units crossed by the travel route would be indicating
Ratio Estimation Procedure (Jacek [4]) was used to compute the normalized weights for each parameter and these values were used in the model to incorporate relative difference in the influence during overlay operations(Table 4). Each influencing parameter characteristic was extracted from base data layers (TableS) to develop individual data layers for each parameter. As threshold influence values corresponding to spatial zoning of the selected parameters were not available, and especially because such variations depend on the locality and users.
Table 3 : Influencing parameters and the Ranks Item 1
Influencing Parameter Waterways
Data
Rank
Data Layer Description
5
1:50,000 digital maps by the Survey Department
2
Entry Exit Points
3
Population Density
4
Point
Population and land cover maps (1:50/300 digital maps by the
4
Road Network
2
Polygpn
Field survey map for Entry Exit Location (scale 1:10/500)
3
Attributes
Type Area
Length Location Size (strength) Total Population
Polygpn
Area
Urban Development Authority)
Land Cover Type
1:50,000 digital maps by the
Class A Class B
Survey Department
Line
Jeep Cart Tracks Rail Roads
5
Unwelcome Incidents
1
Web details (scale 1:250/500)
6
Law Enforcement
6
1:50,000
Boundary
ENGINEER
maps
by the
Enforcement Agencies
62
Point Law
Polygpn
Incident Type Boundary
Table 4 : User assigned Weight computatuions using Ratio Estimation Pricedure Responses/Preferences Item
Parameter
Rankl
Rank 2 Rank3
6 1 2 3 4 5
Incidents Roads Population Entry Exit Points Waterways
4
5 4 26 5 7 6
31 6 4 6 8
Rank 4 RankS Rank 6
3
5 7 26 4 2
1
2 rj
2 5 5 23 3
Ratio Original NormaScale Weight lized Weight
5 4 5 2 4
o
2 5 8 27
1.59 1.42 1.20 1.14 1.10 6.34
243 217 183 174 153
0.25 0.22 0.19 0.18 0.16 1.00
Table 5 : Spatial Zoning of Data Layers Influencing
Data Rink
Item
Data Layer Description
Attributes Type
Parameter 1
Waterways
5
1:50,000
digital
maps
by
Area
the P oly gpn
Length
Surve y D epart ment 2
Entry Exit Points
4
Location
Field survey map for Entry Exit Point
Size (strength)
Location (scale 1:10,000) 3
Population Density
3
Total Population
Population and land cover maps (1:50,000
digital
maps
by the
Polygon
Urban Development Authority) 4
Road Network
2
1:50,000
digital
maps
by
Area Land Cover Type
the
Class A
Survey Depart ment
Class B Line Jeep Cart Tracks Rail R.oa ds
5
Un welco me Inci dents
1
Web details (scale 1:250,000)
6
Law Enforcement
6
1:50/500
maps
by
the
Point Law
Incident Type Boun dary
Polygon Boundary
Enforcement Agencies
The determination of spatial variation pertaining to each layer characteristic was identified through the user survey. Spatial zoning of each layer that was determined through an analysis of responses, is shown in Table 5. Each layer was zoned into a several quantitative classes. In the Table user percentage indicated the frequency of user responses corresponding to the selection of a particular spatial zoning. In the direct overlay method, Each layer was reclassified and GIS overlay using georeferencing tools of ArcGIS was carried out to arrive at the Accessibility Indicator layer.
a time count was taken at each operation to facilitate comparison. In both methods the GIS modelling used weighted averaging method to quantitatively assess a combined effect of selected data layers.
5.0 Model Builder Conceptual model components identified for the direct overlay method was systematically taken into the model builder tools. The model building units in ArcGIS are coded as input output units and they require clear instructions to perform computations. Each unit of ModelBuilder, facilitated menu driven operations through the identification of input output parameters, input data and output storage locations on the spaces allocated in the
Since the objective of the work was to identify the difference between the direct overlay method of ArcGIS, and the use of ModelBuilder, 63
ENGINEER
6.0 Results and Discussion 6.1 Result of user survey with respect to data layer preferences and the computation of weights for the GIS overlay model is shown in Table 3. The computed weights indicated a 25% and 22% value for incidents and roads respectively. Since the influence of waterways on accessibility of a particular land parcel is relatively small, the user rank was the lowest for the waterways dataset.
*::t3-
6.2 Spatial zoning of various parameters are dependant upon the stakeholder opinion through a judgemental assessment could be made based on common knowledge, available literature and experiences with respect to other spatial references. Therefore suitable stakeholder surveys should be carried out using well designed questionnaire (Tan,[5]). The present study incorporated a sample of 51 persons for the values used in the computations. Appropriate and suitably identified samples satisfying the objectives must be used for similar studies. The present study used a judgemental approach together with a frequency analysis of user responses to identify spatial zoning parameters for the model. The user frequency values obtained for each parameter are shown in Table 5. In case of population, the natural breaks of the spatial data frequency of population in Grama Niladari Divisions (GND) was utilized. The details such as land cover and population can use the parameter values of data occurrence frequency for spatial zoning. These capabilities are available in off the shelf GIS software.
Figure 3 : Process Flowchart, Model Buider
GUI of each element. This enabled an easy assessment and an easy assembly of model flow chart which had a drastically reduced process flow diagram when compared with that of the direct operation method. The ModelBuilder assembly ensured clarity and easy manoeuvrability thus ease of operation. Each assembly was checked for logical functionality, process execution error, and accuracy of results, in a stepwise manner. This methodology was proved as the best option for easy project completion. ModelBuilder standard colours were used to ensure clarity of model process identification. The process model on the ModelBuilder is shown in the Figure 3. During each computational step, ModelBuilder computation results were compared with the direct overlay method and the operational errors and process errors were verified for accuracy and differences. Result at each operation was compared through a comparison of feature numbers at the end of each land mark process. The landmark process comparison revealed that the results had no differences. The landmark process of selected for comparison are listed in the Table 6.
Table 6 : Landmark process of selected for comparison Item
Landmark Process for comparison
1
Base data layers clipping with project boundary.
2
Assigning of respective Buffer distances to prepared base layers . Prepared data layers again clipping with project boundary. Each overlay operation (Union) and output feature. Final result Modification to attribute table and rerun the selected process
3 4 5
6
ENGINEER
64
Verification
Visual checks and attribute table values check earned out forthe verifications of number of polygons, area and distances etc.
satisfactory towards the achievement of reliable results.
6.3. Land mark process locations were identified for model accuracy checks. This enabled the checking of computations, base data layers and the model structure. At the end of each land mark process, the results were compared visually and also through checks on the number of polygons, areas and distances. Manual methodology results were compared with the ModelBuilder calculations and this enabled a mutually beneficial model check for both methods thereby ensuring computation and result accuracy. Present work identified five land mark processes where a direct flow of computations up to the end was checked. Land mark 6 was taken to carryout the performances of the model after a parameter modification. Land mark locations and their brief descriptions are shown in Figure 3 and Table 6. As the model computations and process flow accuracies are very important components when modelling the reality, it is necessary to have cross checks for model performance. The method used in this work which iteratively carried out mutual checks was on both methods found very
6.4 Computation time assessment of model builder method and manual method are shown in Table 7a. The assessments were approximate assessments based on user logs. Comparison of time consumption for model development shows a lesser number of days required for the manual method (Table 7b). During repeated model runs, the model builder showed a significant advantage (Table 7b). This indicates the importance of a tool such as model builder for real life applications, where parameter changes or conceptual model changes need to be affected whenever organizational hierarchy requirements insist on CIS project improvements. ModelBuilder tool required 3/2x100% more time during model development and carrying out a single model run. In case of repeated computations the model builder consumed only about 12% of the time required for a dataset modification and a manual GIS calculations.
Table 7a - Time Consumption comparison - Model Development No
Time Consumption
Process
Manual Method 1 2 3
4 5
Development of ModelBuilder application Preparing of initial GIS layers (Clipping to project boundary) Defining of Buffer Distances a. Layer 1 b. Layer 2 c. Layer 3 d. Layer 4 e. Layer 5 Overlay Operations Get the Final Result Total Time for preparatory works and initial Result
ModelBuilder Method
-
2 1/2 Days
6hrs
3 hrs
Ihrs 1 hrs Ihrs Ihrs 1 hrs 6 hrs 6 hrs 2 Days
3 hrs
3 hrs 3 hrs 3 Days
Table 7b - Time Consumption comparison - Repetitive Model Computations No 1 2 3
Type of modification
Manual Method
Parameter changes and three process rerun (rerun the Process 3. a, 4 and 5, see Table 7a) Parameter changes and seven process rerun (rerun the Process 3.a,b,c,d,e, 4 and 5, see Table 7a) Rerun the entire process for result after modification in selected process (rerun the Process 3.a,b,c,d,e, 4 and 5, see Table 7a)
65
13 hrs (1 hrs+ 6 hrs+6 hrs) 17 hrs (5 hrs+ 6 hrs+6 hrs) 17 hrs
ModelBuilder Method 10 minutes 20 minutes 30 minutes
ENGINEER
6.5 Computed accessibility indicator values for various land parcel extents is shown in Figure 4. Figure 6 shows that for the selected incidents, the accessibility indicators on a three class qualitative grouping has 23% for Low accessibility regions within the study area. The accessibility indicator status averaged for each Grama Niladhari Division shows that out of 74 GN divisions, 23 very low accessibility. 6.6 The ModelBuilder output for a different set of incidents is shown in Figure 5. The computations consumed 30 minutes Figure 6 : Low accessibility regions within the study area
A
minimum for data layer modifications, overlay operations and output map generation. This indicates the ease in the use of model builder when the data set is changed to suit dynamic concerns of the base data.
7.0 Conclusions 7.1 GIS model development to identify stakeholder requirements, should utilize appropriate methodologies to identify parameter prioritization and spatial zoning requirements with a suitable incorporation of stakeholder input assessments and state of the art methodology.
Figure 4: Computed Accessibility
7.2 The study with the use of a mutually beneficial checking of land mark process ensured the reliability of model computations. 7.3 Though GIS database preparation and model development in both methodologies consume similar time periods, repetitive computational requirements are better dealt with ModelBuilder tool. 7.4 GIS model developed to compute the spatial variability of accessibility indicator displayed the potential of ModelBuilder tool to save significant time during real life applications for spatially distributed resource planning and management. Figure 5 : The Mode Builder output for a different set of incidents
ENGINEER
66
8.0 R Janssen, H Goosen, M L Verhoeven, J T A Verhoeven, A Q A Omtzigt and E Maltby, "Decision support system for wetland management", Environmental Modelling & Software 20(2005)215-229, www.elsevier. com / locate/envsoft
7.5 Study clearly indicated the speed at which the model builder could incorporate a change in the incident layer.
8.0 Acknowledgement
9.0 Laurel McSherry, Fredrick Steiner, Izzet Ozkeresteci and Shilpa Panickera. "From knowledge to action: lessons and planning strategies from studies of the upper San Pedro basin", Landscape and Urban Planning 74(2006)81-101, www.elsevier.com /locate/ landurbplan
The authors wish to extend sincere appreciation of the encouragement given by the management and the staff of Ministry of Defence, and the Centre for Research and Development to publish this work. Support of the ICGAT of University of Moratuwa and its staff is gratefully acknowledged.
10. Chun Lin Lee, Shu Li Huang Shih Liang Chan." Biophysical and system approaches for simulating land use change", Landscape and Urban Planning 86(2008) 187-203. www.elsevier.com/locate/landurbplan
9.0 References 1.0 http://www.esri.com/library/ whitepapers/ pdfs/model_bldravsa2.pdf, http:// www.nysgis.state.ny.us/coordinationprogram/ workgroup s/wg_7/ meetings/ stat9_07.html Visited, 12th July 2008
11. Marti Nadal, Vikas Kumar, Marta Schuhmacher, and Jose L Doming, "Definition and GIS based characterization of an integral risk index applied to a chemical/petrochemical area", Chemosphere 64 (2006) 1526 -1535, www.elsevier.com/Iocate/ chemosphere
2.0 X. Zhu , Liu S and Yeow M C, " A CIS Based Multi Criteria Analysis Approach to Accessibility Analysis for Housing development in Singapore" ,The National biennial Conference of the Spatial Science Institute, September 2005, Monash University, Melbourne, pp. 2
12. Atulya Nagar and Hissam tawfik, "A Multi Criteria Based Approach to Prototyping Urban Road Networks", Intelligent and Distributed Systems Research Laboratory, Liverpool Hope University, Liverpool, UK
3.0 Michael Black, Steeve Ebener, Patricia Najera Aguilar, Manuuel Vidaurre & Zine El Morjani, "Using GIS to Measure Physical Accessibility to Health Care", World Health Organization ,pp. 3 4
13. Carlos de la Espriella, "Designing for equality: Conceptualising a tool for strategic territorial planning", Housing Development & Management (HDM), Lund University, Sweden. Habitat I n t e r n a t i o n a l 31(2007) 317-332. www.elsevier.com/locate/chemoshere
4.0 Jacek Malczewski, "GIS and M u l t i c r i t e r i a Decision Analysis", Department of Geography, University of Western Ontario, 1999, pp. 177-189
14. Lubos Matejicek, Pavel Engst, Zbynek Janour,"GIS based approach to spatio-temporal analysis of environmental pollution in urban areas: A case study of Prague's environment extended by LIDAR data", Ecological Modelling xxx (2006) xxxx - xxxx, www.elsevier.com/ locate/ ecolmodel
5.0 Willie Tan, "Practical Research Methods",2nd Edition, Jurong, Singapore, 2004 6.0 Ch. loannidis and K Th. Vozikis "Application of a GIS fro the Accessibility of Archaeological Sites by Visitors with Disability and Visitors with reduced Mobility", XXXI International CIPA Symposium, 01-06 October 2007, Greece p. 2 7.0 Hongcheng Zeng, Ari Talkkari, Heli Peltola and Seppo Kellomaki, "A GIS based decision support system for risk assessment of wind damage in forest management", Faculty of Forestry, University of Joensuu, Finland. Environmental Modelling & Software 22(2007)1240-1249, www.elsevier. com /locate/envsoft
67
ENGINEER