GIS Representation for Visualizing and Mining Geographic Dynamics May Yuan1 and John McIntosh2 Department of Geography, University of Oklahoma Norman, OK 73019; email:
[email protected] 2 Master Program in Geographic Information Science, University of Redlands Redlands, CA 92373; email:
[email protected] 1
Introduction Geographic dynamics refers to the development of processes that shape our environment. While geographic dynamics is central to geographic understanding, the current GIS technology is incapable of capturing information that reflects the working of geographic processes, such as spread of a wildfire, development of a weather system, and propagation of a disease. Inability to represent geographic dynamics excludes GIS capability to mine information about spatiotemporal behaviors which can lead to new insights into understanding evolution and influences of geographic processes. Since geographic dynamics is, by definition, spatial and temporal, GIS data models must be able to handle temporal information to represent geographic dynamics. The current GIS data models organize data based on how data are collected. Because geographic data are collected at a location or from an area, GIS data objects are centered at location and geometry. Geographic semantics (meanings) of a location are considered as attributes of the location. When time becomes necessary, geographic semantics of the location will be updated accordingly. However, geographic dynamics requires an alternative approach to represent geography. One popular approach to discern geographic dynamics is through visualization: animate snapshot views of the process in a time sequence. In an animated view, the user identifies an object of interest and keeps track of its development. To automate identification of geographic dynamics in GIS, the alternative approach shall simulate the visualization process to represent geography. The focus should be placed upon geographic semantics that corresponds to processes. GIS data models should maintain spatial properties and attributes of these processes over time, and hence represent geographic dynamics. In doing so, GIS can provide direct support to analyze and visualize spatiotemporal behaviors of processes, retrieve and compare geographic processes, and understand the dynamics involved in geography. This white paper outlines an alternative approach that directly represents geographic dynamics in geospatial databases and provides demonstrative examples of how the alternative geographic representation can facilitate visualization and mining geographic dynamics. Representation of geographic dynamics and geospatial data mining Effective and efficient access to data is critical to the development of scientific data stewardship (Trenberth et al. 2002). In today’s data rich environment, many data servers offer advanced and attractive graphic user interfaces to allow geospatial data access through specifying themes, locations, and time of interest. Distinct examples are the geospatial one-stop portal, the geography network, and numerous map servers on the web that provide convenient and powerful tools for data access. However, the needs to specify themes, locations, and/or time of
interest limit the user to search for data of known significance. This mode of data access is a consequence of how geospatial data are acquired and how geography is represented digitally. With the access mode, the user must have prior knowledge about what data they are looking for and have an idea about what geographic themes, locations and periods will be worthy of investigation. Complimentarily, the emerging informational science offers an alternative scientific practice that emphasizes scientific discovery by digging into massive data sets without prior knowledge of where and when interesting “things” might have had occurred. Various methods of data mining and knowledge discovery have been developed over the years to decipher information from massive data sets through pattern detection, clustering, association, and machine learning techniques (Han and Kamber 2001). However, the level of information that geospatial data mining techniques can discern depends upon how geography is represented in the system. When all geospatial data are tied to cells, points, lines, or polygons at fixed locations, geospatial data mining techniques will be unable to identify how the development of a geographic process (urban sprawl, for instance) interplays with other processes (such as travel patterns) and discover which two cities experience similar growth and heat island effects. One popular approach to enhance the level of information that can be mined is the development of an appropriate science catalog from a data set by finding all events of interest in the data and recording relevant measurement of properties (Fayyad and Smyth 1999). Cataloging techniques have been broadly applied to data services to facilitate data access and distribution. An example is Thematic Real-time Environmental Distributed Data Services (THREDDS) to provide efficient real-time access and effective tools for data analysis from distributed servers (Domenico et al. 2002). The core of THREDDS is the use of Publishable Inventories and Catalogs (PICat) from distributed data servers to enable data visualization and analysis client sites with metadata that provides actual field names, coordinate systems, units, and other data descriptors to facilitate data access. Another example is NASA-sponsored Seasonal to Interannual Earth Science Information Partnership (SIESIP) centers on data that support research in monsoons, El Nino/Southern Oscillation (ENSO), large-scale precipitation, and wind patterns, the Intertropic Converge Zone (ITC), the Tropical Biennial Oscillation (TBO) and associated influences in the tropics and other associated geophysical climate variability. Recognizing that the user may or may not know exactly what data to retrieve, SIESIP has functions to aid the user to identify significant correlations and trends worthy of further analysis before downloading the data (Kafatos 1998). Most notably, SIESIP provides content-based browsing that enables the user to explore phenomena such as teleconnections between El Nino and vegetation cover in Africa by plotting time series and correlations, and statistically derived parameters (Li 1998). This is indeed a marked advance in the informational science in that it provides the user information about how data from multiple regions and periods correlate so that the user can judge if the data will be worthy of downloading for further analysis. Yet, SIESIP lacks functions to handle spatiotemporal behaviors and development of processes. While the cataloging approach takes geospatial data access beyond cells and points, the user and hence geospatial data mining techniques are still limited to a framework of themes, location, and time, rather than spatiotemporal characteristics and behaviors of geographic processes. Without abilities to represent geographic dynamics, geospatial data mining will be incapable of eliciting information that is pertinent to mechanisms and causes of our ever changing world.
2
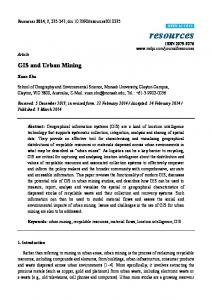
When geographic dynamics can be directly represented, geospatial data access and analysis can target to processes, development, interactions, and cause-effects that are central to scientific discovery and understanding. For example, representation of the jet stream and severe storms will make it possible to develop geospatial data mining algorithms that can seek information like when the jet stream moves south, severe storms tend to develop in the Texas panhandle, move northeast, and develop tornadoes in central Oklahoma. A proposed representation of geographic dynamics The proposed representation of geographic dynamics is based on two principles. First, geographic dynamics can be considered changes at locations or evolutions of geographic entities as described in the three-domain model that offers two-way linkages among semantic, temporal, and spatial data (Yuan 1999). Links from semantics through time to space represents how “something” changes locations over time (such as movement, propagation, spread, etc.) whereas links from space through time to semantics represents histories at locations (such as changes in properties or ownership). The current GIS data models express well the links representing changes and histories, and the proposed representation of geographic dynamics stresses the needs for links that express information about movement, propagation, spread, and all potential spatiotemporal behaviors of processes.
Semantic domain objects representing categories, concepts, entities, events, and processes.
Temporal domain objects representing time instants, intervals, temporal geometry, and temporal topology.
Spatial domain objects representing locations, spatial extent, spatial geometry, and spatial topology.
Links from semantic and temporal objects to spatial objects constrain that an entity exists at determinable locations at a given time. Links from spatial and temporal objects to semantic objects constrain that a location has determinable geographic semantics at a given time.
There are no direct links from semantic to spatial objects because the model assumes that a geographic entity or attribute is contingent on time. A null temporal object can be set to handle data records without temporal measures.
Figure 1: A three-domain view of geography
3
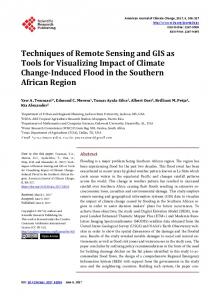
The second principle is built upon the ontology of event, process, sequence, and zone that represent a hierarchy of spatiotemporal aggregation underpinning the representation of geographic dynamics of a given phenomenon (Figure 2). Phenomena are subjects of interest, such as storms, droughts and El Nino. Domain experts provide definitions of phenomena and develop
T4 A group of consecutive time intervals containing at least one process.
Event B T22 T 23
T T1 T2 3T4 T5
Event A
T5 T6 T7 T 8
Consist of Process A A group of sequences related by splits and merges.
Process
T4
T5
T T1 T2 3T4 T5 T5 T6 T7 T
8
Process B
Consist of Sequence B
Sequence
A group of zones meeting a designated threshold that overlap in consecutive time steps. Sequence identification changes when merges or splits occur.
Sequence A
T5 T4
T T1 T2 3
T5
Sequence C
Consist of
Increasing resolution in space and time
Increasing scale in space and time
Event
T5
Zone B
Zone
Area of contiguous grids in a snapshot meeting a designated threshold
Zone C Zone A
T1 T2
T3
Figure 2: The proposed GIS framework of events, processes, sequences, and zones.
hypotheses to explain or model their dynamics. Events are realization or occurrences of phenomena in space and time. An event takes place through multiple stages, and a transition from one stage to another constitutes a process. An event may consist of multiple processes when it occurs at multiple locations at the same time. For example, a rainfall event may be sporadic with several isolated storms. The development of a storm in space and time corresponds to a process. Within each process, mergers or splits may occur, such as two storm cells may become one or vice versa. Each merger or split marks formation of a sequence which indicates an identifiable unit of process development. Finally, within each sequence, there are 4
zones where the properties of interested phenomenon exhibit, such as zones of rainfall where rain is observed. From events to zones, we zoom in to the phenomenon of interest to examine its spatiotemporal characteristics and behaviors at finer resolutions. On the other hand, from zones to events, we zoom out to the phenomenon of interest to investigate its generalized and aggregated spatiotemporal properties at greater scales. Hence, the proposed framework supports spatiotemporal queries at multiple resolutions and scales. We implemented the framework in a relational data structure (Figure 3).
Time Series of Gridded Snapshots Figure 3: Data structure used to implement the proposed frameworkof events, processes, squences, and zones. The solid arrows indicate primary keys to relate tables. The dashed arrows indicate fields that encode relationships among objects within a table.
5
A Case Study Using digital precipitation arrays (DPA) data from the National Weather Service’s ArkansasRed River Forecast Center, we tested the information support capability of the proposed GIS framework. Of particular interest is the support for retrieval of information based on the dynamics of the focal phenomenon, such as the direction of movement and rotation of rain storms in the case study (Figure 4). The case DPA data, around 31 MB, covers the entire state of Oklahoma and portions of surrounding states from March 15, 2000 to June 15, 2000 (Figure 5). In the case study, an event object indicates observations of rainfall in the study area. A process denotes the development and movement of a rainstorm in space and time. A sequence represents a segment of a rainstorm if the rainstorm has experienced mergers or splits. Finally, a zone represents a continuous rain area at a point in time; hence it corresponds to a snapshot of a rainstorm.
Figure 4: Movement and rotation of a rainstorm can be computed by tracing zones, sequences, and processes over space and time.
Figure 5: The coverage of DPAs from the Arkansas- RedRiver Forecast Center.
We implemented the proposed framework and data structure through the development of Avenue™ scripts to incorporate data extraction, query analysis, and appropriate user interfaces in the ArcView® GIS environment (Environmental System Research Institute, Redlands, California). Within the proposed framework, it is straightforward to trace rainstorms at the levels of zones, sequences, and processes because each of these objects has unique identifiers (Figure 2). Therefore, the movement of a storm, for example, can be directly retrieved by specifying its process identifier. Should we be only interested in rainstorms that initiated in southwestern Oklahoma, we can select only those rainstorms that satisfy the criterion through a common GIS query by location. Retrieval of precipitation data can also be based on spatial relationships of rainstorms and a given geographic feature, such as a watershed because spatial and temporal properties of storm processes are explicitly stored in the proposed framework. Below are examples that show how the proposed representation supports data access and analysis based on geographic dynamics of interest: •
Find storms occurring at certain time and duration. We develop a query builder dialog to support queries based on the modeled relationships and object attribute values (Figure 6)
6
Colorado
Kansas Oklahoma
Figure 6: An example of queries on a storm. •
Find storms with similar change from T1 to T2. We develop measures to determine the similarity of storm development based on geometric characteristics and individual distributions. Based on the measures, our system is able to find storms that show similar change (Figure 7) Query results
Input case
Figure 7: An example of query on storms with similar change from two observations. •
Find storms with similar development (from initiation to dissipation). We develop a time warping technique to examine changes along the development of individual storms and measure their difference (similar to gene-sequencing analysis). Below are examples of target storms which are submitted to the system and matched storms which are returned by the system as storms exhibit similar characteristics and behaviors in space and time. In this test, only 20 storms were considered for comparison. Notably, our technique does not require storms with the same duration to be considered as similar. Similarity is mainly judged by a combination of geometry, elongation, movement, distribution (if more than one exists), and evolution (such as split or merge).
7
Example 1:
Example 2:
8
Concluding remarks Representation of geographic dynamics is of critical importance to advancing information support beyond how data are collected to how data are related to real-world events and processes. Conventionally, GIS data models organize geospatial data based on sensors, themes, spatial extents, and time. The user needs to have prior knowledge about a region and time of significance to know what data to look for. Alternatively, we argue for the need of information support that forces the user to focus on (1) what events may be of interest or (2) how events may be related in space and time. Algorithms can then be developed to mine information based on identified events or types of events to facilitate understanding of geographic dynamics. With the representation of geographic dynamics in a GIS, we are able to search for processes with specific spatiotemporal characteristics, visualize how processes evolve in space and time, and identify processes that exhibit similar spatiotemporal behaviors as shown in the case study. However, the case study only presents one phenomenon. When more than one phenomenon is considered, data mining algorithms can be developed to discern relationships of the phenomena in space and time. For example, a geospatial mining algorithm may detect an association between El Nino and droughts in the last 50 years of climate data: when El Nino extends to Indonesia, droughts in the Ohio Valley intensify and expand. Hence, we believe that the ability to represent geographic dynamics digitally can greatly enhance GIS utilities in scientific inquiry and understanding. Representation of geographic dynamics will enable GIS query and analysis support to go beyond emphases on “attributes and locations” to “events and processes” that offer new insights into our dynamic world. 9
References Domenico, B., J. Caron, E. Davis, R. Kambic and S. Nativi (2002). "Thematic Real-time Environmental Distributed Data Services (THREDDS): Incorporating Interactive Analysis Tools into NSDL." Journal of Digital Information 2(4). Fayyad, U. M. and P. Smyth (1999). "Cataloging and Mining Massive Datasets for Scientific Data Analysis." Journal of Computational and Graphical Statistics 8(3): 589-610. Han, J. and M. Kamber (2001). Data Mining:Concepts and Techniques. San Francisco, CA, Morgan Kaufmann Publishers. Kafatos, M. W., X.S.; Li, Z.; Yang, R.; Ziskin, D. (1998). Information technology implementation for a distributed data system serving Earth scientists: seasonal to interannual ESIP. Tenth International Conference on Scientific and Statistical Database Management. Li, Z. W., X.S.; Kafatos, M.; Yang, R. (1998). A pyramid data model for supporting content-based browsing and knowledge discovery. Tenth International Conference on Scientific and Statistical Database Management. Trenberth, K. E., K. R. Thomas and T. W. Spence (2002). "The Need for a Systems Approach to Climate Observations." Bulletin of the American Meteorological Society 83(11): 15931602. Yuan, M. (1999). "Representing geographic information to enhance GIS support for complex spatiotemporal queries." Transactions in GIS 3(2): 137-160. Yuan, M. (2001). "Representing Complex Geographic Phenomena with both Object- and Fieldlike Properties." Cartography and Geographic Information Science 28(2): 83-96.
10