assay, we incubated hfq-Flag lysate, without crosslinking, with magnetic beads carrying no M2 Anti-Flag antibody (Beads only). * Bands of M2 anti-Flag ...
Molecular Cell, Volume 63
Supplemental Information
Global Mapping of Small RNA-Target Interactions in Bacteria Sahar Melamed, Asaf Peer, Raya Faigenbaum-Romm, Yair E. Gatt, Niv Reiss, Amir Bar, Yael Altuvia, Liron Argaman, and Hanah Margalit
TABLE OF CONTENTS Supp. Figure S1. IP assay of crosslinked and non-crosslinked Hfq-Flag Supp. Figure S2. Reproducibility of the data Supp. Figure S3. Statistical analysis of RNAs by genomic annotation and frequencies Supp. Figure S4. Impact of the identified interactions on gene expression levels of sRNA bound partners Supp. Figure S5. Order of RNAs in the chimeric fragments and analysis of U-tract length Supp. Figure S6. GadF and PspH additional experimental data
Supp. Table S1. Number of fragments in sequencing libraries Supp. Table S2. RIL-seq RNA pairs identified in unified datasets Supp. Table S3. Previously reported sRNA-target interactions recovered by RIL-seq Supp. Table S4. Common motifs identified in sRNA target sequence sets Supp. Table S5. Support of RIL-seq by GcvB experiment Supp. Table S6. Summary of genomic elements identified by RIL-seq Supp. Table S7. Predicted base-pairing between sRNAs and their putative targets Supp. Table S8. List of strains, deoxyribonucleotides and plasmids used in this study Supplemental Experimental Procedures Supplementary References
Supplementary Figures
IP
Unbound
Lysate
Hfq hexamer
* * Hfq monomer
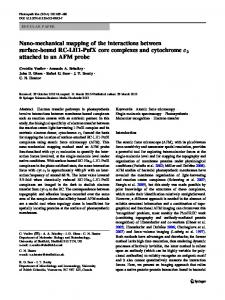
Figure S1 (related to Figure 1). IP assay of crosslinked (CL) and non-crosslinked (nCL) Hfq-Flag hfq-Flag and hfq-WT strains were grown to log phase, the cells were exposed to UV irradiation in order to generate protein-RNA crosslinking or unexposed, and cell lysates were prepared. The lysates were subjected to IP assay using magnetic beads carrying M2 anti-Flag monoclonal antibody. The lysates, unbound fraction and bound fraction (IP) were analyzed by Western blotting using Anti-Flag antibody. As a control for the IP assay, we incubated hfq-Flag lysate, without crosslinking, with magnetic beads carrying no M2 Anti-Flag antibody (Beads only). * Bands of M2 anti-Flag monoclonal antibody light (bottom) and heavy (middle) chains in the IP lanes.
A
B
C
D
Log phase 109
All RIL-seq significant interactions
44 41 47
E 320
177
551
383
80
44 41
177 348
47
325
728
80
one library two libraries three libraries four libraries five libraries six libraries
G Ave. Accessibility Ave. Accessibility
F
Position
Iron limitation 109
Ave. Accessibility Ave. Accessibility
E
Stationary phase
Position
Position
Position
Position
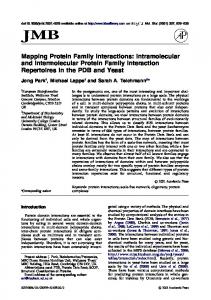
Figure S2 (related to Figure 1). Reproducibility of the data The reproducibility of the results within same-condition libraries was evaluated at the level of single fragments, chimeric fragments and statistically significant chimeric fragments (S-chimeras). (A) The scatter plots compare the sequenced fragments between two respective libraries. Each point in a scatter plot represents the numbers of fragments
mapped to a 100 nt long region of the genome in two libraries. The intensity of the dots in each figure is scaled from blue (small number of fragments) to red (high number of fragments). Each scatter plot below the diagonal shows these results for single fragments. Each scatter plot above the diagonal shows these results for chimeric fragments. Each plot along the diagonal corresponds to a specific library and shows the number of single fragments mapped to each region of the genome vs. the number of chimeric fragments for which one side of the chimera is mapped to the same region. The Spearman correlation coefficients are reported for each scatter plot. log: logarithmic phase libraries. iron: iron limitation libraries. stat: stationary phase libraries. The name of a library includes the condition and number of library, as listed in Table S1. (B-C) Libraries were clustered by the correlation coefficients they have for the single fragment counts (B) and for the chimeric fragment counts (C) with all other libraries. As is clearly seen, same conditions libraries are in general more similar to one another than libraries of different conditions. (D) Re-discovery of statistically significant chimeras (S-chimeras) in individual libraries. The numbers of S-chimeras re-discovered in n libraries (n=1, 2, 3, 4, 5, 6 for log phase libraries; n=1, 2, 3 for stationary phase and iron limitation libraries) are shown. 48%, 56% and 48% of the S-chimeras were revealed in at least 50% of the libraries of log phase, stationary phase and iron limitation, respectively. (E-G) Assessment of ligation bias. (E) Distribution of nucleotides flanking the ligation point (position 0). A weak motif corresponding to the cleavage preference of RNase A was detected (Raines, 1998). (F) Average probability of positional accessibility around the ligation point. The probability of accessibility was computed using RNAfold (Hofacker, 2003). (G) Average probability of positional accessibility for all possible 4-mer sequences at the 5' end and 3' end of the ligated sequences, showing that on average the relative high accessibility probability at the ends is sequence independent. This plot is based on 1,471,227 sequences (5,747 sequences detected in chimeras in log phase, for which all 44 nucleotide combinations at the four last or first positions were tested, i.e. 5747x256 excluding a few sequences that were too short).
sRNA 3UTR IGR cASt RNA NA
hfq-Flag
hfq-wt hfq-WT
B
hfq-wt
hfq-Flag hfq-Flag hfq-Flag
Fraction
Fraction
Fraction
hfq-Flag hfq-Flag
hfq-wt hfq-WT
Iron limitation
Stationary
StationaryStationary
C
hfq-wt
Fraction
A
140,000
Iron limitation Iron limitation
E
200,000 180,000
120,000
160,000
100,000
140,000 120,000
80,000
100,000
60,000
80,000
40,000 20,000 0
sRNA 3UTR IGR cASt oRNA tRNA AS IGT 5UTR CDS
60,000
sRNA 3UTR IGR cASt oRNA tRNA AS IGT 5UTR CDS
40,000 20,000 0
D 200,000 180,000 160,000 140,000 120,000 100,000 80,000 60,000 40,000 20,000 0
sRNA 3UTR IGR cASt oRNA tRNA AS IGT 5UTR CDS
Log (220,319)
Stationary Iron limitation (338,316)
(429,372)
Figure S3 (related to Figure 2). Statistical analysis of RNAs by genomic annotation and frequencies (A-B). Distribution of RNAs in RIL-seq data by their genomic annotations. Single (Single), chimeric (Chimera) and statistically significant chimeric (S-chimera) fragments from the hfq-Flag and hfq-WT stationary phase (A) and iron limitation (B) libraries were classified into nine major categories based on their mapping annotation: 5UTR (5'UTR), Coding Sequence (CDS), 3UTR (3'UTR), tRNA, sRNA (sRNA with at least one known trans target), oRNA (Other small RNAs), AS (AntiSense), IGR (InterGenic Region) and IGT (InterGenic within Transcript). rRNA-derived fragments were filtered out. Fractions are shown (total counts are denoted in parentheses). (C-D) Total number of S-chimera fragments for each combination of genomic elements (the order of RNAs in the chimeric fragment is taken into account) for stationary phase (C) and iron limitation (D) libraries. Mapped IGR fragments were classified as in A with an additional sub-division of the AS category to cASt (cis AntiSence with putative trans target). Bars representing fragments with sRNAs as the first/second RNA in the chimera are colored in dark/light green, respectively. (E) Distribution of sRNAs. The relative fraction of each sRNA within the Schimeras is shown in the three growth conditions. sRNAs are ordered by their occurrence frequency in the log phase. The distributions are based on the number of relevant sequenced fragments. Note that MicC has the value of 0 in all conditions as this is the one sRNA that was not captured by RIL-seq
A ArcZ
RyhB p-value = 5.834e-12 Cumulative frequency
Cumulative frequency
p-value = 0.004
GcvB
CyaR Cumulative frequency
Cumulative frequency
p-value = 1.756e-08 p-value = 2.03e-07
Spf
FnrS
p-value = 0.0015
Cumulative frequency
Cumulative frequency
p-value = 1.96e-06
B
MgrR
RyhB (ribosome profiling) p-value = 1.7e-08 Cumulative frequency
Ribosome occupancy
Cumulative frequency
p-value = 0.09
Log Fold Change
Log Fold Change
Figure S4 (related to Results in the main text). Impact of the identified interactions on gene expression levels of sRNA bound partners (A) Microarray experiments were used to assess the impact of the interactions on changes in gene expression of the sRNA bound partners. These experiments provide gene expression data with and without a tested sRNA (induction of the tested sRNA using a plasmid vs. a null plasmid). Such data were available for the E.coli RNAs RyhB (Masse et al., 2005), CyaR (De Lay and Gottesman, 2009), FnrS (Durand and Storz, 2010), Spf
(Beisel and Storz, 2011) and MgrR (Moon and Gottesman, 2009). We also used data from experiments conducted in Salmonella for the sRNAs GcvB (Sharma et al., 2011) and ArcZ (Papenfort et al., 2009), assuming the sRNAs to have similar effects in Salmonella and in E. coli. Using these data we could test if an identified set of bound partners of a specific sRNA shows larger changes in gene expression compared to all other genes. The scatter plots display the distribution of the log2 fold change of genes vs. their average expression in the experiment. Genes identified as interacting with the sRNA by RIL-seq are marked in magenta. For each gene in each experiment there is a tstatistics of the difference in gene expression with and without the sRNA (calculated by lmFit of the limma packages). The cumulative distribution plots show the cumulative frequencies of the t-statistics values of the interacting partners in magenta and all other genes in black. The statistical significance of the difference between these two distributions is represented as a p-value using Kolmogorov-Smirnov test. For six out of seven sRNAs the change in gene expression of their targets was statistically significantly larger than that of the rest of genes. (B) The same analysis was performed using change in ribosome occupancy data under change in expression of RyhB (Wang et al., 2015), which was performed for testing changes in translation. Here, the cumulative distribution plot shows the cumulative frequencies of the log2 fold change values in ribosome occupancy of the interacting partners (in magenta) and all other genes (in black), and the statistical test was performed on the log2 fold change values. The difference is statistically significant.
A
B
(11,675) cAStcASt (11,675)
3UTR (25,245) 3UTR (25,245)
3UTR (47,011) 3UTR (47,011)
sRNA (429,608) sRNA (429,608)
sRNA (346,521) sRNA (346,521)
IGR (50,426) IGR (50,426)
oRNA (71,300) oRNA (71,300)
cASt (45)cASt (45)
IGR (26,671) IGR (26,671)
oRNA (2,603) oRNA (2,603)
AS (972) AS (972)
CDS (210,427) CDS (210,427)
5UTR (55,388) 5UTR (55,388)
AS (2,113) AS (2,113)
CDS (189,332) CDS (189,332)
IGT (49,243) IGT (49,243)
IGT (38,595) IGT (38,595)
5UTR (204,689) 5UTR (204,689)
tRNA (41,277) tRNA (41,277)
tRNAtRNA (5,309) (5,309) 0% 50% 100% Distribution in S-chimeras
0% 50% 100% Distribution in S-chimeras
C
Figure S5 (related to Figure 5). Order of RNAs in the chimeric fragments and analysis of U-tract length (A-B) Distribution of RNA locations as first (red) and second (blue) in S-chimera fragments for RNAs derived from various genomic elements in stationary phase (A) and iron limitation (B) libraries. Calculation is based on the total number of S-chimera fragments (noted in parentheses). (C) Comparison between the U-tract length of mRNAs and RNAs derived from various genomic elements (included are only RNAs with at least five interactions and mRNAs for which the Rho-independent terminator was annotated in EcoCyc (Keseler et al., 2013). The average U-tract length (indicated by a red line) of sRNAs is 7.14 nt and of putative 3'UTR- and IGR-derived sRNAs is 6.67 nt and 6.3 nt, respectively compared to 4.9 nt in annotated mRNA terminators. p-values computed applying Wilcoxon test with Bonferroni correction: 2.7e-7, 0.005, 0.012, 0.26, and 0.57, for the known sRNAs, 3’UTR, IGR, CDS, and 5’UTR against annotated mRNA terminators).
A
B
Size [nt]
PspH
1500
gadE transcripts
1000
tmRNA WT
500
Δhfq
C 200 GadF sthA
gltA
tmRNA 1
2
tmRNA
3 WT
Δspf
Figure S6 (related to Figure 6). GadF and PspH additional experimental data Additional experiments testing the novel sRNAs GadF and PspH. (A) Northern blot of gadE RNA. Lanes 1 and 2: Total RNA from WT and Δhfq cells grown to stationary phase. Lane 3: RNA co-IPed with anti-Flag antibody from lysate of hfq-Flag cells grown to stationary phase. The probe is complementary to GadF central region. (B) Northern blot of PspH in total RNA extracted from log phase WT strain and from a ∆hfq mutant, both carrying a Spf overexpressing plasmid or a control plasmid (pJV300). (C) Northern blots of sthA and gltA. Total RNA was extracted from log phase WT and Δspf cells, either overexpressing PspH or carrying a control plasmid (pJV300). tmRNA served as a loading control in all three blots.
Supplementary Tables Table S1. Number of fragments in sequencing libraries, related to Figure 1 (Excel file) The table describes the different libraries used in the experiment with their protocol parameters and statistics regarding the number of sequenced fragments. The total number of fragments includes the number of fragments available after quality control, adapter removal and DUST filter application. The RIL-seq computational pipeline was used to evaluate the results of each library separately and the results of the unified libraries per condition.
Table S2. RIL-seq RNA pairs identified in unified datasets, related to Figure 2 (Excel file with a different tab for each condition and a tab for a summary table) The table includes all interactions between two RNAs (minimal number of interactions ≥ 10), which were supported by statistically significant chimeras in the unified datasets. In each condition specific tab, a pair of RNAs might appear more than once if it involves multiple interacting regions or if it appears in the chimera once as RNA1-RNA2 and once as RNA2-RNA1. Coordinates are based on the genome of E. coli K12 MG1655 (NC_000913.2). The table includes data from BioCyCTM pathway/genome database under license from SRI international. Name: Common name of the gene (additional information is included in the EcoCyc ID column). # of chimeric fragments: Number of chimeras supporting the interaction. # of libraries: Number of individual libraries where this interaction was revealed as statistically significant. "U" denotes an interaction that was identified only in a unified library. Odds Ratio: (K/L)/(M/N), where K= Number of chimeric fragments of RNA1-RNA2, L=number of other fragments involving RNA2, M=number of other fragments involving RNA1, N=number of all other fragments (that do not involve RNA1 and RNA2). Normalized Odds Ratio: Odds Ratio multiplied by the relative enrichments of RNA1 and RNA2 on Hfq. Fisher's exact test p-value: pvalue for observing at least this number of chimeric fragments given their background frequencies on Hfq. The Odds Ratio provides the effect size of the test. Free energy of hybridization (kcal/mol): Hybridization free energy values between the two interacting RNAs computed by RNAup (Muckstein et al., 2006). The sRNA and target sequences
were extracted based on the genome coordinates of the chimeras as documented in Table S2: RNA1 start was taken 20 nucleotides upstream the coordinate termed "RNA1 from" and RNA1 end was taken 20 nucleotides downstream the coordinate termed "RNA1 to". RNA2 start was taken 20 nucleotides upstream the coordinate termed "RNA2 from" and the end was taken at coordinate of "RNA2 to". Genomic annotation: e.g. sRNA, CDS, 3'UTR, etc. Description: Description of the gene product, taken from RefSeq. RNA1 from: Position of the first nucleotide of the most 5' chimera mapped to the first RNA. RNA1 to: Position of the first nucleotide of the most 3' chimera mapped to the first RNA. RNA2 from: Position of the last nucleotide of the most 5' chimera mapped to the second RNA. RNA2 to: Position of the last nucleotide of the most 3' chimera mapped to the second RNA. Strand: The genome strand the sequence was mapped to. Other fragments of RNA1: Number of fragments in which the first RNA appears as first, including single fragments. Other fragments of RNA2: Number of fragments in which the second RNA appears as second, including single fragments. Total other fragments: Number of fragments in the experiment excluding the above. RNA1 in total RNA (# of reads): The sum of the number of fragments of RNA1 in total RNA libraries. RNA2 in total RNA (# of reads): The sum of the number of fragments of RNA2 in total RNA libraries. RNA1 IP/Total ratio: (fraction of RNA1 fragments in RIL-seq library) / (fraction of total RNA of RNA1 in total RNA library). RNA2 IP/Total ratio: (fraction of RNA2 fragments in RIL-seq library) / (fraction of total RNA of RNA2 in total RNA library). EcoCyc ID: The accession number of the gene in EcoCyc database. When the RNA was mapped to a region outside a CDS, the name is followed by 5UTR or 3UTR in case it resides in an annotated UTR (in EcoCyc), EST5UTR or EST3UTR if the UTR is unknown and the interaction is 100 nt upstream or downstream the CDS (or shorter if these regions spanned another transcript or were more likely to be a UTR of the neighbouring transcript). Two gene names and IGR or IGT represent a binding region located between two genes in two different transcription units (IGR) or on the same transcription unit (IGT). AS stands for RNA mapped to the antisense of a gene. Code: A unique name assigned to all interactions involving two RNAs, (disregarding the order in chimera and regarding 5'UTR and CDS of a target as one genomic entity). Pairs are
ordered alphabetically. The table is sorted according to RNA2 name and then by the Normalized Odds Ratio. A summary table of all interactions identified by RIL-seq in Log phase, Stationary phase and Iron limitation is presented in a separate tab. In the summary tab, each pair appears only once (disregarding the order in chimera and regarding 5'UTR and CDS of a target as one genomic entity), where all its interactions per a condition were summed. For interactions with known sRNAs or RIL-seq putative sRNAs the sRNA was placed as RNA2, otherwise RNA1 and RNA2 were ordered alphabetically. The free energy of hybridization is the minimal energy out of the identified conditions. "U" in the 'Libraries' columns denotes an interaction that was identified only when in a unified library.
Table S3. Previously reported sRNA-target interactions recovered by RIL-seq, related to Figure 3 (Excel file) Known sRNA-target pairs detected in RIL-seq experiment in the three different growth conditions. For six targets the reads could be mapped either to the 5'UTR of the target gene X or to the CDS of the preceding gene Y. While the RIL-seq automatic annotation originally annotated it to the CDS of gene Y, it was manually assigned to gene X (commented in the table). Of note, there are two known interactions that were each revealed in the individual libraries (MicA-ompW in stationary phase and RybB-fimA in iron limitation), but were not re-discovered in the unified dataset of all interactions per condition, and therefore they are not listed in Table S3 as identified by RIL-seq.
Table S4. Common motifs identified in sRNA target sequence sets, related to Figure 4A-D (Excel file) The table contains ’Complementarity’ and ‘Common motifs’ tabs in excel file: ’Complementarity’ tab - Common sequence motifs in RIL-seq target sets are complementary to binding sites on known and putative sRNAs. Shown for: sRNAs with known binding sites except for MgrR for which no binding site was yet reported and a putative site was revealed by this analysis. Separated by a blank row, putative additional sRNAs derived from different genomic elements are shown. Sequences with the motif (m) - The number of target sequences that shared the common motif; Total number of
targets (n) - The total number of sequences in the target set of the respective sRNA; MEME e-value - The E-value calculated by MEME (Bailey et al., 2009); MAST p-value - The p-value calculated by MAST (Bailey and Gribskov, 1998); Base-pairing of the sRNA and the common target motif - The sequence of the respective sRNA is presented in a complementary orientation below each motif, and known binding sites are marked in green. A vertical line was drawn if at least one of the motif nucleotides matched the corresponding position on the sRNA sequence Note that uhpT.3UTR was identified recently as an independent RNA (Fitzgerald et al., 2014) and that cpxP.3UTR was characterized most recently (Chao and Vogel, 2016; Grabowicz et al., 2016). Logos were created using weblogo 3.4 (Crooks et al., 2004). ‘Common motifs’ tab - Detailed information of the common motifs. MEME was used to test if the targets of a known sRNA or of a putative sRNA have a common sequence motif. The motif was further tested to see if it matches the reverse complement of the sRNA. Target sets where n≥4 across all conditions or in each condition separately were analysed. For each target set (in one condition or across all conditions) we ran the analyses using either the subset of targets that appeared first in the chimera, or the subset of targets that appeared second in the chimera, or using the full set of targets, appearing both first and second in the chimera. Only the best MEME motif for every condition is shown. A condition marked with * indicates that a different MEME motif was chosen for Figure 4A and for the motif visualization in the complementarity tab. The ‘Matches known binding site’ column shows motifs that complemented the known binding site with a MAST p-value ≤0.0001. NMH stands for "No Motif Hit" and is written when the MAST p-value is >0.01. Of note, Rho-independent terminator motifs of the sRNAs were identified as common motifs when a set of sRNAs and/or putative sRNAs interacted with the same target. Detailed explanation about the table content appears in a Legend for 'Common motifs' tab of the excel table.
Table S5. Support of RIL-seq protocol by GcvB experiment, related to Figure 4E (Excel file) GcvB targets identified in both the unified log phase libraries and in libraries of ΔgcvB strain with WT gcvB or gcvBΔR1 plasmid are shown. Targets of GcvB known
to interact through R1 (green) are revealed only with the WT plasmid, while targets known to interact through R2 (blue) are revealed in both WT gcvB and gcvBΔR1, implying RIL-seq captures true interactions. Table S6. Summary of genomic elements identified by RIL-seq, related to Figure 5A (Excel file) The table lists all RNAs that were included in the statistically significant chimeras (listed in Table S2). Each RNA has a single entry disregarding its position in the chimera (first or second RNA). When counting the number of interacting partners of a RNA, 5'UTR and CDS of a target were regarded as one genomic entity, the growth condition it was revealed in or its specific genomic coordinate. The information displayed for each RNA component is detailed in the 'legend' sheet within the table. Table S7. Predicted base-pairing between sRNAs and their putative targets, related to Figure 6A (Excel file) Base-pairing of putative pairs of sRNAs and their targets that were tested using GFP fusions (Fig. 6A) were predicted using RNAup (Muckstein et al., 2006). The sRNA and target sequences were extracted based on the gemone coordinates of the chimeras as documented in Table S2: RNA1 start was taken 50 nucleotides upstream the coordinate termed "RNA1 from" and RNA1 end was taken 50 nucleotides downstream the coordinate termed "RNA1 to". RNA2 start was taken 50 nucleotides upstream the coordinate termed "RNA2 from" and the end was taken at the coordinate of "RNA2 to". The sRNA (bottom) and its targets (top) are oriented 3’->5’ and 5’->3’, respectively. The RNAup predicted paired regions are marked in red and their coordinates are presented in red in the table. The free energy values reported here differ from the ones reported in Table S2 because there the computations were done with padding of 20 nucleotides at the ends of chimeras. Coordinates are based on the genome of E. coli K12 MG1655 (NC_000913.2).
Table S8. Strains, deoxyribonucleotides and plasmids used in this study, related to Experimental Procedures (Excel file)
Supplemental Experimental Procedures Strains and media The bacterial strains used in this study are listed in Table S8. The E. coli MG1655 or TOP10 strains served as wild-type. Strain TM615 carrying hfq-Flag (Morita et al., 2005) was kindly provided by H. Aiba (Nagoya University, Japan). Strain HM33 was constructed by transferring hfq-Flag from Strain TM615 into MG1655 using P1 transduction. Plasmid pCP20 (Cherepanov and Wackernagel, 1995) was used to eliminate the chromosomal cat gene of strain HM33, resulting in the formation of strain HM34. Strain HM43 was constructed by transferring an hfq::kn allele from strain JW4130 of the Keio collection (Baba et al., 2006) into MG1655 using P1 transduction. Strain HM54 was constructed from its parent strain HM34 by the
one-step
inactivation
method
(Datsenko
and
Wanner,
2000)
using
oligonucleotides 234/235 and pKD3 plasmid. Strain HM55 was constructed by transferring the hfq::kn allele of JW4130 strain into strain TOP10 by linear transformation using oligonucleotides 26/27. Strains HM56 and HM57 were constructed by the one-step inactivation method (Datsenko and Wanner, 2000) using oligonucleotides 280/281 and 338/339, respectively, and pKD3 plasmid. To create strains HM64 and HM65, PCR fragments that contained the desired mutations in spf and a cat gene downstream to spf were synthesized, using oligonucleotides 361/363 (HM64) or 362/363 (HM65) and pKD3 plasmid. The PCR fragments were transformed into MG1655 by linear transformation. S. cerevisiae BY4742 was kindly provided by O. Pines (The Hebrew university of Jerusalem, Israel). Bacterial strains were routinely grown at 37 °C in LB medium (Bertani, 2004). Ampicillin (100 µg/ml), kanamycin (45 µg/ml), chloramphenicol (25 µg/ml) or 2,2'-Dipyridyl (200 µM) were added where appropriate. The oligonucleotides used for strain constructions are listed in Table S8.
RIL-seq protocol Experimental procedure E .coli Strains MG1655 and HM34 were grown overnight in LB at 37 °C with shaking (200 r.p.m.), diluted 100-fold in fresh LB, and re-grown with shaking at 37 °C to
log phase (OD600 = 0.5), with or without the addition of the iron chelator 2,2'-Dipyridyl (200 µM, 30 min), or to stationary phase (6 hr). A culture volume corresponding to 40 OD600 per ml was centrifuged and the pelleted cells were washed twice and resuspended in 10 ml of ice-cold phosphate-buffered saline (PBS) (pH 7.4). Next, cells were exposed to 800 mJ of 254 nm UV irradiation (Stratalinker® UV Crosslinker 1800) on a metal block cooled to (-20) oC and then mechanically lysed in a total of 1200 µl Lysis Buffer (50 mM Sodium Phosphate, 300 mM NaCl, 0.1% IGEPAL, 10 mM Imidazole, 0.1 unit/µl Recombinant RNase inhibitor (Takara) and EDTA free protease inhibitor cocktail set III (Calbiochem) diluted 1:200, pH 8.0), using 400 µl glass beads in a Retch MM400 mixer. Cell lysates were cleared by centrifugation and incubated for 1 hr with 20 µl of magnetic beads (Novus Biologicals) in order to reduce the nonspecific binding in the next step. Thereafter the cell lysates were incubated for 1.5 hr with 20 µl of magnetic beads carrying M2 anti-Flag monoclonal antibody (3 µg; Sigma) at 4 °C. As a control, the lysate was incubated with magnetic beads without M2 anti-Flag monoclonal antibody. The lysate was removed and the beads were washed five times with 200 µl lysis buffer at 4 °C. To trim the exposed parts of the RNAs, beads were resuspended in 200 µl of lysis buffer supplied with 0.5 unit of RNase A/T1 mix (Thermo Scientific) without RNase inhibitor, and incubated for 3-15 min at 22 °C or 37 °C. RNase digestion buffer was removed and the beads were washed three times with 200 µl lysis buffer supplied with 0.1 U of SUPERase INTM RNase Inhibitor (Life technologies) at 4 oC. 5’OH ends were phosphorylated and 2'P / 3'P ends were dephopsphorylated by incubation with 40 units of T4 PNK (New England Biolabs) in 80 µl of PNK buffer (Supplied by the manufacturer) for 2 hr at 22 °C. PNK reaction mixture was removed and the beads were washed three times with 200 µl lysis buffer at 4 oC. Neighbouring RNAs were ligated overnight using 216 units of T4 RNA Ligase 1 (New England Biolabs) in 80 µl ligase buffer (Supplied by the manufacturer). Ligation mixture was removed and the beads were washed three times with 200 µl lysis buffer at 4 oC. To release the RNA from Hfq, The beads were treated with Proteinase K (100 μg; Thermo Scientific) in 300 µl Proteinase K buffer (50 mM Tris HCl [pH=7.8], 50 mM NaCl, 0.1% IGEPAL, 10 mM Imidazole, 1% SDS, 5 mM EDTA, 5 mM β-mercaptoethanol) supplied with 0.1 unit/ul RNase inhibitor for 2 hr at 55 °C. RNA was extracted according to the standard LS-TriReagent protocol (Sigma). RNA
concentration was analysed using Agilent Bioanalyzer (Agilent Technologies) and RNAseq libraries were constructed based on RNAtag-Seq protocol (Shishkin et al., 2015) with few modifications. Briefly, RNA was subjected to fragmentation, alkaline phosphatase and DNase treatment. RNA was cleaned-up by RNA Clean and Concentrator 5 kit (Zymo) and ligated to 3’ barcoded adaptors (Table S8). Next, the ligation mixtures were pooled together and the RNA was purified with RNA Clean and Concentrator 5 kit. rRNA was removed using RiboZero (Illumina), and rRNA depleted samples were purified using 2.5X RNAClean XP Beads (Beckman Coulter) and 1.5X Isopropanol. First cDNA strand was generated using SuperScript III (Life Technologies), RNA was degraded and samples were purified using 2.5X AMPure XP Beads (Beckman Coulter) and 1.5X Isopropanol. A second adapter was ligated to the cDNAs 3' end, and the cDNA was cleaned-up twice with 2.5X AMPure XP Beads and 1.5X Isopropanol. Libraries were PCR amplified by HiFi HotStart DNA polymerase (KAPA) using Illumina compatible primers and DNA was purified with 1.5X AMPure XP Beads. Libraries of total RNA were constructed likewise. The libraries were sequenced by paired-end sequencing using Nextseq500 Sequencer (Illumina). It is of note that we applied a few other variations of the experimental protocol which included: replacement of A/T1 RNases with S1 Nuclease, addition of TAP enzyme, or replacement of T4 Ligase 1 with CircLigase™ II. However, as these attempts resulted in lower quality libraries, they are not detailed above. In addition, to estimate the potential bias of in vitro RNA interactions on Hfq (Mili and Steitz, 2004), the E. coli lysate was mixed with a Saccharomyces cerevisiae lysate before the Co-IP. The chimeric fragments containing sequences from both E. coli and S. cerevisiae comprised