Mar 11, 2008 - of a number of regional free trade agreements that lower trade barriers and extend property ..... (http://stats.oecd.org/glossary/detail.asp? ...... China is the export powerhouse, hosting much of the offshoring activity, and India's.
Globalization, Offshoring and Economic Insecurity in Industrialized Countries
William Milberg and Deborah Schöller* Abstract This paper shows that a “new wave of globalization,” involving extensive offshoring, has raised both actual and perceived labor market insecurity in industrialized countries. The paper analyzes various channels through which this new wave of globalization leads to economic insecurity. In particular, it emphasises the key role of overall macroeconomic conditions for spreading and sustaining the potential benefits of offshoring. It discusses and points out the inadequacies of various policy responses that industrialized countries have come up with so far to the challenges of the new of globalization and advocates urgent steps toward formulation of policies and erection of institutional structure more appropriate to confront these challenges.
Prepared for U.N. Department of Economic and Social Affairs March 11th, 2008
*New School for Social Research, USA, and University of Hohenheim, Germany, respectively. Both authors are affiliated with the New School’s Schwartz Center for Economic Policy Analysis. The authors would like to thank Richard Kozul-Wright, Teresa Ghilarducci, Diana Alarcón, Marva Corley, Mariangela Parra and the research staff at UNDESA for comments on a preliminary draft.
Contents 1. Introduction ..................................................................................................................................3 2. Economic Insecurity in Industrialized Countries .........................................................................8 A. Unemployment and Inequality ..............................................................................................10 B. The Burden of Risk................................................................................................................12 C. Perceptions of Economic Insecurity ......................................................................................19 3. The “New Wave” of Globalized Production..............................................................................21 A. Political, Technological and Economic Factors ....................................................................22 B. International Trade and Investment .......................................................................................24 C. Offshoring of Goods and Services.........................................................................................26 4. Globalization and Economic Insecurity .....................................................................................30 A. . Connecting Globalization to Economic Insecurity .............................................................30 B. A Closer Look at Winners and Losers from Offshoring .......................................................31 C. Profits and the Profit Share....................................................................................................33 D. Job Displacement and Earnings Replacement.......................................................................38 E. Trade versus Technology: Skill-Biased Labor Demand Shifts..............................................40 F. Increase in the Elasticity of Demand for Labor .....................................................................45 G. Threat of Job Loss and Wage Suppression ...........................................................................46 5. Conclusion and Prospects for the Future....................................................................................46
1
Figures Figure 1: Share of Manufacturing in Value Added, 1970-2006 (in %) .........................................10 Figure 2: Share of Long-Term Unemployed (> 1 Year) in Total Unemployed (in %)..................11 Figure 3: Strictness of Employment Legislation vs. Labor Support in OECD countries, 2003 ....15 Figure 4: Gross Pension Replacement Rates by Earnings Based on 2004 Rules ..........................16 Figure 5: Government and Private Health Insurance Coverage in 2005........................................18 Figure 6: Number of People without Health Insurance in the US .................................................18 Figure 7: Concerns about Free Trade (in % of Respondents) ........................................................20 Figure 8: The Perception of Globalization (in % of Respondents) ................................................20 Figure 9: OECD Goods Trade with China and India (as % of total OECD Goods Trade)............30 Figure 10: Gains and Losses from Offshoring ...............................................................................33 Figure 11: Labor Compensation (in % of GDP) ............................................................................34 Figure 12: Gross Capital Formation (in % of GDP) ......................................................................36 Figure 13: Dividends plus Share Buybacks as Percentage of Internal Funds,...............................37
Tables Table 1: ILO Economic Security Index ...........................................................................................5 Table 2: Economic Performance, Golden Age versus Post-Golden Age.........................................9 Table 3: Wage Inequality, 1985-2005............................................................................................12 Table 4: Labor Market Policy Indicators .......................................................................................13 Table 5: Strictness of Employment Protection Legislation............................................................13 Table 6: Union Members as share of Total Labor Force (in %) ....................................................17 Tables 7a-b: Exports and Imports of Commodities and Services ..................................................24 Table 8: Offshoring Intensity in Germany, the UK, and the US 1992-2004 .................................28 Table 9: Merchandise Imports by Region of Origin (% of Total Imports) ....................................29 Table 10: Globalization vs. Economic Insecurity, 1991-2005.......................................................31 Table 11: Adjustment Costs of Trade-Displaced Workers ............................................................39 Table 12: Labor Market Effects of Offshoring: Survey of Literature............................................44
2
Globalization, Offshoring and Economic Insecurity in Industrialized Countries William Milberg and Deborah Schöller
1. Introduction How can one dare speak of economic insecurity in the industrialized countries when the rate of per capita GDP in Germany is 120 times that in Uganda, the rate of unemployment in the U.S. is 1/10th of that in Nepal, or when the share of population below the poverty line in France is 1/10th of that in Zimbabwe? The question itself indicates that economic insecurity is a relative phenomenon. Those who are subject to a high risk of a sudden drop in income or wealth without adequate offsetting support are facing economic insecurity, irrespective of nationality or location. Hacker (2006, p. 20) defines economic insecurity as “a psychological response to the possibility of hardship-causing economic loss.” He notes, however, that “a feeling of insecurity is not enough to say someone is insecure. Insecurity requires real risk that threatens real hardship.” By many accepted measures – real wage growth, inequality, labor’s share of national income, the incidence of long-term unemployment, the number of workers displaced by foreign trade and investment – “real” economic insecurity in industrialized countries increased in the past 15-20 years. The period has also been one of rapid globalization, with international trade and capital flows reaching historic highs. The role of globalization in heightened economic insecurity has thus become a major topic of debate in the advanced countries. Throughout the paper we focus on six countries: Denmark, France, Germany, Japan, the United Kingdom and the United States. These countries represent a broad spectrum of the advanced industrialized world, and although all have expanded their exposure to international trade and investment they have not all 3
experienced the same degree of increased economic insecurity. We also find that the perception of economic insecurity is strong in these industrialized countries, especially in the US and in France. The risk from a high level of real – and perceived – economic insecurity in the industrialized countries is borne by both the government and private households. Household consumption and borrowing patterns may reflect the burden of risk on the household private sector. This may partly depend on the private sector’s expectation of government policy. While rising economic insecurity has in some cases resulted in increased demand for state-provided social protection, these demands have met various responses from business and government on the grounds that they raise production costs and reduce a nation’s international competitiveness.1 The new wave of economic insecurity has occurred in a variety of political contexts. Although offshoring2 has increased in all industrialized countries and raised the degree of economic insecurity on average across the OECD, economic security varies considerably across countries, largely depending on the institutions in place. The ILO index of economic security gives the following rankings for the six countries that are the focus of this paper3:
1
See Rodrik (1997) on the increased demand for social protection. Offshoring is defined in this paper the reallocation of production across various geographical locations to benefit from low labour costs and low taxes. In large part, this process has been facilitated by fast technological innovations in telecommunication and low transportation costs. The concept of comparative advantage has been redefined to place the emphasis on the ability of firms to “coordinate a geographically dispersed network of activities.” Levy (2005, p. 685) 3 The index combines measures of job security and social security, where the former includes income security and “voice representation security” and the latter measures “access to basic needs infrastructure pertaining to health, education, dwelling, information and social protection.” See ILO (2004). 2
4
Table 1: ILO Economic Security Index Rank
Country
Economic Security Index
4 Denmark 0.91 7 France 0.83 9 Germany 0.79 15 United Kingdom 0.74 18 Japan 0.72 25 United States 0.61 Source: ILO (2004), Economic Security for A Better World.
As we will see below, German firms have greater investments in offshore production sites than the U.S., and France has a higher rate of unemployment than Japan. But since economic security is affected by the policies and institutions that influence market outcomes, Germany has a higher economic security rank than the U.S., and France ranks higher than Japan. During the 1990s a good deal of research aimed at showing that technological change rather than trade had been the principle source of labor market churning in industrialized countries. This paper revisits this debate in the light of the evolution of the world trading environment, involving emergence of new and larger trading nations in the developing world, development of sophisticated global supply chains driven by lead firms in industry, financialization4 of the non-financial corporate sector in the major countries, and implementation of a number of regional free trade agreements that lower trade barriers and extend property rights protection to foreign investors. This paper addresses three central questions. First, what has been the impact of globalization, and specifically offshoring through trade and foreign investment, on economic insecurity in the industrialized countries? Second, what are the specific microeconomic and macroeconomic channels through which globalization impacts economic insecurity in these 4
The term financialization is used to describe the growing influence of financial markets and institutions on economic growth and development both in the domestic and international markets. It refers to a qualitative change in the operational logic of corporations and business firms away from productive investment and into financial investments where quick and larger profits can be realized (WESS, 2008: 2).
5
countries? Third, what political responses have best addressed rising economic insecurity without inflicting damage on other countries and in particular on the low-income, developing countries whose export performance has been bolstered by the new wave of globalized production? The main findings of this paper are:
Since the mid-1970s most industrialized countries have experienced a rise in economic insecurity, and in many of them the burden of economic risk has shifted from the state and corporations to private households.
There are different models of state-market relations with respect to economic insecurity, ranging from the limited state role in the Anglo-Saxon model to a heavy state role in the Rhineland model and a hybrid model of “flexicurity”5 in Denmark and a few others.
International trade and investment increasingly occur within global supply chains, which have reached a level of growth and depth to constitute a “new wave” of globalization in which trade and technology are inextricably linked to an extent not previously witnessed. Offshoring would be unthinkable without low-cost information technology, and information technology would not be as low cost if not for the effective extension of global supply chains into low-wage countries.
The new wave of globalization has created new sources of gains from trade and new channels for transmission of economic insecurity arising from trade and investment. Moreover, as supply chains extend to high-tech goods and higher-skill services, there are massive possibilities for future expansion of offshoring, indicating that economic vulnerability will rise across all skill and education groups rather than falling entirely on low-skilled workers, as had been the case until recently. 5
The term flexicurity has been used to designate a social security model that includes some flexibility in the labour market for the hiring and firing of workers with high levels of support for displaced workers. It is a model that has been adopted by Denmark, Finland, and the Netherlands.
6
Spreading and sustaining the benefits of offshoring depend on the domestic reinvestment of efficiency gains that offshoring brings. While offshoring has contributed to the rise in profit’s share in the national income of most industrialized countries, they are also witnessing fall in investment rate, as percentage of both profit and GDP. Non-financial corporations are increasingly using profits to raise dividend payments, share buybacks and purchase of other financial assets, rather than making productive investment.
Denmark’s mix of labor market flexibility, ample social protection and active labor market policies – so-called “flexicurity” – has successfully raised economic security in that country despite globalization. The U.S. labor market flexibility, combined with relatively meager social protection in the face of rapid growth of imports from developing countries, has contributed to an unprecedented rise in income inequality and economic insecurity for a large share of the American population.
Given the macroeconomic consequences of offshoring, flexicurity arrangements alone are likely to be insufficient to sustain high levels of economic security in the industrialized world. Trade protection has largely been avoided, but other policies involving redistribution and channeling of gains from offshoring to investment and growth are likely to be more important in the near future, as offshoring expands beyond low-skilled manufacturing workers.
Finally, the provision of a solid and portable set of social protection does not reduce a nation’s trade competitiveness and in fact may raise it as increased worker security leads to greater possibilities for innovation and growth in productivity.
We begin with an overview of recent trends in economic insecurity and the different policy regimes in industrialized countries. Then we consider in detail how globalization and offshoring might have contributed to rising economic insecurity. We conclude with a discussion of the 7
importance of combining creative macroeconomic and microeconomic policies in order to provide more security even as economic openness continues to grow.
2. Economic Insecurity in Industrialized Countries The period from 1950 to 1973 is widely referred to as the “Golden Age” of capitalism, but it may better be termed as the period of rising economic security for people in the industrialized countries. Not only did the OECD countries experience rapid growth in real GDP, but this growth was reflected in rising median wages, even more rapid improvements in median family income, relatively low rates of unemployment, falling inequality, and improvements in the post-GreatDepression system of social protection in most countries. Since 1973 the industrialized economies have grown more slowly, as productivity growth has diminished. As can be seen from Table 2, all six countries in our sample had higher GDP growth rates during 1950-1973 than during 1980-2007. In some cases (for example, Japan, Germany and France) the growth rate fell by more than half. Labor productivity growth follows a similar pattern. Over the entire OECD, total factor productivity growth fell to 1.5% per annum on average after 1985, from rates more than twice that during the twenty years before 1973.6
6
Howell (2004), Table 3.2.
8
Table 2: Economic Performance, Golden Age versus Post-Golden Age (compound annual growth rates unless otherwise indicated) Denmark
France
Germany
Japan
UK
US
Gross Domestic Product 1950-1973 1980-2007
3.8% 2.1%
5.0% 2.0%
6.0% 2.2%
9.3% 2.3%
2.9% 2.5%
3.9% 3.0%
Labor Productivity 1950-1973 1980-2007
2.9% 1.7%
4.7% 1.5%
4.7% 0.8%
7.5% 1.8%
2.4% 2.1%
2.3% 1.6%
Employment-to-Population-Ratio Average 1960-1973 48.5% 1980-2007 50.9%
41.0% 40.2%
45.1% 45.9%
48.1% 49.9%
45.4% 44.8%
38.9% 47.4%
Unemployment Rate Average 1956-1973 1.1%* 1.9% 1.3% 1.5% 1.8% 5.0% 1980-2006 7.2% 10.1% 7.6% 3.3% 7.9% 6.2% Source: Own illustration. Data: The Conference Board and Groningen Growth and Development Centre, Total Economy Database, January 2008. OECD Labor Force Statistics. *Average based on 1960, 1965, 1967, 1969-1973
The productivity growth slowdown occurred as the process of deindustrialization continued in all countries of our sample except Germany, and in many cases the pace of deindustrialization accelerated (see Figure 1).7 Manufacturing now accounts for between 12% and 15% of total value added in the U.S., U.K., Denmark and France. The two trends are not unrelated, as productivity in services, while difficult to measure, is widely recognized to be lower than productivity in manufacturing. Thus the increase in the importance of services in economic activity relative to manufacturing contributed to reductions in economy-wide rates of productivity growth. By some accounts manufacturing output growth is the main driver of productivity growth, following the so-called Verdoorn’s Law.8 Moreover, the manufacturing sector traditionally offered jobs with high pay and employment protection, often the result of effective bargaining by labor unions. Service sector jobs vary in their skill requirement and pay, but 7
According to Kalmbach et al. (2005), the German data overstate the size of the manufacturing sector because many services are counted in manufacturing. 8
According to the Dutch economist Jake Verdoorn, faster output growth is associated with an increase in productivity due to increasing returns to scale.
9
generally offer lower wages and less job security and employee benefits, partly due to low rates of unionization in services industries, an issue we return to below. As the share of services sector has grown in employment and value added, productivity growth has fallen, certainly as compared to that in the “Golden Age”.
32% 30% 28% 26%
(in %)
Share of Manufacturing in Value Added
Figure 1: Share of Manufacturing in Value Added, 1970-2006 (in %)
24% 22% 20% 18% 16% 14%
Denmark
France
Germany
Japan
United Kingdom
20 06
20 04
20 02
20 00
19 98
19 96
19 94
19 92
19 90
19 88
19 86
19 84
19 82
19 80
19 78
19 76
19 74
19 72
19 70
12%
United States
Source: Own illustration. Data: OECD National Accounts Statistics.
A. Unemployment and Inequality More importantly for the purposes of this paper, the post-1973 period has seen a significant increase in worker vulnerability in many industrialized countries. The average rate of unemployment (on a standardized basis) has been significantly higher in the post-Golden Age era compared to the rates of 1956-1973 period. The extent of rise varies, ranging from slightly higher in the U.S. to more than five times higher in France, Germany and Denmark (see Table 2). In
10
most cases, the incidence of long-term unemployment (that is, unemployment duration greater than one year) also rose (Figure 2).9 Figure 2: Share of Long-Term Unemployed (> 1 Year) in Total Unemployed (in %) 56.56% 31.43%
42.91% 34.23%
32.96%
31.50%
20.29%
17.52%
28.51% 22.06% 6.26%
Denmark
France
Germany 1991
Japan
United Kingdom
10.01%
United States
2006
Source: OECD Labor Force Statistics.
The slowdown in GDP and productivity growth described above not only brought higher rates of unemployment, but occurred along with a slowdown in the growth of wages. In the U.S., real median wages have been effectively 10
stagnant since the late 1970s.
The result of these trends is that beginning in the 1980s, the labor share of national
income began to fall across many industrialized countries. Since most labor force participants are not owners of capital, this trend in the labor share captures in a broad way the growing economic insecurity in the industrialized
Even more dramatic than the rise in income inequality between wage earners and profit earners was the rise in inequality across wage earnings, and especially in the gap between the wages of skilled and unskilled workers. The rise in “wage inequality” has been much discussed and is documented below for our six-country sample in Table 3, which shows the ratio of wages in the top decile to wages in the bottom decile of the wage distribution for 1985, 1991 and 2005. Over the entire period, the inequality has been the greatest in the US and least in Denmark . Since 1985, France and Japan were the only countries not to experience an increase in inequality. In the
9 10
We have used 1991 as a start point in much of the analysis so that German data reflect unification. Temin and Levy (2005).
11
other four countries, inequality began to rise after 1991, more pronouncedly in the U.S. and Germany. Table 3: Wage Inequality, 1985-2005 (Ratio of wages of top 10 percent of earners to bottom 10 percent of earners) 1985 1991 2005 Denmark 2.2 2.2 2.6 France 3.1 3.3 2.9 Germany 2.9 2.8 3.3 Japan 3.1 3.1 3.1 United Kingdom 3.2 3.4 3.6 United States 4.1 4.3 4.9 Source: Wage per full-time employee are calculated based on OECD Labor Force Statistics. * Wages only for West Germany. 1990 wages for Denmark, 2004 wages for France.
B. The Burden of Risk There are private and public responses to rising economic insecurity of workers. Households may borrow in order to insulate their spending patterns from earnings volatility. The rise in home equity loans in the U.S. and consumer credit in the U.K. are in part explained by such responses.11 Rates of household saving out of disposable income fell during the 1990s for most of the countries in our sample (Germany and France being the exceptions), indicating the need for households to limit savings in order to maintain their consumption level (OECD, 2007a). Government responses to economic insecurity also vary greatly. The U.S. response was to privatize the burden of health insurance and pensions (see below). In other countries, there was a decline in unemployment benefits (Table 4). Among the countries of the sample, only Denmark and France increased spending (as percent of GDP) on active labor market programs since 1990, though in France the percentage has declined after 2000 (Table 4). Responding to the rising economic insecurity, governments have also made changes in regulations on hiring and firing. 11
Taylor et al. (2005) find that the deterioration in the U.S. current account between 1995 and 2003 closely tracks the rise in health care spending by Americans. This indicates that Americans were not so obviously on a whimsical buying spree, as is so often claimed, but instead were trying to retain spending in the face of stagnant real wages and rapidly rising costs of health care.
12
However these changes have gone in different directions, becoming less strict in Denmark, Germany and Japan, and more strict in France and to some extent in the U.K. (Table 5). Table 4: Labor Market Policy Indicators Public Expenditures for Active Labor Market Programmes (% of GDP) Denmark France Germany Japan United Kingdom United States
1980 0.4% n.a. n.a. n.a. 0.6% 0.2%
1990 1.1% 0.8% 1.0% 0.3% 0.6% 0.2%
2000 1.6% 1.3% 1.1% 0.2% 0.4% 0.1%
2003 1.6% 1.1% 1.1% 0.3% 0.5% 0.1%
Gross Unemployment Replacement Rate (%) 1981 1991 2001 2005 Denmark 54.2% 51.9% 50.9% 48.9% France 31.3% 37.6% 43.5% 39.0% Germany 29.3% 28.8% 29.4% 24.2% Japan 8.8% 9.9% 9.1% 7.7% United Kingdom 24.2% 17.8% 16.6% 15.6% United States 14.6% 11.1% 13.5% 13.5% Source: Own illustration. Data: OECD Social Expenditures and OECD Tax-Benefit Models. Gross Unemployment Replacement Rate: The OECD summary measure is defined as the average of the gross unemployment benefit replacement rates for two earnings levels, three family situations and three durations of unemployment. For further details, see OECD (1994), The OECD Jobs Study (chapter 8) and Martin J. (1996), “Measures of Replacement Rates for the Purpose of International Comparisons: A Note”, OECD Economic Studies, No. 26. Pre-2003 data have been revised.
Table 5: Strictness of Employment Protection Legislation (Higher values indicate stricter regulation on hiring and firing) 1990 1998 2003 Denmark 2.3 1.4 1.4 France 2.7 3.0 3.1 Germany 3.2 2.5 2.2 Japan 2.1 2.0 1.8 United Kingdom 0.6 0.6 0.8 United States 0.2 0.2 0.2 Source: OECD Labor Statistics. Info on EPL: The OECD uses the term Employment protection legislation (EPL) in the context of employment protection legislation generally. It refers to all types of employment protection measures, whether grounded primarily in legislation, court rulings, collectively bargained conditions of employment or customary practice (http://stats.oecd.org/glossary/detail.asp?ID=3535).
More important than shifting the burden of risk are differences across countries in terms of the degree of labor market flexibility, level of unemployment benefits, spending on active 13
labor market programs and the level of pension benefits. Economic insecurity is higher where state protection is lower and/or social protection is more closely tied with employment. By looking at these three variables – strictness of employment protection legislation, gross unemployment replacement rate, and public expenditures on active labor market programs, –we see some clear patterns in the government response to economic insecurity. We calculated an index of the strictness of employment legislation by setting the U.S. level of employment protection level as the base and calculating the relative levels for other countries. Similarly, we constructed an index of “labor support” by again taking the U.S. level of gross unemployment replacement rate and public expenditure on active labor market programs as the base. A scatter plot of these two indexes is given in Figure 3. We next combine these two indexes, giving equal weights to each, into a single index. Based on the values of these indexes, five distinct “models” emerge and they follow closely the groupings presented in Boeri (2002). On the lower left corner we can identify an “Anglo-Saxon model” of low levels of regulation on hiring and firing and low levels of worker support. To this corner belong the U.S, the U.K., Canada, Australia, Ireland and New Zealand. Countries on the lower right corner follow the “Mediterranean model” that combines relatively strict employment legislation and low levels of worker support. This group includes Greece, Portugal, Spain, Italy, and Norway. Countries on the upper right corner of the scatter plot – “the Rhineland model” – combine relatively strict employment protection legislation and high levels of worker support. To this corner belong France, Sweden, Belgium, and Germany. In the upper left corner are countries with relatively flexible labor markets and high levels of worker support. We call this the “flexicurity model,” and its followers include Denmark, Finland, and the Netherlands.
14
Figure 3: Strictness of Employment Legislation vs. Labor Support in OECD countries, 2003 (Indexes, USA=1) Labor Support (USA=1)
12
DNK
10 BEL
8
FIN
6
NLD
4
CAN IRL
2
USA
0 0
1
GBR
NZL
CHE AUS
AUT
DEU SWE FRA NOR ESP
ITA
JPN KOR
2
3
PRT
GRC 4
5
6
Strictness of Employment Legislation Index (USA=1) Source: Own calculations, Data: OECD Employment Outlook 2004, OECD Social Expenditures and OECD TaxBenefit Models. NB: The Strictness of Employment Legislation Index has been calculated indexing the USA=1, i.e. dividing the values of all other countries by the US value. Higher values indicate stricter regulation on hiring and firing. Labor support is an index (using equal weights) composed of the indexed (USA=1) Active Labor Market Expenditures (as % of GDP) as well as the indexed (USA=1) Gross Unemployment Replacement Rate. Higher values indicate a higher security level. Gross Unemployment Replacement Rate: The OECD summary measure is defined as the average of the gross unemployment benefit replacement rates for two earnings levels, three family situations and three durations of unemployment.
Japan has always been difficult to categorize in these schemes because although the state supports only low levels of labor market and social protection, the private sector had traditionally supported long-term employment security. We would propose an “East Asian model” including Japan and Korea, both of which have greater employment protection than those in the AngloSaxon group in Figure 3. It would seem that the traditional role of the private sector in Japan has vanished to a great extent, as seen by the increase to European levels of Japanese long-term unemployment and involuntary part-time employment. The flexicurity model has attracted a lot of attention because of a superior Danish performance in trade and employment and the unusual combination of policies, with flexibility in terms of hiring and firing and strong social protection for those seeking employment, including a high level of unemployment benefits and considerable levels of spending on active labor market 15
programs.12 Moreover, Denmark greatly exceeds other countries in terms of pension benefits relative to lifetime earnings (Figure 4). This system of flexicurity is in part the reason for Denmark’s attainment of a high level of economic security. Figure 4: Gross Pension Replacement Rates by Earnings Based on 2004 Rules (% of median earnings)
83.6
51.2
39.9
36.8
34.4
43.6
Denmark
France
Germany
Japan
United Kingdom
United States
Source: Own illustration, Data: OECD pension models. Taken from: OECD Pensions at a Glance, pp. 33-34. NB: For median income earner. The figures are from the OECD (2006) and are “estimates of the level of pension people will receive if they work for a full career and if today’s pension rules stay unchanged.”
By many measures economic security is the lowest in the U.S., and this is supported by the unusually high perception of insecurity and fear of globalization in the U.S. discussed in the next section. The U.S., often lauded for the flexibility of its labor markets, also stands out in terms of its low levels of unemployment benefits and limited state spending on active labor market programs (Table 4). Moreover, over the past twenty years, the U.S. has experienced a dramatic shift in the burden of risk, from government to the households themselves. This has resulted from more volatile household income, increase in health insurance costs, a greater reliance on private (as opposed to public) pensions, and a continuation of government policies of low levels of unemployment benefits. Hacker (2006) describes these changes as “the great risk shift,” as governments and employers shifted the burden of insuring against a rapid decline in income to the employees and households themselves. In their long-term historical analysis of the
12
See, for example, Clasen (2007).
16
U.S. income distribution, Temin and Levy (2006) argue that this deterioration of the social safety net, combined with the decline of other institutions such as trade unions, has been a source of the decoupling of growth of productivity and growth of wages: “[…] the recent impacts of technology and trade have been amplified by the collapse of these institutions, a collapse which arose because economic forces led to a shift in the political environment over the 1970s and 1980s. If our interpretation is correct, no rebalancing of the labor force can restore a more equal distribution of productivity gains without government intervention and changes in private sector behaviour (Temin and Levy 2006, p. 5).”
As an indication of the changes in the U.S., Table 6 shows union density in our sample countries since 1980, with the U.S. experiencing by far the greatest decline. The U.K., following a similar model, comes next, though unionization in the UK even in 2001 remained at a much higher level than in the U.S. France’s low rate of unionization would seem to be deceptive, since bargaining coverage of union agreements has remained very broad. Table 6: Union Members as share of Total Labor Force (in %) Union Members / Total Labor Force 1980 1991 2001 60% 61% 63% Denmark 14% 8% 8% France 29% 30% 19% Germany 22% 19% 17% Japan 43% 30% 26% United Kingdom 18% 13% 11% United States Source: Own illustration, Data: OECD Trade Union Statistics, based on administrative data except for United Kingdom 2001 and United States 1991 and 2001 (survey data)
The U.S. also stands out in the area of health insurance. The U.S. is alone among our sample countries in not having a universal health insurance coverage. There were 47 million people uninsured in 2005 in the U.S., reflecting a steady increase in the number (and percentage) of people uninsured since the late 1980s (Figures 5, 6).
17
Figure 5: Government and Private Health Insurance Coverage in 2005 (in % of Population) 99.9
100.0
100.0
89.6
87.2
100.0 67.1
27.3
24.3 11.0
6.8 Denmark
France
Germany
Japan
Social/Government
Private
United Kingdom
United States
Source: Own illustration, Data: OECD Health Data. Social health insurance data includes government and social health insurance data. France: Private insurance data for 2004. Japan: Governmental/social insurance data for 2004, private insurance data not available. United States: Private insurance data for 1995 and 2000 from U.S. Department of Commerce Economics and Statistics Administration, U.S. Census Bureau.
40,000
16% 14% 12% 10%
30,000
8% 20,000
6% 4%
1987
1989
1991
1993
1995
1997
Number of uncovered
1999
2001
2003
46,995
44,815
43,498
43,404
42,019
39,760
38,426
41,014
42,943
42,359
41,093
40,582
39,718
39,713
38,641
35,445
34,719
33,385
32,680
0
31,026
10,000
2% 0%
Uninsured in Total Population (in %)
No. of Uninsured (in '000)
50,000
12 .9 % 13 .4 % 13 .6 % 13 .9 % 14 .1 % 15 .0 % 15 .3 % 15 .2 % 15 .4 % 15 .4 % 15 .7 % 15 .8 % 14 .8 % 13 .7 % 14 .1 % 14 .7 % 15 .1 % 14 .9 % 15 .3 % 15 .8 %
Figure 6: Number of People without Health Insurance in the US
2005
Percentage of Uncovered
Source: Own illustration. Data: U.S. Census Bureau, Current Population Survey, 1988 to 2007 Annual Social and Economic Supplements. The number of people reported as of March of the following year. Taken from: Income, Poverty, and Health Insurance Coverage in the United States: 2006 (2007), p.58.
18
C. Perceptions of Economic Insecurity Popular perceptions of economic insecurity do not necessarily reflect objective measures of insecurity, but we find a generally high level of fear towards globalization among our sample countries and especially in the U.S. and France. According to the German Marshall Fund (2007), 34% of Americans and 38% of Europeans had a negative view of globalization. About half of Americans and Europeans think that “freer trade” results in more job loss than job creation. Between 2005 and 2007 American sentiment turned more against freer trade while European sentiment became less skeptical of the employment benefits of trade liberalization. Half of Americans and a slightly higher percentage of Europeans “saw the growth of China’s economy as a threat.” Across countries, the survey showed that the U.S. and France show the most skepticism toward international trade and investment (see Figure 7). Of all countries surveyed, these two showed the highest proportion of respondents, 40 percent in the US and 36 percent in France, who “did not favor FDI.” This contrasted with 69% of English and German respondents who favored FDI.13 Adverse attitude toward globalization went along with pessimism regarding future. In the U.S., 40% expect the next generation will have a lower standard of living, 62% said job security had declined, and 59% said they have to work harder to earn a decent living. Most striking, 75% said that “outsourcing work overseas hurts American workers.”14 While this expression of greater economic insecurity was the greatest among those with less education, expressions of higher economic insecurity were found for all educational categories.15
13 Note that Scheve and Slaughter (2004) find that in the UK over 1991-1999 that perceived economic insecurity was higher in those sectors with greater outward FDI. 14 Anderson and Gascon (2007), p. 1 15 Even on the issue of perception of insecurity, there is conflicting evidence. Kierkegaard (2007, p. 11) shows that among European countries there is not a statistically significant relation between “public anxiety” over offshoring (as measured by the Eurobarometer 63 of 2005) and the intensity of offshoring and offshore outsourcing.
19
Figure 7: Concerns about Free Trade (in % of Respondents) 37%
Favor freer trade
74% 60% 59%
Favor foreign companies investing in our country
53% 59%
42% 42%
Agree that trade costs more jobs than it creates Agree that freer trade leads to more social and economic inequality in our country. Agree that freer trade puts our country at a disadvantage because of our high labor and environmental standards
66%
52%
Germany
74%
61% 61% 64% 57% 51%
34% France
69% 69%
57%
46% 41% 45%
Agree that the Chinese economy represents a threat.
84%
United Kingdom
United States
Source: German Marshall Fund (2007), Trade and Poverty Reduction Survey, Topline Data October 2007.
Figure 8: The Perception of Globalization (in % of Respondents) Question: “There are multiple consequences of the globalisation of trade. When you hear the world ‘globalisation’, what comes first to mind?” 28%
Relocation of some companies to contries where labor is cheaper Opportunities for national companies in terms of new outlets
16%
30%
57%
47%
22%
14% 12% 13% 14%
Increased competition for national companies 7% 7% 7%
Foreign investments in our country
Other
46% 34%
13%
2% 1% 1% 2% Denmark
Germany
France
United Kingdom
Source: Eurobarometer 67 (2007), Public Opinion in the EU, Fieldwork April-May 2007.
The contrast between perceptions of globalization in France and Denmark is clear from a recent survey that asked “what comes first to mind when you hear the word ‘globalisation’? 20
Fifty-seven percent of French respondents said that the word ‘globalisation’ evoked the “relocation of some companies to countries where labor is cheaper.” Among Danes, 47% responded that globalization evoked “opportunities for national companies in terms of new outlets” (Figure 8).
3. The “New Wave” of Globalized Production The international trading environment has changed over the last 20 years during which economic insecurity has increased in the industrialized world. The changes reflect political, economic and technological changes that have together encouraged more international trade and foreign investment, altered the structure of trade, and changed the relation between trade and foreign direct investment. Expansion of trade during this period has occurred increasingly through sophisticated global value chains, as companies in industrialized countries went offshore to perform both manufacturing and services, while retaining in home countries “core competencies” related to marketing, finance, R&D and design. This type of division of labor has resulted in greater reliance on imports from low-income countries. True that these changes in the international economy began decades ago and have spread gradually, so that we are not witnessing a sudden shift in economic relations. However, but the internationalization of production has deepened in such a way in the past 20 years that it is possible to designate this period as one heralding a “new wave” of globalization, involving both quantitative and qualitative shifts in the role of international trade. Economists note that trade can now be better described as “trade in specific tasks” and not just as trade in goods and services.16 Levy (2005, p. 685) sees offshoring as driven not by comparative advantage but by firms’ ability to “coordinate a geographically dispersed network of activities.” He notes that offshoring “decouples the 16
Grossman and Rossi-Hansberg (2007), p. 60.
21
linkages between economic value creation and geographic location.” Higher imports of cheap inputs lowers production costs considerably and raise profits of lead firm, thus contributing to the rising share of corporate profits in national income. After a brief discussion of the factors that have driven this new wave of globalization, we then turn to an analysis of the variety of linkages between this new wave of globalization and economic insecurity.
A. Political, Technological and Economic Factors Politically, perhaps the most significant development of this period was the entry into the capitalist world economy of former-Communist and other largely-closed economies. The collapse of the Soviet Union and of communist governments throughout Eastern Europe, China’s evolution towards a market economy, and even the opening and liberalization of India’s economy, have all served to expand global productive capacity, international trade, foreign investment and international subcontracting. Freeman (2007) has characterized these developments as “the great doubling” of the world capitalist system’s labor force, as they added 1.3 billion people to the pool of labor seeking work under competitive conditions. Such an expansion of labor supply alone, Freeman argues, is enough to dampen wage growth in the rest of the world, including the industrialized countries. When such a labor supply “shock” occurs in a period of slower demand growth compared to the “Golden Age” period of 1950-1973, the effect on labor markets around the world is likely to be significant. A second, and related, political development has been the rise in the number of trade agreements, covering more countries than ever in history. Hundreds of bilateral investment treaties have been signed, and numerous regional trade agreements have gone into effect. These agreements have contributed to the ongoing process of tariff reduction and removal of non-tariff barriers, aiding at the same time the globalization of production by providing protection to 22
foreign investors. Meanwhile, the WTO has quintupled its membership over the original GATT. As part of this broad liberalization process, many developing countries switched from import substitution policies to export promotion, using a growing network of international supply chains. For example, export processing zones have expanded in scope and number, offering foreign firms long tax holidays on corporate profits and/or unrestricted profit repatriation.17 These regulatory changes generally increased economic security of firms while raising the vulnerability of workers in developed countries. Rapid progress in electronic communication has facilitated the massive expansion of supply chains internationally, with lead firms investing abroad or subcontracting with foreign producers in order to reduce cost of production and/or better serve local markets. As supply chains developed and supplier firms gained in technological sophistication and scale of operations, the dichotomy between in-house or arm’s-length international supply relations has given way to a multiplicity of lead firm/supplier firm relations involving various degrees of investment, technical support, long-term contracting and monitoring. In some cases, large supplier firms – especially in autos, apparel, electronics and services – have captured scale economies and developed modular production systems, enabling them to produce a range of related products, and allowing them to supply inputs and finished goods to many companies within a given sector and sometimes across sectors.18 In many cases, however, continual entry of new developing country supplier firms has resulted in global excess capacity, declining terms of
17
See Milberg (2007a) for an overview of the expansion of EPZs in the 2000s. On the variety of forms of lead firm-supplier relations, see Gereffi et al. (2005). For a discussion of “modularity” in global supply chains, see Sturgeon (2002). For a study of scale economies in first-tier suppliers, see Applebaum (2002) and Gereffi (2006).
18
23
trade for developing countries’ manufacturers, and enhancing the scope for lead firms to induce competition among supplier firms, further lowering lead firm input costs.19
B. International Trade and Investment The end result of the political, technological and economic factors described above is the rapid expansion of world trade relative to world output. Tables 7a and b show the trade shares of goods and services for the six countries under review. Since 1991, all countries have expanded their exports and imports relative to GDP. Germany recently overtook the U.S. as the largest goods exporter, a feat that is especially impressive given the size of the U.S. economy compared to that of Germany. The U.S. imports however remain more than double those of the next highest importer. Though the U.S. has the highest value of exports and imports of total goods and services, it has the lowest ratio of trade (exports plus imports) to GDP. Trade in services, while at much lower levels in terms of value, has expanded faster in many cases. In 2005, the U.S. ran a $62 billion surplus in services, while Germany ran a $48 billion deficit. Tables 7a-b: Exports and Imports of Commodities and Services
Commodities
Exports (in Bn. USD) 1991 2005
(in % of GDP) 1991 2005
Imports (in Bn. USD) 1991 2005
(in % of GDP) 1991 2005
Balance (in Bn. USD) 1991 2005
(in % of GDP) 1991 2005
37.7 83.3 27.6% 32.2% 34.3 75.0 25.1% 29.0% 3.5 8.3 2.5% 3.2% Denmark 213.4 434.4 17.2% 20.4% 230.8 476.0 18.6% 22.4% -17.4 -41.6 -1.4% -2.0% France 402.7 977.8 22.3% 35.0% 389.1 777.4 21.5% 27.8% 13.6 200.4 0.8% 7.2% Germany 314.5 594.9 9.2% 13.0% 236.7 515.9 6.9% 11.3% 77.8 79.1 2.3% 1.7% Japan 209.8 515.8 20.3% 23.5% -27.6 -131.4 -2.7% -6.0% United Kingdom 182.2 384.4 17.6% 17.5% 421.7 904.3 7.1% 7.2% 509.2 1,732.3 8.5% 13.8% -87.5 -828.0 -1.5% -6.6% United States Source: Own calculations, Data: OECD International Trade by Commodities Statistics, International Monetary Fund (IMF), CD-ROM via UNCTAD.
19
Milberg (2004) calls this the “endogenous asymmetry of market structures in global supply chains.” On the terms of trade issue, see recent papers on the “fallacy of composition” in manufacturers export expansion including Mayer (2003) and Blecker and Razmi (2006).
24
Services
Exports (in Bn. USD) 1991 2005
(in % of GDP) 1991 2005
Imports (in Bn. USD) 1991 2005
(in % of GDP) 1991 2005
Balance
Balance
(in Bn. USD) 1991 2005
(in % of GDP) 1991 2005
14.3 36.3 10.4% 14.0% 10.4 33.4 7.6% 12.9% 3.8 2.9 2.8% 1.1% Denmark 80.1 116.0 6.5% 5.5% 63.7 106.1 5.1% 5.0% 16.4 9.9 1.3% 0.5% France 64.1 154.9 3.5% 5.5% 90.0 202.9 5.0% 7.3% -25.9 -47.9 -1.4% -1.7% Germany 44.8 110.2 1.3% 2.4% 86.6 134.3 2.5% 2.9% -41.8 -24.0 -1.2% -0.5% Japan 56.3 203.1 5.4% 9.2% 49.0 160.5 4.7% 7.3% 7.3 42.6 0.7% 1.9% United Kingdom 162.6 376.8 2.7% 3.0% 118.1 314.6 2.0% 2.5% 44.5 62.2 0.7% 0.5% United States Source: Own calculations, Data: International Monetary Fund (IMF), Balance of Payments, CD-ROM via UNCTAD. *2004 imports and exports for Denmark.
The expansion of world trade in the past 10-15 years has occurred, to a great extent, within supply chains, which can take the form of either multinational corporations (leading to intra-firm trade) or arm’s-length relations between buyer and supplier. Evidence shows that both forms of supply chains have expanded since the 1980s. The share of world FDI going to low- and medium-wage countries has grown steadily since the mid-1970s. At the same time, the share of intra-firm trade in industrialized country imports has remained relatively constant, indicating that the arm’s-length channel has retained its competitive appeal.20 Foreign investment patterns have also changed. Traditionally, foreign investment was considered a substitute for international trade and a means for “tariff hopping”. Today, foreign direct investment and trade are complementary, since FDI leads to input trade within global supply chains. In addition, globalization of production has reduced, to some extent, domestic investment in the industrialized countries, since considerable production activity now takes place offshore. Taking the process to its extreme, many lead firms in the supply chains have divested entirely from manufacturing. All countries in our sample have seen a decline in the ratio of domestic investment to GDP since the mid-1980s. During the same period, the investment-toGDP ratio has ballooned in China, a point we discuss in more detail below.
20
On the location of FDI, see Burke and Epstein (2001) and on intra-firm trade, see Milberg (2004).
25
C. Offshoring of Goods and Services The growth in trade and FDI over the past 20 years is not simply a quantitative shift. It reflects a structural shift led by the accelerated growth of sophisticated supply chains. There has been a rise in offshoring by firms in the industrialized countries. Table 8 presents recent data for Germany, the U.K. and the U.S, showing that goods and services produced in offshore production sites measured as the share of imported inputs in total (non-energy) inputs, rose in the 1990s. Goods produced offshore account for almost 30% of input use in the U.K., 23% in Germany and over 17% in the U.S. In case of Germany and the U.S., these levels reflect slow but steady growth in the reliance on imported inputs, growing by about 50% over 1992-2004 . For services, the ration of imported to total input is still low, ranging between 8 and 3 percent, but the rates of growth are higher than those for goods in all the three countries mentioned above. A number of recent studies indicate that offshoring of services is likely to expand more rapidly in future than that of goods.21 The figures in Table 8 measure trade in inputs and thus may understate the magnitude of trade within global supply chains. Global corporations in the major industrialized countries are not strictly involved in assembly. Much of the import activity in global supply chains is in fully finished goods. In fact, the purpose of corporate offshoring, whether at arm’s-length or through foreign subsidiaries, is precisely to allow the corporation to focus on its “core competence,” while leaving other aspects of the process, often including production, to others. Many “manufacturing” firms now do not manufacture anything at all. They merely provide product and brand design, marketing, supply chain logistics, and financial management services. Thus an alternative proxy for offshoring may simply be imports from low-wage countries. As shown in Table 9, Japan and the U.S. now rely heavily on imports from low-income 21
For some historical data on offshoring, see Campa and Goldberg (1997).
26
developing countries (29% and 22% respectively). While the analogous ratios for them are still low, all the European countries have seen in recent years a more than doubling of the share of their imports coming from low-income developing countries (see column marked “low-income” in Table 9). The new wave of globalized production can be put in some historical perspective by considering imports from all developing and transitional economies since 1950, as also shown in Table 9. In 1950, these shares were especially high in countries with colonial ties, such as France, the UK, and the US, and also in Germany. The shares declined for some countries during 19501970 and 1970-1991, but showed considerable rise during 1991-2005, reaching 16% in Denmark, 20% in France, 24% in Germany, 26% in the U.K., 54% in the U.S. and 68% in Japan.
27
Table 8: Offshoring Intensity in Germany, the UK, and the US 1992-2004 (Imported Inputs as % of Total Non-Energy Inputs)
Goods Offshoring Intensity Year 1992 1993 1994 1995 1996 1997 1998 1999 2000 2001 2002 2003 2004 Growth 92-00*
Germany
United Kingdom
United States
12.2 12.2 14.8 14.6 15.4 19.5 19.9 19.7 20.5 23.1 59.1%
28.2 29.5 29.8 30.7 30.7 29.7 28.0 28.0 28.6 28.1 1.3%
11.7 12.7 13.4 14.2 14.3 14.6 14.9 15.6 17.3 47.9%
Service Offshoring Intensity Year
Germany
United Kingdom
United States
1992 1993 1994 1995 1996 1997 1998 1999 2000 2001 2002 2003 2004
1.0* 1.0** 0.9** 1.0 1.1 1.2 1.4 1.7 2.0 2.3 2.2 2.1 2.1
1.4 1.6 1.6 1.6 1.8 1.7 2.0 2.2 2.4 2.6 -
0.2 0.2 0.2 0.2 0.2 0.2 0.2 0.3 0.3 -
Growth 92-00 100.0% 76.3% 61.1% Source: Own calculations for Germany. Data: input-output tables, Federal Statistical Office. *1995-2000 for Germany. ** German service offshoring intensities from 1992 to 1994 use unrevised input-output data. Service offshoring intensity=∑s [(input purchases of service s by sector i)t/(total non energy inputs used by sector i)t]* [(imports of service s)t/(productionst + importsst - exportsst). Weighted average across all sectors i by outputs at time t. Goods offshoring intensity is calculated equivalently. Calculations for the UK: Amiti and Wei (2005). Data: input-output tables, UK National Statistics, IMF: Balance of Payments Statistics. NB: UK data is not directly available, but can be reconstructed from Figure 2 in Amiti and Wei (2005). Calculations for the US: Amiti and Wei (2006). Data: input-output tables, US National Statistics, IMF: Balance of Payments Statistics.
28
Table 9: Merchandise Imports by Region of Origin (% of Total Imports) Developed economies
Developing economies
Economies in transition
High- Middle- LowTotal Income Income Income Denmark
France
Germany
Japan
United Kingdom
United States
1950 1970 1991 2005 1950 1970 1991 2005 1950 1970 1991 2005 1950 1970 1991 2005 1950 1970 1991 2005 1950 1970 1991 2005
93.3 88.4 89.8 84.4 52.7 77.2 80.7 78.8 74.4 79.5 81.6 76.2 60.7 54.4 49.2 32.5 58.3 70.5 84.3 71.8 43.2 72.6 59.5 46.2
0.9 4.5 3.6 4.7 9.3 5.8 5.6 4.7 4.8 6.6 5.5 5.0 8.2 13.4 25.1 26.5 8.4 10.2 6.6 8.3 15.5 14.0 24.0 22.0
3.5 3.4 2.4 2.8 23.9 8.2 5.9 6.3 9.9 6.5 5.1 5.0 8.2 15.3 9.2 10.4 12.5 7.6 4.4 6.7 25.0 7.6 7.5 8.7
0.9 2.6 2.9 6.3 8.4 6.8 3.8 6.0 9.1 4.5 4.1 8.6 21.5 14.1 14.9 29.2 14.6 8.4 3.0 8.0 14.0 5.2 8.6 21.8
5.4 10.5 9.0 13.8 41.6 20.8 15.2 17.0 23.8 17.6 14.6 18.6 37.8 42.9 49.3 66.2 35.5 26.2 14.1 23.0 54.5 26.8 40.1 52.5
0.7 1.1 1.2 1.7 0.4 1.7 1.8 3.2 1.0 2.8 3.7 5.2 0.1 2.6 1.5 1.4 1.8 3.0 1.0 2.6 0.7 0.5 0.3 1.3
Source: Own illustration. Data: UNCTAD. Handbook of Statistics.
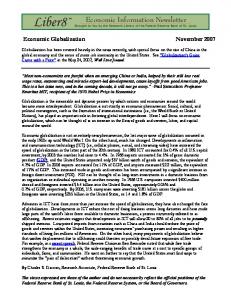
China is the export powerhouse, hosting much of the offshoring activity, and India’s boom in business services exports has now received much attention. China’s export to industrialized countries has been growing remarkably, especially in the past ten years, reaching 10% of total OECD imports in 2005, and continuing to grow since then (Figure 9). In 2006, the U.S. ran a $235 billion deficit with China, based on imports of $287 billion and exports of $52 billion. Most of these imports were demanded directly by U.S. corporations, such as Wal-Mart, Nike and Mattel and a number of apparel, electronics and automotive companies. About 25 percent of U.S. imports from China are “related party” imports, meaning they are between parties with at least a 5% common ownership interest. Those without affiliates in China often order from 29
large Chinese contract manufacturers or from vendors who subcontract to Chinese firms. In the electronics sector, Chinese production is dominated by foreign investors from Asia. Figure 9: OECD Goods Trade with China and India (as % of total OECD Goods Trade) OECD Goods Trade with China and India (in %)
10 9 8 7 6 5 4 3 2 1
OECD imports from China
OECD imports from India
OECD exports to China
2005
2004
2003
2002
2001
2000
1999
1998
1997
1996
1995
1994
1993
1992
1991
1990
1989
1988
1987
1986
1985
1984
1983
1982
1981
1980
0
OECD exports to I
Source: OECD Employment Outlook 2007, p.110. Data: United Nations, COMTRADE database.
4. Globalization and Economic Insecurity A. Connecting Globalization to Economic Insecurity All six countries of our sample experienced an increase in globalization (by various measures) in recent years, and in almost all cases our measures of economic insecurity also increased, most prominently in Germany, Japan, and the U.S. Two countries (Denmark and the U.K.) experienced declines in the share of long-term unemployment and also had the lowest growth in involuntary part-time work (see Table 10).
30
Table 10: Globalization vs. Economic Insecurity, 1991-2005 (compound annual growth rate, unless otherwise indicated)
Globalization (1991-2005) Exports plus Imports in GDP 1.9%
KOF Economic Globalization Index 0.7%
Imports from LowIncome Countries in Total Imports 5.6%
Goods Offshoring1
Service Offshoring1
n.a.
n.a.
France
1.3%
0.7%
3.3%
n.a.
n.a.
Germany
2.8%
1.2%
5.4%
7.3%
9.2%
Japan
2.8%
0.8%
4.9%
n.a.
n.a.
United Kingdom
1.3%
0.6%
7.3%
0.0%
7.6%
United States
2.0%
0.5%
6.8%
5.0%
6.1%
Denmark
Economic Insecurity (1991-2005)
Denmark
Share of Labor Share of Involuntary Share of Long-Term Compensation in Part-Time Workers in Unemployed in Total GDP Total Employment Unemployed -0.2% 1.1% -1.4%
ILO Economic Security Index 2004 (Value) 0.91
France
0.0%
1.4%2
1.3%
0.83
Germany
-0.6%
14.6%
3.9%
0.79
Japan
-0.2%
12.4%
4.7%
0.72
United Kingdom
-0.2%
0.5%
-1.7%
0.74
United States -0.1% n.a. 4.6% 0.61 Source: Own illustration. Data: OECD, UNCTAD, KOF Index of Globalization 2008, Federal Statistical Office Germany, Amiti and Wei (2005, 2006). 1 CAGR for 1995-2004 in Germany, 1992-2001 in the UK and 1992-2000 in the US. 2 1992 data for France.
B. A Closer Look at Winners and Losers from Offshoring Trade liberalization is known to create winners and losers, and the new wave of globalization is no different in this regard, although some of the mechanisms and distributional effects may be new. Figure 10 depicts the variety of ways in which offshoring impacts the labor market. Offshoring, on the one hand, lowers prices of inputs and outputs, raising the demand for both and thus the demand for labor too. In addition, lower input prices should raise profit margins and profits, leading to investment that should further raise productivity and output. These gains are labeled as the “mark-up,” and “scale” effects in Figure 10. On the other hand, offshoring 31
weakens labor demand by replacing foreign labor for domestic labor, creating a “substitution effect.” It also reduces demand for labor by raising productivity, an outcome referred to as the “productivity” effect. Not the entire rise in profits is recycled into investment and labor demand, and this constitutes an important leakage in the system. As we will see below, corporations may also choose to return their net gains to shareholders, and this has occurred through higher dividend payments and share buybacks. This strategy of financialization of the non-financial corporate sector also includes the purchase of financial assets and the acquisition of other corporations (merger and acquisition). Financialization represents a drain on labor demand and, as we will see below, may play an important role in the link between globalization and economic insecurity. Figure 10 is a simplification that considers all labor as one type, and leaves out some potentially significant indirect effects. Thus in addition to the direct effect of offshoring on employment and profits, economic research has also considered the effect of offshoring on different types of labor (skilled and unskilled, through the Stolper-Samuelson effect), the increased sensitivity of labor demand to wage changes at home and abroad, and the greater use of company threats to move production abroad to undercut bargaining power of unions and laborers. We briefly review the evidence on each of these channels before looking at the overall relationship between globalization and economic insecurity in the industrialized countries.
32
Figure 10: Gains and Losses from Offshoring •Substitution effect
Offshoring �
Poutput �
Pinput �
YD�
I�
Output � Productivity �
LD � LD � LD �
•Productivity effect •Mark-up effect
Poutput �
Profits �
YD� Financialization �
•Scale effect
LD �
Source: Own illustration. Based on Amiti and Wei (2006) and Milberg et al. (2007). NB: Y
D
D
= demand for output and L = demand for labor.
C. Profits and the Profit Share We noticed that offshoring is one of the reasons behind the recent rise in the profit share of national income observed across industrialized countries. Figure 11 however shows the flip side, which is the decline in the labor share. Note that the labor share in the U.S. has declined less than in other countries. This is partly due to the fact that the large levels of CEO compensation in the U.S. including stock options, are officially counted in labor income.
33
Figure 11: Labor Compensation (in % of GDP)
Labor Compensation (in % of GDP)
65.0% 62.5% 60.0% 57.5% 55.0% 52.5% 50.0%
Denmark
France
Germany
Japan
United Kingdom
20 05
20 03
20 01
19 99
19 97
19 95
19 93
19 91
19 89
19 87
19 85
19 83
19 81
19 79
19 77
19 75
19 73
47.5%
United States
Source: Own illustration. Data: OECD Annual National Accounts Statistics.
A number of studies have confirmed the role of offshoring in changing the distribution of income between labor and capital. Most firm-level studies find that offshoring occurs when cost reductions can be achieved and are at least 40% of the labor cost.22 Focusing on the data for 2000-2003, Milberg et al. (2007) find that offshoring intensity is positively associated with sectoral profit shares in the U.S. A number of recent papers have taken up the question of trade and the profit share at the aggregate level. Harrison (2002) studies the relation between trade openness and functional distribution of income across a large number of countries and find that (contrary to the prediction of Heckscher-Ohlin theory) openness is generally associated with a lower share of labor in national income. Harrison concludes that “rising trade shares and exchange rate crises reduce labor’s share, while capital controls and government spending increase labor’s share.” A study by the IMF (2005) finds that offshoring is a small, but significant negative factor in the determination of the labor share of income for a group of OECD countries. 22
See Milberg (2007b) for a review of these studies.
34
In this study, three aspects of globalization (related to prices, offshoring, and immigration) combined to play a large role in explaining the declining labor share. The study by Ellis and Smith (2007) finds no connection between openness and the profit share, but links the rising profit share to increased “churning” in the labor market. While the authors attribute this churning to technological change, it seems likely that it also results from some of the indirect effects of globalization discussed below. It is important to recognize that the rise in income inequality (between labor and capital) is not inconsistent with the theory depicted in Figure 10. As Mann (2003) shows, offshoring may lead to positive net employment growth provided efficiency gains from offshoring are shared between consumers and producers and both these channels promote investment. The problem is that the increase in profit share has not generally resulted in higher rates of investment. In fact, as profit shares of national income increased, domestic investment has fallen, as can be seen in Figure 12. There are a number of explanations for the decline in domestic investment. The simple fact is that less domestic investment is needed when significant portions of the production process (goods and services) are moved offshore. Thus decline in domestic investment of industrialized countries goes hand in hand with rise in investment rates of countries hosting offshoring activities, such as China. (Figure 12).
35
45.0 42.5 40.0 37.5 35.0 32.5 30.0 27.5 25.0 22.5 20.0 17.5
China
Denmark
France
Germany
Japan
United Kingdom
20 04
20 02
20 00
19 98
19 96
19 94
19 92
19 90
19 88
19 86
19 84
19 82
19 80
19 78
19 76
19 74
19 72
15.0
19 70
Gross Capital Formation (in % of GDP)
Figure 12: Gross Capital Formation (in % of GDP)
United States
Source: Own illustration. Data: UN DESA Statistics Division, Retrieved from: UNCTAD GlobStat Database.
An associated phenomenon, also shown in Figure 10, is the leakage of profits to the financial system. According to a number of recent studies, the decline in investment spending in the corporate sector is also tied with the shift in corporate strategy occurring in the 1980s, when the pressure on management was to “downsize” the corporation and “distribute” profits back to shareholders at a greater pace. This process of financialization that occurred in the non-financial corporate sector was supported by the possibility of moving operations abroad through foreign direct investment and arm’s-length subcontracting and focusing increasingly on “core competence,” a process that allowed corporate managers to reduce domestic investment in order to meet shareholder demands for improvements in shareholder value. Stockhammer (2004) documents a marked increase in the share of non-financial corporations’ value added going to interest and dividends since the late 1970s in the U.S., the U.K., France, and Germany. In a firmlevel study of the U.S. non-financial corporate sector, Crotty (2007) finds a similar relation between financialization and investment. Milberg et al. (2007), also focused on the U.S., shows 36
that the rising profit share, due in part to offshoring, occurs as the share of investment out of profits fell and the payment of dividends and the purchase of share buybacks rose (see Figure 13).23 Figure 13: Dividends plus Share Buybacks as Percentage of Internal Funds, U.S. Non-Financial Corporations, 1960-2006. 100% 90% 80%
Percent (%)
70% 60% 50% 40% 30% 20% 10%
06
04
20
02
20
00
20
98
20
19
94
96
19
92
19
19
88
90
19
86
19
19
82
84
19
19
78
80
19
76
19
74
19
72
19
70
19
19
66
68
19
64
19
19
60
19
19
62
0%
Year
Source: Schedule Z.1 of the Flow of Funds Account from the U.S. Federal Reserve Bank online database.
23
It would appear that the relation between offshoring and financialization is not just in one direction. A study of U.K. and Danish retail firms shows that the financial pressures on the U.K. firms led to much stricter conditions being imposed on foreign suppliers of U.K. firms compared to Danish firms. U.K. retailers were more aggressive in seeking low-cost suppliers and in pressuring suppliers to reduce prices. See Palpacuer et al. (2005) and Gibbon (2002).
37
D. Job Displacement and Earnings Replacement There are a variety of ways of studying job loss resulting from international trade. One of these focuses on old-fashioned direct import competition, that is on the employment effects of a change in net exports, where these employment effects are typically based on a comparison of actual employment with employment levels that would have occurred if the trade balance (relative to GDP) had remained unchanged. Sachs and Shatz (1994) had found that trade reduced U.S. manufacturing employment by 5.7% in 1990, and Wood (1994) put the figure at 10.8% for all developed countries, with a relatively larger share of the decline borne by unskilled workers in both studies. In general, these studies find employment gains where net exports rise and employment losses where they fall. These studies focus almost exclusively on the manufacturing sector. In our sample, for the period 1991-2005, the U.S., the U.K. and France experienced increases in their trade deficit in manufacturing, while Denmark, Japan and especially Germany had improvements. The deterioration has been the greatest for the U.S., and Scott (2007) calculates that the decline in net exports between 2001 and 2006 cost the U.S. the equivalent of 1.8 million jobs.24 Another line of research looks at the employment effects of foreign direct investment. This however captures only a portion of the effect of offshoring, because much of it takes place at arm’s length. The results proved to be ambiguous. Muendler and Becker (2006) in a study of Germany, Brainard and Riker (2001) in a study of the U.S. and Fors and Kokko (1999) in a study of Sweden, found a substitution effect between employment at home and in foreign affiliates. Desai, Foley and Hines (2006) and Borga (2005) found complementarities between employment at home and in affiliates for U.S. transnational corporations. Harrison and McMillan (2007) find that the effect of FDI on U.S. employment depends on whether the investment is horizontal or 24
Note that the author attributes 11% of this job loss to Wal-Mart’s imports alone.
38
vertical. Horizontal FDI, seeking to serve foreign markets, is found to reduce U.S. labor demand, while vertical FDI, which seeks to reduce costs, increases the demand for labor. An important measure of economic insecurity is the ability of workers displaced by trade to find a new job and not suffer a loss in earnings. Kletzer (2001) has done the most extensive analysis of the re-employment rate and replacement wage for workers displaced as the result of foreign trade. In a study of the U.S. from 1979-1999 she found that earnings losses from job dislocation are large and persistent over time. Specifically, she found that 64.8 per cent of manufacturing workers displaced during 1979-1999 and one-fourth of those reemployed suffered earnings declines greater than 30%. For workers displaced from non-manufacturing sectors the situation is very similar: 69 percent found reemployment, and 21 per cent suffered pay cuts of 30 per cent or more. Table 11: Adjustment Costs of Trade-Displaced Workers 14 European countries: 1994-2001a Share reemployed two years later (%)
Industry
Manufacturing
57.0
Share with Share with no earnings earnings loss or losses > earning 30% (%) more (%) 45.8 6.5
United States: 1979-1999 Share reemployed at survey date (%) 64.8
Share with Share with no earnings earnings loss or losses > earning 30% (%) more (%) 35.0 25.0
High-International-Competition
51.8
44.0
5.4
63.4
36.0
25.0
Medium-International-Competition
58.7
45.7
7.0
65.4
34.0
25.0
Low-International-Competition
59.6
47.3
6.8
66.8
38.0
26.0
Services and Utilities
57.2
49.6
8.4
69.1
41.0
21.0
All sectors
57.3
47.1
7.5
-
-
-
b
Source: OECD Employment Outlook 2005, Table 1.3, p. 45; and Kletzer, L.G. (2001), Job Loss from Imports: Measuring the Loss, Institute for International Economics, Washington, DC, Table D2, p. 102. a) Secretariat estimates based on data from the European Community Household Panel (ECHP) for Austria, Belgium, Denmark, Finland, France, Germany, Greece, Ireland, Italy, Luxembourg, the Netherlands, Portugal, Spain and the United Kingdom. b) Services for Europe.
OECD (2005) did a similar study for 14 European countries for 1994-2001 and found that re-employment rates in Europe were lower than in the U.S., but a much lower share of workers had earnings losses greater than 30% upon reemployment and 46 percent of workers had no
39
earnings losses or were earning more than before displacement. Table 11 compares the U.S. and European situations for trade-displaced workers.
E. Trade versus Technology: Skill-Biased Labor Demand Shifts Labor economists studying rising income inequality in industrialized countries over the past 15-20 years often see the explanation in technological change. According to this view, the introduction of information technology (IT) and IT-enabled tasks introduced a bias in the demand for higher-skill workers. The result of such “skills-biased technological change” was to raise income inequality, as the wages of higher-paid workers increased faster than those of lower-paid workers who experienced smaller gains or even, in some cases, a decline in wages.25 Responding to the empirical findings, many international trade economists have reformulated the traditional two factor model of trade to allow distinction between labor of and low skill.26 These models generally predict that trade liberalization would raise the relative demand for skilled labor in industrialized countries and thus raise the ratio of wages of skilled labor to wages of unskilled labor. These predictions are consistent with the observed increasing trends in income inequality in these countries.27 In sum, trade liberalization and technological change both can contribute to the rising wage inequality in industrialized countries. The debate concerns their relative role in the phenomenon. Wood (1995, p. 57) finds that that “trade is the main cause of the problems of unskilled workers.” (See also Wood 1994). As the main force driving the process, he identifies increasing 25
For some early empirical analysis, see Berman et al. (1994) on the U.S. and Machin et al. (1996) on the U.K.. 26 Wood (1994, 1995) pioneered this effort. He argued that capital could be ignored since with high international mobility it had little differential effect across countries. 27 According to the Stolper-Samuelson theorem, trade liberalization should benefit an economy’s abundant factor relative to its scarce factor. In a world of high- and low-skill labor, the industrialized countries were clearly relatively abundant in skilled labor and thus could expect to see the returns to skill rising in relative terms.
40
specialization of industrialized countries in capital-intensive manufacturers, while developing countries specialized in the production of labor-intensive goods. Wood estimates that between 1980 and 1994, 75% of the increased wage inequality in the U.S. was due to trade. Feenstra and Hanson (1996, 1998, 2001) follow up the above results with a series of studies applying the extended trade model to the case of offshoring. They find that changes in offshoring between 1979 and 1990 explain between 15 and 40 percent of the rise in the wages of high-skilled workers relative to the wages of low-skilled workers in that period. In a study of manufacturing offshoring in the UK for the period 1970-1983, Benton and Anderson (1999) find that trade accounted for 40% of the rise in the skilled labor share of labor income. Geishecker (2002) in a study of Germany in the 1990s finds that offshoring had a significant negative impact on the demand for low-skilled workers, explaining about 19% to 24% of the overall decline in the relative demand for low-skilled labor. Head and Ries (2000) estimate a similar model for Japan and find “a strong positive correlation between the change in the firm’s non-production wage share and a firm’s share of employment in low-income countries.” (Feenstra and Hanson, 2001, p. 28). In their summary paper on the issue, Feenstra and Hanson (2001) find that offshoring accounted for 15-24% of the rise in the “non-production wage share” (i.e. the share of wages going to higher-skilled workers), while computer services and other high-tech services account for 8% to 31% of the shift to non-production labor. Further research could not actually resolve the debate concerning relative roles of technology and trade in wage inequality rise. Also, there has been a debate about the timing of the technological change.28 By some accounts, inequality began to rise well before new technology was integrated into production processes. Inequality actually fell during the late 1990s when the IT boom was the strongest. It also became clear that trade and technological change are 28
See Gordon and Dew-Becker (2006) section 5 for a discussion.
41
inter-connected, and increasingly so as global supply chains developed. For example, Wood (1995, p. 62) notes that “the pace and direction of technical change may be influenced by trade…So, however one looks at it, trade and new technology are intertwined: no story that excludes one or the other of them is likely to be the whole story.” Despite these difficulties, the increased magnitude of and public concern over offshoring have spurred much empirical research on the labor market effect of offshoring in the 1980s and 1990s. Table 12 presents a summary of recent research, which covers studies of the U.S., the U.K., Germany and a recent study of all OECD countries, and covering both the manufacturing and service sectors. These recent studies by and large support earlier findings: offshoring in the production of goods and services leads to the rise of employment and wages of high-skilled labor and fall in the employment and wages of low-skilled labor. Some recent research has focused separately on offshoring of services and examined its effect on overall employment. This focus is important because it gets away from the narrow theoretical confines of the Stolper-Samuelson theorem and the difficulty of testing it, and asks a more general question.29 Their results are not fully conclusive, but they broadly indicate that across the OECD, offshoring of services has led to reductions in overall employment. See, for example, Amiti and Wei (2004, 2006). Similarly, Schöller (2007a, 2007c) offer evidence of negative influence of service offshoring on German employment between 1991 and 2000. OECD (2007b) measures the effects of offshoring for 12 OECD countries, showing significantly negative effect of goods and services offshoring on manufacturing and service employment. The perceptions of a strong link between globalization and economic insecurity cited at the beginning of this paper are likely to be driven both by current reality and by predictions about 29
The theory has not gone un-criticized, both on grounds of relevance (see Samuelson, 2004) and on the grounds of the difficulty of measuring high-skill and low-skill labour (see Howell, 2002), and its weak predictive power for the case of developing (low-skill abundant) countries see, for example, (Berg, 2005).
42
the future. A number of recent studies predict a significant expansion of services offshoring. For example, Blinder (2006, 2007a, 2007b) has done a detailed analysis of the U.S. labor force, looking especially at jobs in services and the extent to which they are “personally delivered” or “impersonally delivered.” Personally-delivered services cannot be delivered electronically, such as child care or garbage collection. Impersonally-delivered services are those that can be delivered electronically without a significant loss of quality. These would include travel reservations and computer support (Blinder 2007a, p. 4). Blinder estimates that 30 to 40 million current jobs (22 to 29 percent of the current American workforce) are likely to fall into the category of impersonally-delivered services, and hence potentially subject to future offshoring. Blinder’s analysis is notable not just because the potential labor market displacement is large, but because the displacement affects all skill levels of the U.S. labor force. Blinder sees the potential wave of offshoring as driving a new industrial revolution, so that “the sectoral and occupational compositions of the U.S. workforce are likely to be quite different a generation or two from now. When that future rolls around, only a small minority of U.S. jobs will still be offshorable; the rest will have already moved off shore (p. 27).” Blinder’s analysis shows that the distinction between high-skill versus low-skill labor that characterizes most of the research to date, may be much less relevant in the near future.
43
Table 12: Labor Market Effects of Offshoring: Survey of Literature
Source
Country
Industry
Sectors Years
United States
Mfg.
450
Dependent Variable: Employment Amiti and Wei (2004, 2006)
1
Effects of Offshoring Goods
1992-2001
+ + +/ -
96 Amiti and Wei (2005)1
United Kingdom Mfg. Service
69 9
1995-2001
Schöller (2007a)1
Germany
Mfg.
36
1991-2000
1
Germany
Mfg.
35
1995-2004
Schöller (2007c) OECD (2007)
12 OECD-count. Mfg.
1
26
Service
Goods
2
United States
Mfg.
450
1977-1993
Feenstra and Hanson (1999)1
United States
Mfg.
450
1979-1990
+ +
Falk and Koebel (2002)2
Germany
Mfg.
26
1978-1990
no ev.
Sweden
Mfg.
20
1995-2000
+6 +7
Ekholm and Hakkala (2006)
2
Dependent Variable: Low-Skill Employment Falk and Koebel (2002)2
Germany
Mfg.
26
1978-1990
Geishecker (2002)2
Germany
Mfg.
22
1991-2000
France
Mfg.
not rep.
1977-1993
3
Strauss-Kahn (2004)
Hijzen, Görg, and Heine (2005)2 Ekholm and Hakkala (2006)
2
Geishecker (2006)2 Schöller (2007b)
1
United Kingdom Mfg.
50
1982-1996
Sweden
Mfg.
20
1995-2000
Germany
Mfg.
23
1991-2000
Germany
Mfg.
28
1991-2000
Mfg.
450
1977-1993
Dependent Variable: High-Skill Wages United States
Feenstra and Hanson (1999)1
United States
Mfg.
450
1979-1990
Geishecker and Görg (2004, 2007)4
Germany
Mfg.
21
1991-2000
not rep.
1991-2000
Horgos (2007)
Germany
Overall
not rep.
-8 -9 -
1992-2004 1991-2000
service HS-intensive LS-intensive
Source: Authors’ illustration. 1 2 imported inputs / total non-energy inputs imported inputs from same sector / output 3 4 5 vertical specialization imported inputs / output several measures 6 7 8 to low-income countries inhouse-offshoring medium-skill employment
44
Services Overall
Goods Services Overall no ev.
-
Goods
Feenstra and Hanson (1996)2
Mfg. Geishecker, Görg and Munch (2008)4 Germany United Kingdom Mfg.
+ + -
1995, 2000
Dependent Variable: High-Skill Employment Feenstra and Hanson (1996)
Services Overall
Services Overall
+ + + -9 -9 + + + -
9
to CEECs
F. Increase in the Elasticity of the Demand for Labor Rodrik (1997) and others have noted that greater openness to international trade would also raise the elasticity of labor demand with respect to both domestic and foreign wages. This increased sensitivity of labor demand to both domestic and foreign wage movements is another result of rise of global supply chains and offshoring. Anderson and Gascon (2007, p. 2) describe the situation well: “Traditionally, trade is thought of as exchanging different goods across nations, not the shifting of production from one country to another, followed by return shipments back to the original country. For example, in the past, U.S. firms would export good x and import good y. In the New Economy, U.S. firms export the capital k needed to produce good x to a country with lower production costs and then re import good x. Theoretically, disaggregating the value chain has allowed U.S. business to substitute cheaper foreign labor, increasing firms’ own price elasticity of demand for labor, raising the volatility of wages and employment, which increase worker insecurity.”
However, there have been very few estimates of the relationship between trade openness and the wage elasticity of labor demand. Slaughter (2001) studied U.S. manufacturing sector for the period of 1960-1991 and found that the elasticity of demand rose for U.S. production workers (a proxy for lower-skill workers) but not for non-production workers during this period. The elasticity increase was the greatest in sectors that experienced the most offshoring and technical change in the form of more computer related investment. Scheve and Slaughter (2004) find that FDI is the key aspect of globalization that raises the elasticity of labor demand. In a study of outward FDI by U.K. firms, they find that higher FDI is associated with higher elasticity of labor demand and greater volatility of wages and employment
45
G. Threat of Job Loss and Wage Suppression A less easily quantifiable channel through which globalization and especially offshoring influence wages and job security is the threat by companies to move production overseas. The following is how Freeman (1995, p. 21) describes the phenomenon: “It isn’t even necessary that the West import the toys. The threat to import them or to move plants to less-developed countries to produce toys may suffice to force low-skilled westerners to take a cut in pay to maintain employment. In this situation, the open economy can cause lower pay for low-skilled westerners even without trade.”
The issue has received considerable attention from theorists, but there is little empirical analysis.30 Bronfenbrenner (1997, 2000), studying the U.S. between 1993 and 1999, focuses more narrowly on unionization campaigns than on wages. She finds that a firm’s mobility did raise the credibility of the threat to move production offshore, and it influenced the decision of workers regarding unionization .The study indicates that unionization drives have a much lower rate of success in firms with a credible threat of mobility than in those considered immobile. Similarly, Choi (2001) looked at detailed outward foreign direct investment by U.S. manufacturers and found that increased outward FDI was associated with lower wage premiums for union members during the period 1983-1996.
5. Conclusion and Prospects for the Future This paper has shown that the new wave of globalization has raised worker vulnerability in industrialized countries by increasing the likelihood of getting unemployed, reducing employment and wage growth, lowering the overall labor share of national income, and raising inequality between high- and low-skilled workers. But vulnerability does not translate directly into economic insecurity. This depends on households’ capacity to cope with the risk of sudden 30
See Burke and Epstein (2001) for an overview and Rodrik (1999) for a game-theoretic approach.
46
loss of employment and income and on national policies to absorb such risks. The decline in household saving and massive growth in household debt reflect in part the dwindling ability of households to cope with employment and income shocks. Different industrialized countries have implemented very different sets of policies to cope with the situation arising from the new wave of globalization, and we have identified five “models.” At one extreme is the Anglo-Saxon model represented by the U.S. and other AngloSaxon economies with lax hiring and firing regulations, low unemployment benefits, and very limited spending on active labor market policies. At the other extreme is the Rhineland model, represented by France and Germany, who have relatively high levels of employment protection, large unemployment benefits, and significant spending on active labor market programs. Denmark and a few other countries seem to have combined elements the two, devising a model of “flexicurity,” characterized by labor market flexibility, high replacement income programs for the unemployed, and extensive active labor market programs. In recent years, France and Germany seem to be moving toward the flexicurity model, but are still far from reaching the Danish practice of this model. The analysis of offshoring presented in this paper indicates that flexicurity, as a way of managing state-market relations in a globalized economy, is probably not sufficient for ensuring economic security in the long run. What is instead required is re-channeling of the gains from offshoring away from finance and towards re-investment in the domestic economy. Tighter labor markets driven not by unsustainable consumer debt but by productivity-enhancing private investment is the long-term key to “sharing the gains” from globalization. This conclusion raises a question about the relationship between national policy and international competitiveness. It is often heard that greater state-provided social protection constitutes a cost to producers that reduces international competitiveness. The evidence, however,
47
indicates that the opposite may be true. The provision of greater social protection does not unambiguously reduce a country’s export competitiveness and in some cases may even increase it. In a study of OECD countries over the period 1978-1995, Milberg and Houston (2005) find that there are multiple paths to export competitiveness for industrialized countries. On the one hand there is the “high-road” relying on innovation, high productivity, and high levels of compensation and job security resulting from labor-management cooperation and state support for economic security. On the other hand is the “low road,” in which productivity growth hinges on intense conflict between labor and management rooted in job insecurity and a weak role for the state in guaranteeing social protection.31 This conclusion also applies to the six countries studied in this paper. Denmark and Germany, two countries with greater state intervention in sharing the burden of insecurity, have increased their trade surpluses considerably over the past 15 years, while the Anglo-Saxon countries have experienced massive trade deficit. Over the past 15 years, the new wave of globalization has led to a rise in the share of profits in the national income and decline in the share of wages, increasing inequality in the society. Unless reversed, this tendency toward polarization is likely to get stronger as globalization gradually engulfs more sections of the labor force, including high-skilled and service sector workers, and thus spreads insecurity to wider sections of the population. In industrialized democracies such polarization and widespread insecurity may call into question the very merit of liberal trade policies and the efficacy of the traditional (Anglo-Saxon and Rhineland) arrangements between states and markets. The response may take a variety of forms, including a dangerous protectionist backlash. It is therefore urgent to formulate policies and erect an institutional structure that can address effectively the challenges raised by the new wave of globalization. 31
Belloc (2004) finds a similar result.
48
References Amiti, M. and Wei, S.-J. (2004) “Service Outsourcing, Productivity and Employment: Evidence from the US”, Research Department, Trade Unit, International Monetary Fund, Washington, First draft – May 2004. Amiti, M. and Wei, S.-J. (2005) „Fear of service outsourcing: is it justified?“, Economic Policy, pp. 305-347, April. Amiti, M.; Wei, S.-J. (2006) “Service Offshoring, Productivity and Employment: Evidence from the US”, CEPR Discussion Paper, No. 5475, February. Anderson, R. and C. Gascon (2007) “The Perils of Globalization: Offshoring and Economic Security of the American Worker,” Working Paper 2007-004A, Research Division, Federal Reserve Bank of St. Louis. Anderton, B. and P. Brenton (1999) “Outsourcing and Low-Skilled Workers in the UK,” Oxford Bulletin of Economic Research, V. 51, No. 4, pp. 267-285. Arndt, S. and H. Kierzkowski, editors (2001) Fragmentation: new production patterns in the world economy, Oxford: Oxford University Press. Belloc, M. (2004) “Do labor market institutions affect international comparative advantage? An empirical investigation,” mimeo, Department of Economics, University of Siena. Berg, J. (2005) Miracle for Whom? Chilean Workers Under Free Trade,” New York: Routledge. Bhagwati, J., Panagariya, A. and Srinivasan, T.N. (2004) “The Muddles over Outsourcing”, Journal of Economic Perspectives, V. 18, No. 4, Fall, pp. 93-114. Blecker, R. and A. Razmi (2006) “Developing Country Exports of Manufactures: Moving Up the Ladder to Escape the Fallacy of Composition,” American University, Dept. of Economics, Working Paper No. 2006-06, April. Blinder, A. (2006) “Fear of Offshoring,” mimeo, Princeton University. Blinder, A. (2007a) “How Many U.S. Jobs Might Be Offshorable?”, CEPS Working Paper No. 142, March. Blinder, A. (2007b) “Offshoring: Big Deal, or Business as Usual?”, CEPS Working Paper No. 149, June. Boeri, T. (2002) “Making Social Europe(s) Compete,” mimeo, University of Bocconi and Gondazione Rodolfo Debenedetti. Borga, M. (2005) “Trends in Employment at US Multinational Companies: Evidence from Firm-Level Data,” Brookings Trade Forum 2005, The Brookings Institution, Washington D.C,, pp. 135-164.
49
Brainard, L. and D. Riker (2001) “Are US Multinationals Exporting US Jobs?,” in Globalization and Labour Markets, D. Greenaway and D. Nelson, editors, V. 2, Northampton, MA: Edward Elgar. Bronfenbrenner, K. and S. Luce (2004) “The Changing Nature of Corporate Global Restructuring: The Impact of Production Shifts on Jobs in the US, China, and Around the Globe,” submitted to the US-China Economic and Security Review Commission, Washington, D.C. Burke, J. and G. Epstein (2001) “Threat Effects and the Internationalization of Production,” mimeo, PERI, University of Massachusetts, Amherst. Campa, J. and L. Goldberg (1997) “The Evolving External Orientation of Manufacturing Industries: Evidence from Four Cuntries,” NBER Working Paper 5919, February. Choi, M. (2001) “Threat Effect of Foreign Direct Investment on Labor Union Wage Premium, PERI Working Paper 27, University of Massachusetts at Amherst. Clasen, J. (2007) “Flexicurity—A New Buzzword in EU Labour Market Policy,” mimeo, University of Edinburgh School of Social and Political Studies, presented at Scottish Policy Innovation Forum, Edinburge, Nov. 1. Crotty, J. (2007) “Financialization and Capital Accumulation in the Non-Financial Corporate Sector: A Theoretical and Empirical Investigation on the U.S. Economy, 1973-2003, mimeo. Desai, M., F. Foley and J. Hines (2006) “Foreign Direct Investment and Domestic Economic Activity,” Harvard Business School Working Paper, November. Ekholm, K. and Hakkala, K. (2006) “The Effect of Offshoring on Labour Demand: Evidence from Sweden”, CEPR Discussion Paper No. 5648, April. Ellis, L. and K. Smith (2007) “The global upward trend in the profit share,” BIS Working Paper No. 231, Bank for International Settlements. Falk, M. and Koebel, B.M. (2002) “Outsourcing, Imports and Labor Demand”, Scandinavian Journal of Economics, Volume 104, No. 4, pp. 567-586 Feenstra, R. and G. Hanson (2001) “Global Production Sharing and Rising Inequality: A Survey of Trade and Wages,” mimeo, Department of Economics, University of California at Davis. Feenstra, R.C. and Hanson, G.H. (1996) “Globalization, Outsourcing and Wage Inequality”, American Economic Review, Vol. 86, No. 2, pp. 240-245. Feenstra, R.C. and Hanson, G.H. (1999) “The Impact of Outsourcing and High-Technology Capital on Wages: Estimates for the United States, 1979-1990”, The Quarterly Journal of Economics, Vol. 114, No. 3, pp. 907-940.
50
Fors, G. and A. Kokko (2001) “Home Country Effects of FDI: Foreign Production and Structural Change in Home Country Operations,” in M. blomstrom and L. Goldberg, editors, Topics in Empirical International Economics: A Festschrift in Honor of Bob Lipsey, Chicago: University of Chicago Press. Freeman, R. (1995) “Are your wages set in Beijing?” Journal of Economic Perspectives, V. 9, No. 3, pp. 15-32.. Freeman, R. (2007) in E. Paus, editor Global Capitalism Unbound: Winners and Losers from Offshore Outsourcing, London: Palgrave Macmillan. Geishecker, I. (2002) “Outsourcing and the Demand for Low-skilled Labour in German Manufacturing: New Evidence”, DIW Discussion Paper, No. 313, November 2002. Geishecker, I. (2006) “Does Outsourcing to Central and Eastern Europe really threaten manual workers’ jobs in Germany?” The World Economy, May 2006, Vol. 29, Issue 5, pp. 559583 Geishecker, I. and Görg, (2007) “Winners and losers: A Micro-level Analysis of International Outsourcing and Wages”, CEPR Discussion Paper No. 6484, August 2007. Geishecker, I. and Görg, H. (2004) “Winners and Loosers: Fragmentation, Trade and Wages Revisited”, IZA Discussion Paper, No. 982. Geishecker, I.; Görg, H.; Munch, J.R. (2008) “Do labour market institutions matter? Microlevel wage effects of international outsourcing in three European countries”, Kiel Institute for the World Economy, Kiel Working Papers No. 1404. Gereffi, G. (1994) “The organization of buyer-driven global commodity chains: How U.s. retailers share overseas production networks,” in G. Gereffi and M. Korzeniewicz, editors, Commodity Chains and Global Capitalism, Westport, CT: Praeger. Gereffi, G., J. Humphries and T. Sturgeon (2005) “The Governance of Global Value Chains,” Review of International Political Economy, V. 12, No. 1, February, pp. 78-104. German Marshall Fund (2007) “Perspectives on Trade and Poverty Reduction: A Survey of Public Opinion”, Key Findings Report. Gibbon, P. (2004) “At the Cutting Edge?: Financialisation and UK Clothing Retailers’ Global Sourcing Patterns and Practices,” Gordon, R. and I. Dew-Becker (2006) “Unresolved Issues in the Rise of American Inequality,” mimeo, Department of Economics, Northwestern University. Grossman and Rossi-Hansberg (2007) “The Rise of Offshoring: It’s Not Wine for Cloth Anymore,” Federal Reserve Bank of Kansas City. Guscina, A. (2006) “Effects of Globalization on Labor’s Share in National Income,” IMF Working Paper 06/294, International Monetary Fund: Washington, D.C. 51
Hacker, J. (2006) The Great Risk Shift, New York: Oxford University Press. Hamermesh, D. (1993) Labor Demand, Princeton, NJ: Princeton University Press. Harrison, A. (2002) “Has Globalization Eroded Labor’s Share? Some Cross-Country Evidence,” mimeo, Department of Agricultural and Resource Economics, University of California, Berkeley. Harrison, A. and M. McMillan (2007) “Offshoring Jobs? Multinationals and US Manufacturing Employment,” mimeo, Department of Agricultural and Resource Economics, University of California, Berkeley. Hijzen, A., Görg, H. and Hine, R.C. (2005) “International Outsourcing and the Skill Structure of Labour Demand in the United Kingdom”, The Economic Journal, Vol. 115, Issue 506, pp. 860-878, October. Horgos, D. (2007) “Labor Market Effects of International Outsourcing: How Measurement Matters”, SOEP papers on Multidisciplinary Panel Data Research No. 58, October 2007, DIW Berlin. Howell, D. (2005) Fighting Unemployment: The Limits of Free Market Orthodoxy, Oxford: Oxford University Press. ILO (2004) Economic Security for a Better World IMF (2005) World Economic Survey. Jensen, B. and L. Kletzer (2005) “Tradable Services: Understanding the Scope and Impact of Services Offshoring, Brookings Trade Forum. Kalmbach, P.; Franke, R.; Knottenbauer, K.; Krämer, H. (2005): Die Interdependenz von Industrie und Dienstleistungen, Zur Dynamik eines komplexen Beziehungsgeflechts, Berlin, 2005 Kierkegaard, J. (2007) “Offshoring, Outsourcing, and Production Relocation—Labor-Market Effects in the OECD Countries and Developing Asia”, Peterson Institute Working Paper 07-2, April. Kletzer, L. (2001) “Job Loss from Imports: Measuring the Loss”, Institute for International Economics, Washington, DC. Levy, D. (2005) “Offshoring in the New Global Political Economy,” Journal of Management Studies, V. 42, No. 2, May. Mann, C. (2003) “Globalization of IT Services and White Collar Jobs: The Next Wave of Productivity Growth,” Institute for International Economics, Number PB03-11, December. Mayer, J. (2003) “The Fallacy of Composition: A Review of the Literature”, UNCTAD Discussion paper, No 166, February.
52
Milberg, W. (2007b) “Shifting Sources and Uses of Profits: Sustaining U.S. Financialization with Global Value Chains,” mimeo, Schwartz Center for Economic Policy Analysis, New School for Social Research. Milberg (2007a) “Export Processing Zones, Industrial Upgrading and Economic Development,” International Labor Organization, Geneva. Milberg, W. (2004) “The changing structure of international trade linked to global production systems: What are the policy implications?,” International Labour Review. Milberg, W. and E. Houston (2005) International Review of Applied Economics. Milberg, W. et al. (2007) “Dynamic Gains from U.S. Services Offshoring: A Critical View”, in E. Paus, editor Global Capitalism Unbound: Winners and Losers from Offshore Outsourcing, London: Palgrave Macmillan. Muendler, M. and S. Becker (2006) “Margins of Multinational Labor Substitution,” University of California at San Diego Working Paper, April. OECD (2005) Employment Outlook, Paris: OECD. OECD (2007a) Economic Outlook, Paris: OECD. OECD (2007b) Offshoring and Employment: Trends and Impact, July OECD (2007c) Employment Outlook, Paris: OECD. Palpacuer, F., P. Gibbon and L. Thomsen (2005) “New Challenges for Developing Country Suppliers in Global Clothing Chains: A Comparative European Perspective,” World Development, Rodrik (1999) Making Openness Work: The New Global Economy and the Developing Countries, Overseas Development Council, Washington, DC. Rodrik, D. (1997) Has Globalization Gone Too Far?, Institute for International Economics, Washington, DC. Sachs, J. and H. Shatz (1994) “Trade and Jobs in U.S. Manufacturing,” Brookings Papers on Economic Activity. Samuelson, P. (2004) “Where Ricardo and Mill Rebut and Confirm Arguments of Mainstream Economists Supporting Globalization”, Journal of Economic Perspectives, V. 18, No. 3, Summer, pp. 135-146. Scheve, K. and M. Slaughter (2001) Globalization and the Perceptions of American Workers, Washington, D.C.: Institute for International Economics.
53
Schöller, D. (2007a) “Service Offshoring: Eine Herausforderung für die Beschäftigung in Deutschland?“, Wirtschaftsdienst (Journal for Economic Policy Analysis), Vol. 87, Issue 04 Schöller, D. (2007b) “Service Offshoring and the Demand for Less-Skilled Labor: Evidence from Germany”, Hohenheimer Discussion Papers, No. 287/2007, University of Hohenheim, Stuttgart, available online from: https://www.unihohenheim.de/RePEc/hoh/papers/287.pdf Schöller, D. (2007c): Service Offshoring and its Impact on Productivity and Labor Demand in Germany: Evidence from Revised Input-Output Data, November 2007, available online from: https://www.uni-hohenheim.de/1597.html?typo3state=persons&lsfid=5455 Scott, R. (2007) “The Wal-Mart Effect: Its Chinese Imports Have Displaced Nearly 200,000 U.S. Jobs,” Issue Brief #235, Economic Policy Institute, Washington, D.C. Shephard (1953) Slaughter, M. (2001)”International Trade and Labor-Demand Elasticities," Journal of International Economics, V. 54, No. 1. Stockhammer, E. (2004) “Financialisation and the slowdown of accumulation,” Cambridge Journal of Economics, V. 28, pp. 719-741. Strauss-Kahn, V. (2003) “The Role of Globalization in the Within-Industry Shift Away from Unskilled Workers in France”, NBER Working Paper No. 9716, May 2003. Sturgeon, T. (2002) “Modular Production Networks: A New American Model of Industrial Organization,” Industrial and Corporate Change, V. 11, No. 3, pp. 451-496. Taylor, L. et al. (2005) “U.S. Macro Imbalances: Trends, Cycles and Policy Implications,” Policy Note, Schwartz Center for Economic Policy Analysis, the New School, December. Temin, P. and F. Levy (2006) “Inequality and Institutions in 20th Century America,” mimeo, Department of Economics, MIT. United Nations (2008) World Economic and Social Survey 2008: Overcoming Economic Insecurity, United Nations, New York. Wood (1995) “How Trade Hurt Unskilled Workers”, Journal of Economic Perspectives, V. 9, No. 3, pp. 57-80. Wood, A. (1994) North-South Trade, Employment and Inequality: Changing Fortunes in a Skill-Driven World, Oxford: Clarendon Press.
54