Going Wider with Convolution for Image Denoising
arXiv:1707.05414v1 [cs.CV] 17 Jul 2017
Peng Liu Department of Biomedical Engineering University of Florida Gainesville, FL 32611
[email protected]
Ruogu Fang Department of Biomedical Engineering University of Florida Gainesville, FL 32611
[email protected]
Abstract “Deeper is better” has been recently considered as a principal design criterion for building convolutional neural networks due to its favorable performance in both high-level and low-level computer vision tasks. In this paper, inspired by the importance of image priors in low-level vision tasks, we introduce Wide Inference Network (WIN) with increased filter number and size for low-level vision tasks such as natural image denoising. The key to our approach is the observation that mapping from noisy to clean images primarily relies on the priors learned from feature distributions in the training stage, instead of reasoning through stacked non-linear layers. We evaluate WIN on additive white Gaussian noise (AWGN) and demonstrate that by learning the prior distribution in natural images, WIN-based network consistently achieves significantly better performance than current stateof-the-art deep CNN-based methods in both quantitative and visual evaluations.
1
Introduction
Over the last decade, deep convolutional neural networks (CNNs) have revolutionized high-level vision tasks such as visual recognition, motion analysis, and object segmentation [2, 6, 14]. Recently, CNNs have also been applied to low-level vision tasks such as super-resolution (SR) [13], image denoising [26, 16], and compression artifacts reduction [4]. In these tasks, a CNN is typically trained with supervised learning to represent a function – a mapping from a low-quality observation to a latent high perceptual visual image, with the goal of representing a restorer either removing the various types of noise or minimizing the effects of different artifacts from a degraded image. “Deeper is better” typically has been generally accepted as a design criterion for building more powerful CNNs. The deep CNNs, such as VGG [21], GoogleNet [23], and ResNet [7], indeed have achieved a series of breakthroughs in high-level vision tasks. These deep nets have increasing number of layers of 19, 22, and 152 convolution layers1 , with top 5 error rate on ILSVRC of 7.3%, 6.7%, and 3.57% respectively. However, in contrast to the dominating privilege of deep nets in high-level vision tasks, most of recent works in low-level vision domain, such as DnCNN [26] and RED-Net [16], with up to 20 and 30 layers respectively, have not yet shown remarkable advantages compared to early methods (see Table 1). Obviously, in low-level vision tasks, which typically emphasizing more pixel-level features, depth is not the key. The success of deep CNNs in high-level vision domain is essentially due to a complicated nonlinear approximate function, which is trained on a large amount of labeled data through stacked convolution and nonlinear layers (e.g., ReLU [19]). In addition, deep CNNs naturally integrate low / mid / high level features [25] and the “levels” of features can be enriched by the number of stacked layers (depth). Nevertheless, the extracted high-level features are not the key in low-level vision tasks. Instead, priors can be an important factor, which can capture statistical regularities of pixel-level features. A prior over the image space, such as non-local similarity, can help to come up with a very good estimate of 1
Only convolution layers are counted for the depth of CNN in general.
the actual “undo” function to compensate for or undo defects which degrade an image [15]. In image denoising, a notable prior in term of various types of noise is the pixel distributions implied in the noisy images, most of which follow regular distributions (e.g., Gaussian). Table 1: Comparison of the structures of the most of the recent deep CNNs [26, 16] for image denoising and the average peak signal-to-noise ratio (PSNR) improvement over one of the state-ofthe-art non CNN-based method: BM3D [3]. The results are evaluated on the gray-scale BSD100 and BSD200 dataset [17]. As one can see, the average elevated margins measured by PSNR have not even surpassed 1 dB yet. Moreover, by comparing the gains obtained on BSD100 and BSD200, one can see that the generalization capability of both deep networks [26, 16] decreases significantly as the number of unseen test images increases. Methods # Layers # Filters Filter Size Gain-BSD100 (dB) Gain-BSD200 (dB) DnCNN [26] RED-Net [16]
20 30
64 64
3×3 7×7
0.7 0.73
0.56 0.43
Based on the above analysis, in this paper, we propose a CNN-based framework that can effectively learn feature distribution from noisy observations to form a prior for image denoising task. Our model, termed a Wide Inference Networks (WIN), can capture the pixel-level distribution information, a capability which narrow and deep networks lack. Here we introduce the concept of “width” of the networks indicating both the number of filters in each layers and the size of the filters, as both parameters reflect the representation capability in one layer, in contrast to “depth” which demonstrates the non-linear representation power over the layers. Specifically, we demonstrate the effectiveness of WIN within only 5 wider convolution layers, termed WIN5, in the main denoising task on additive white Gaussian noise (AWGN). The performance gain is impressive. The key to our proposed network architecture is to employ larger perceptions fields through wider and shallower networks with more concentrated convolutions to capture the prior image distribution from the noisy images, and yields better overall generalization power to new, unseen noisy images.
2
Background
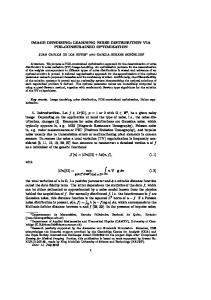
In this section, we provide background on distributions of image noise and spatial feature, the deep CNN-based image denoising methods[3, 26, 16], regularization techniques, and learning strategies for generalization. In the sequel, we show that CNNs can be modeled and constructed with stronger capability to extract the spatial feature distribution, which can then be used as a prior for image denoising. Image Noise and Spatial Features Distribution: Image noise is pixel-level random variations and typically follows a certain distribution. Gaussian noise approximates a Gaussian distribution and is usually used to mimic a realistic environment based on the Law of Large Numbers (LLN), which covers a very broad spectrum of practical applications. One common assumption is additive white Gaussian noise (AWGN) with different standard deviations, which can be formulated as yi = xi + n(size(xi ), σ), where y is the noisy image, x is the clean image, σ is standard deviations of AWGN and determines the noise level. n represents the Gaussian noise added to x and essentially is a function that can return a matrix (with the same size of x) of Gaussian distributed random numbers, and i is the index of the images from the dataset. From image histograms shown in Fig. 1, one can see that no matter how different the features in xi are, as long as σ and the sizes of xi are same, the different noisy images yi always have very similar pixel distributions. Such consistent representations are highly likely to be learned by CNNs. Deep CNN-based Models: The deepCNN-based state-of-the-art denoising models, DnCNN [26] and RED-Net [16], stem from the success of deep nets in high-level vision tasks [21]. Particularly, DnCNN [26] adopts a 20 layers deep architecture, a learning strategy of residual learning [12], and a regularization method of batch normalization [9]. RED-Net [16] employs a 30 layers deeper structure with skip connections (SK) added to connect corresponding layers of convolution to the deconvolution, and is justified by the residual network [12]. In deep structures, learning strategies (e.g.residual learning [12]) and regularization methods (e.g.batch normalization [9]) also work for accelerating the learning process and boosting performance. However, these models obtain good 2
1800
2000
3000
1600
1500
Number of pixel
Number of pixel
Number of pixel
1200 1000
1000
500
800 600 400
0
Pixel value
0
50
100
150
Pixel value
200
250
0
(a) Ground-truth-I
2000 1500 1000
1000
500
500
200
0
Number of pixel
2500
1400
1500
0
Pixel value
50
100
150
Pixel value
200
0
250
(b) Noisy-I
0 50
100
150
Pixel value
200
(c) Ground-truth-II
250
0
50
100
150
Pixel value
200
250
(d) Noisy-II
Figure 1: Similar distributions of histograms of two different images added additive white Gaussian noise (AWGN) with same noise level σ = 50. performance at the cost of growing complexity along with increasing network depth. Such strategy typically suffers from gradient vanishing, overfitting and degradation2 . Learning Strategy: Residual learning: Learning a residual representation is easier than estimating the desired objective directly since residual learning [12] introduces more prior to the current objective. Skip Connection is one form to introduce residual representation. Skip connection from input-end to output-end (input-to-output), like the one employed in VDSR [13], is able to compensate the lost details and perform residual learning simultaneously, formally, which holds xi = yi + R(yi ), where (R(yi ) ≈ −n) is an embedded function for inferring residual–the opposite of noise added on yi . In RED-Net [16], the input is connected with the output to form a residual learning. In addition, there are connections every a few layers from convolutional feature maps to their mirrored deconvolutional maps to ease back-propagation, and reuse the otherwise lost details during deconvolution. Another way to introduce residual learning is a mapping from an input observation to the corresponding precalculated residual, which is adopted in DnCNN [26]. It aims to learn a mapping function T (yi ) ≈ n, and then it has xi = yi − T (yi ), where x, y, i and n are the same notation as aforementioned. Here T is the objective output of DnCNN [26], and xi is calculated separately after T maps yi to the corresponding noise from the network. Regularization: Batch Normalization: One key to the success of DnCNN [26] is batch normalization (BN) [9], which solves a problem called internal covariate shift, while accelerating network learning and boosting accuracy. First of all, as data flow through a deep CNN, the weights and parameters adjust the output maps at each layers, some times leading to very large or small values in the intermediate feature maps. By normalizing the data in each mini-batch, this problem can be mostly avoided. Furthermore, BN also impacts gradient flow. Thus it can reduce the dependence on the scale of the parameters and the initial values, and prevent the network from getting stuck in saturated modes caused by certain non-linearities.
3
Wide Inference Network
The Wide Inference Network (WIN) is based on the plain convolutional neural network architecture with an exploration of the impact of the “width” of the network on the low-level vision tasks such as image denoising. In this section we introduce the investigation of the Wide Inference Network (WIN) in three aspects: (1) How to represent and optimize WIN to find an efficient and high performing architecture that can learn the prior effectively; (2) The impact of residual learning [12] and batch normalization (BN) [9] when employed in WIN. (3) The implementation details in the training stage. 3.1
Determining “Width”
In this section, we show an optimization process of a plain and wide denoising CNN to obtain a competitive model: WIN5. In order to find the parameters that make the major contributions to 2
Degradation refers to the reduction in accuracy with increasing depth of network after reaching a maxima.
3
2
4 3
5Layers−64K 5Layers−128K 5Layers−192K 5Layers−256K
2
5
4
3
5L−128K−3x3 5L−128K−5x5 5L−128K−7x7 5L−128K−9x9 5L−128K−11x11 5L−128K−13x13
5 4
Loss Error
3
5
Loss Error
Loss Error
4
3Layers 5Layers 6Layers 7Layers 9Layers 10Layers
Loss Error
5
WIN5 WIN5−R WIN5−RB RED−Net
3 2
2
1
1
1 0 5 10 15 20 25 30 35 40 45 50 55 60 65 Epochs
(a) Number of layers
0 5 10 15 20 25 30 35 40 45 50 55 60 65 70 Epochs
1 0 5 10 15 20 25 30 35 40 45 50 55 60 Epochs
(b) Number of filters
(c) Sizes of filter
0 5 10 15 20 25 30 35 40 45 50 55 60 Epochs
(d) WINs comparison
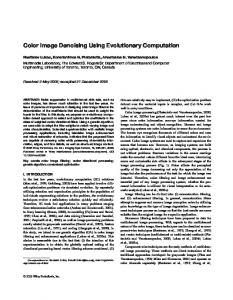
Figure 2: Comparison of loss error on validation dataset during training for CNNs with different structure components: (a) Number of Layers; (b) Number of Filters; (c) Size of Filters; (d) Proposed shallow wider nets with the state-of-the-art method RED-NET [16]. Note: Lower is better. performance improvement, we compare the loss errors on the same validation dataset during training from three groups of experiments of wide inference network with different number of layers, different number of filters for each layer, and different filter sizes respectively. The results are shown in Fig. 2. CNNs are made of a series of layers. The convolution (Conv) layer is the core building block of a convolutional network that does most of the computationally heavy lifting. Following the principle in Striving for Simplicity: The All Convolutional Net [22], we build WIN5 with a sequence of Conv Layers without Pooling and fully connected (FC) layers, and each Conv layer is followed by a ReLU [19], except for the last layer. A Conv layer is composed of a set of neurons with learnable weights and biases. The number of neurons and weights are referred to as the width of a CNN. Four hyper-parameters control the size of the width: the number of layers (L), the number of filters (K), the size of filters (F ) and the input volume (D) of each Conv layer. The input volume of each layer is determined by the patch size of the input images (only for the first Conv layer) or the output volume size of the previous Conv layer. We follow the common effective settings of patch size [26] and keep the output volume of each layer the same size as the patch size. Thus, we focus on comparing and analysing the main performance factors: L, K and F . The following sections compare the performance of several WINs in the same experimental setting. All comparing experiments are performed on a common data set BSD500 [17] applied AWGN with noise level σ = 50. The Number of Layers (L). As shown in Fig. 2(a), WIN with the number of layers L = 5 outperforms both shallower or deeper networks other than L = 5. In addition, “the deeper the worse” (degradation) is apparent, which is caused by the loss of image details through the deep network. Since all the filter weights in a convolutional network are learned, information loss is caused primarily by the output that CNN is mapped to. But the first few layers of the network usually learn small, local features and the network progressively discriminatory elements as we go deeper [25]. The Number of Filters (K). As we can see in Fig. 2(b), WIN with K = 128 achieves remarkable performance gains than the network with K = 64. K = 128 is found to be the optimal value for high performance in this denoising task. As K in each layer increases, the performance improves. However, as K is more than 256, the performance enhancement plateaus. Meantime, the corresponding training time and computation complexity always keep growing vastly. The Size of Filters (F ). From Fig. 2(c), F = 7 × 7 is able to improve performance remarkably compared to smaller F . In general, larger F leads to better performance. However, the performance improvement margin diminishes when F is greater than 7 × 7. Similar to the number of filters K, larger F also dramatically increases both training time and computation complexity. To sum up, from the overall performance and efficiency point of view, WIN with L = 5, K = 128, F = 7 × 7 is potentially the optimal denoising model among plain shallow CNNs, and we refer it as WIN5 since it has 5 layers. Furthermore, WIN5 may achieve much more performance gains if we can cope with the degradation during training, as we address in the next Section 3.2.1 3.2 3.2.1
Optimizing WIN5 WIN5-R: WIN5 + Residual Learning
Let us consider a Gaussian noisy observation y = x + n. Here, y and x are a noisy observation and the corresponding latent clean image. n represents the Gaussian noise to be added to x. DnCNN [26] aims to learn a mapping function T (y) ≈ n, and then it has x = y − T (y). For WIN5-R, a skip 4
connection from input-end to output-end is added to make up the lost details and perform residual learning simultaneously, formally, which holds x = y + R(y) where R(y) ≈ −n. In addition, as the end-to-end residual learning needs to estimate the weights Θ represented by the convolutions, we minimize the Mean Squared Error (MSE) between noisy images (input yi ) and the clean versions as the ground-truth (label xi ) l (Θ) =
N 1 X 2 kyi + R (yi ; Θ) − xi kT 2N i=1
(1)
as the loss function to learn the trainable Θ. In Fig. 2(d), we can see that WIN5-R (blue line) with a input-to-output skip connection can enhance the denoising performance by not only weakening degradation but also exploiting a faster and easier residual learning. Comparison with RED-Net. Fig. 2(d) provides the comparison between our proposed shallow and wider nets with the state-of-the-art method RED-NET [16] in terms of loss error. All our WIN-based architecture remarkably outperform RED-Net [16] which is deeper and thinner. 3.2.2
WIN5-RB: WIN5+Residual+Batch Normalization
In Fig. 3, we illustrate the evolutionary architectures of WIN5, WIN5-R, and WIN5-RB. Architectures. Three proposed models have INPUT INPUT INPUT the identical basic structure: L = 5 layers and Conv+ReLU Conv+BN+ReLU Conv+ReLU K = 128 filters of size F = 7 × 7 in most convolution layers, except for the last one with Conv+ReLU Conv+BN+ReLU Conv+ReLU K = 1 filter of size F = 7 × 7. The differences Conv+ReLU Conv+ReLU Conv+BN+ReLU among them are whether batch normalization (BN) and an input-to-output skip connection are Conv+BN+ReLU Conv+ReLU Conv+ReLU involved. WIN5-RB has two types of layers Conv Conv Conv+BN with two different colors. (a) Conv+BN+ReLU [19]: for layers 1 to L − 1, BN is added between OUTPUT OUTPUT OUTPUT Conv and ReLU [19]. (b) Conv+BN: for the last (c) WIN5-RB (a) WIN5 (b) WIN5-R layer, K = 1 filters of size F = 7 × 7 is used to reconstruct the R(y) ≈ −n. In addition, a Figure 3: Architectures (a) WIN5 (b) WIN5-R (c) shortcut skip connecting the input (data layer) WIN5-RB. with the output (last layer) is added to merge the input data with R(y) as the final recovered image. Regularization of BN. Batch Normalization (BN) has a regularizing effect of improving the generalization of a learned model, which is motivated by the fact that data whitening improves performance. Particularly, this whitening process performs a linear transformation applied to the convolutions of the bottom layers before feeding into the top layers (ReLU [19]). In WIN5 and WIN5-R without BN, the nonlinear transformation of Lth layer is able to be formalized as Tn (OL−1 , Θ), where OL−1 is the output of the (L − 1)th layer (Conv), nevertheless, with BN in WIN5-RB, which is changed to be Tn (BN (OL−1 ), Θ)
(2)
where BN is divided in two sub-operations: the first sub-operation normalizes the output of the bottom layer (Conv or ReLU [19]), dimension-wise with zero mean and unit variance within a batch of training images; the second sub-operation optimally shifts and scales these normalized activations. The learned parameters (means, variances, scaling and shifting) involved in the two sub-operations during training are utilized to infer R(y) during testing. “Wider” BN. The integration of BN [9] into more filters will further preserve the prior information of the training set. Actually, a number of state-of-the-art studies [5, 11, 24] have adopted image priors (e.g. distribution statistic information) to achieve impressive performance. In our proposed models, the precomputed normalization parameters (means and variances) are used along with other trained network parameters to predict the distribution of R(y). The sparse distribution statistics performed by convolution and ReLU [19] layers are updated during the training process. Eventually, their effects are embedded into these learned normalization parameters that are simply a linear transformation applied to each activation. They transformation can be merged with respectively trained scaling or shifting parameters after the training of the network. Formally, we can present the two sub-operations 5
Table 2: The average results of PSNR (dB) / SSIM / Run Time (seconds) of different methods on the BSD200test [18] (200 images). Note: WIN5-RB-B (blind denoising) is trained on larger number of patches as data augmentation is adapted.This is the reason why WIN5-RB-B (trained on σ = [0 − 70]) can outperform WIN5-RB-S (trained on single σ = 30, 50, 70 separately) in some cases. PSNR (dB) / SSIM σ
BM3D [3]
RED-Net [16]
DnCNN [26]
WIN5
WIN5-R
WIN5-RB-S
WIN5-RB-B
30 50 70
28.57/0.7823 26.44/0.7028 25.23/0.6522
29.05/0.8049 26.88/0.7230 26.66/0.7108
29.13/0.8060 26.99/0.7289 25.65/0.6709
28.93/0.7987 28.57/0.7979 27.98/0.7875
30.94/0.8644 29.38/0.8251 28.16/0.7784
33.62/0.9193 31.79/0.8831 30.34/0.8362
33.27/0.9263 32.18/0.9136 31.07/0.8962
30 50 70
1.67 2.87 2.93
69.25 70.34 69.99
13.61 13.76 12.88
15.78 22.72 19.28
20.39 21.79 20.86
15.82 13.79 13.17
Run Time(s) 15.36 16.70 16.10
during test as − µL,K ˆ L,K = OL−1,K q O s2L,K + ε
(3)
ˆ L,K ) = γL,K O ˆ L,K + βL,K BN L,K (O
(4)
ˆ L,K is the normalized output of the convolution of the K filter in (L − 1) layer (Conv) where O using the corresponding mean µL,L and variance s2L,K of training set in the Lth layer (BN); γL,K and βL,K preserve the scaling and shifting parameters for correction after the normalization by learning from the training stage. They perform a linear transformation applied to the normalized output of each convolution layer. As a result, we can see in Fig. 2(d) that the generalization capability improved by “wider” BN can be observed distinctly by comparison experiments between WIN5-R (Blue line) and WIN5-RB (Red line). th
3.3
th
Implementation Details
We implement the training with step learning rate policy along with basic learning rate 0.1. The stochastic gradient descent algorithm (SGD) with momentum 0.9 is adopted. Meantime, weight decay 1e−4 and clip gradient 0.1 also are utilized to optimise training process. The batch size is deployed as 64 to balance the BN performance and training time.
4 4.1
Experiments Datasets for Training and Testing
Training dataset. We follow the experimental setup of RED-Net [16] and use the BSD200-train (200 images) of the BSD500 dataset [18] as our base training set and the BSD100-val of the [18] is used for validation. In addition, data augmentation (rotation or flip) is used to increase the sample size only for blind denoising model-WIN5-RB-B. We follow [13, 26] to set the patch size as 41 × 41, and crop 1,239,808 patches with the stride of 14 to train the model. We use the randn function of the internal MATLAB functions to add AWGN with different noise levels, i.e., σ = 30, 50, 70. Test dataset. We use BSD200-test [18] and the 12 standard test images, termed Set12, as shown in Fig. 4 for the evaluation. As there are various versions of Set12, we choose to resize the 12 images to be 481 × 321, same as the size of the majority of the images in training set (BSD200-train) [18].
Figure 4: The 12 widely used testing images (Set12). 4.2
Comparison with the State-of-the-Art
We compare the proposed WIN5, WIN5-R and WIN5-RB methods with BM3D [3], DnCNN [26], RED-Net [16] for Gaussian denoising with σ = 30, 50, 70. BM3D [3] is non-CNN based while 6
Table 3: The average PSNR(dB) / SSIM / Run Time (seconds) of different methods on the 12 standard test images. WIN5-RB-B (blind denoising) is trained for σ = [0 − 70]. The best results are highlighted in bold. PSNR (dB) / SSIM σ
BM3D [3]
RED-Net [16]
DnCNN [26]
WIN5
WIN5-R
WIN5-RB-S
WIN5-RB-B
30 50 70
30.41/0.8553 27.92/0.7947 26.32/0.7451
30.48/0.8610 28.03/0.7988 27.95/0.7950
30.65/0.8644 28.18/0.8054 26.52/0.7546
30.42/0.8592 29.52/0.8376 28.89/0.8276
33.35/0.9142 31.65/0.8896 30.09/0.8529
36.96/0.9495 34.12/0.9074 32.32/0.8689
35.83/0.9460 34.13/0.9323 32.52/0.9145
30 50 70
1.47 2.40 2.30
62.71 63.66 63.20
9.24 9.83 9.42
13.58 14.52 13.86
14.76 15.38 15.41
16.95 15.71 13.56
Run Time(s)
(a) Ground-truth
(e) DnCNN / 23.39dB / 0.6066
14.39 14.82 14.55
(b) Noise=70 / 12.35dB / 0.1509
(c) BM3D / 22.85dB / 0.5772
(d) RED-Net / 24.26dB / 0.6634
(f) WIN5 / 24.83dB / 0.7128
(g) WIN5-R / 25.77dB / 0.7664
(h) WIN5-RB / 29.01dB / 0.8735
Figure 5: Visual results of one image from BSD200-test with σ = 70 along with PSNR(dB) / SSIM. both DnCNN [26] and RED-Net [16] are deep CNN-based methods. The implementation code is either downloaded from the authors’ websites or implemented by our own with comparable or better performance than the official results.
PSNR (dB)
Quantitative Evaluation. We evaluate our models through single noise level-S (known noise level) and blind denoising-B (unknown noise level). The average of PSNR/SSIM results of different methods on the BSD200-test dataset and Set12 are shown in Table 2 and Table 3. As one can see, nearly all of our proposed models achieve the best results. Compared to the best performance of existing methods (RED-NET [16] or DnCNN [26]), on BSD200-test and Set12, the plain network WIN5 outperforms both methods at noise levels of 50 and 70 and has comparable performance at noise level of 30; WIN5-R is able to obtain remarkable PSNR gain of 1.81 / 2.39 / 1.5 dB on BSD200-test and 2.7 / 3.47 / 2.14 dB on Set12, at noise levels of 30 / 50 / 70 respectively; WIN5-RB-S can yield exceptional results with respectively 4.49 / 4.8 / 3.68 dB on BSD200-test and 6.31 / 5.94 / 5.8 dB gain on Set12 at the three noise levels. Note that this is the fist time that CNN-based denoising model can outperform other existing methods by more than 2 dB, or even 6 dB. It benefits from wider inference architecture capturing pixel distribution through wide reception fields. The computational cost of our proposed WIN models are comparable to DnCNN while four times faster than RED-Net. 36 Qualitative Evaluation. Fig. 5 illustrates the visual results of differWIN5−RB−B DnCNN ent methods. BM3D [3] (non-CNN based method) tends to produce 34 BM3D over-smoothed edges and textures; DnCNN [26] and RED-NET’s 32 [16] outputs are better than BM3D [3]; our proposed model, espe30 cially, WIN5-RB, with residual learning which helps to preserve 28 original details by adding them back to the output by a skip connec26 tion, can yield more natural and accurate details in the texture as 10 20 30 40 50 60 70 well as visually pleasant results. σ nosie 4.3
Figure 6: Behavior at different
Blind denoising and Robustness
BSD200-test images now are corrupted with AWGN with different values of σ = [0 − 70]. WIN5-RB-B is trained on larger number of patches as data augmentation is adapted. This is the reason why 7
noise levels of average PSNR on BSD200-test. WIN5-RB-B (blind denoising) is trained for σ = [0 − 70].
WIN5-RB-B (trained on σ = [0 − 70]) can outperform WIN5-RB-S (trained on single σ = 30, 50, 70 separately) in some cases, which is shown in the last column of Table 2. The average PSNR results of denoising behavior on BSD200-test dataset are shown in Fig. 6. WIN5-RB-B performs more stable and generalizes better even on higher noise levels than BM3D [3] and DnCNN [26].
Conclusion and Discussion
In this work, we primarily argue that wider CNNs that consist of increased size of receptive fields and a number of neurons in convolution layers are able to learn pixel distribution features more effectively, which leads to remarkably Gaussian denoising results and even exceed the state-of-the-art methods available with large performance gains. Hence, an innovative pathway of designing image denoising models may start from a plain wide yet shallow architecture integrated with regularization and learning strategy techniques such as batch normalization and residual learning. More importantly, an innovative investigation of regularization is to utilize wider batch normalization for boosting neural networks’ memory capacity to preserve more pixel distribution priors (mean and variance), with the empirical evidence demonstrate the generalization of the Gaussian denoising models is further improved. There are a number of observations which are suggested by our results, as discussed below.
5 WIN5−RB
4.5
Loss Error
5
4
WIN10−RB
3.5
WIN20−RB RED−Net+BN
3 2.5 2 1.5 1 0.5 0
5
10
15
20
25 30 Epochs
35
40
45
50
Figure 7: Comparisons of loss
errors of WIN-RBs at various depths as well as against REDNet [16] with BN added [9] layers on the same validation set. First, deeper is better as depth provides more non-linear representational compatibly. Second, “Wider” BN Is deep CNN model necessary? It depends on the task’s complex- [9] is able to enhance the network ity, the training data available and the application scenarios (e.g., “memory” to preserve more prior response time requirements). Although the proposed wide inference estimation. Note: Lower is better.
network can achieve remarkable results on Gaussian denoising, we still should notice the generalization capability of CNN-based models can be improved by going deeper. In our experiments, we compare the performance of the WIN-RBs with different depths (Fig. 7). The results indicate the performance also can be further improved by increasing depths as long as degradation is reduced. Investigation of WIN5 Variants: Fig. 8 shows the comparison of Gaussian denoising performance among WIN5’s variants with different structures. As one can see, the network (blue line) with the label 2L(128 × 7 × 7) + 2L(64 × 7 × 7) + 1L(1 × 7 × 7) , which means each of the first 2 convolution layers consists of 128 filters with size of 7 × 7, and both 3rd and 4th layers consist of 64 filters with size of 7 × 7, and the last convolution layer has 1 filters with size of 7 × 7, has the closest performance to WIN5 with 4L(128 × 7 × 7) + 1L(1 × 7 × 7). To have the competitive performance with WIN5 while reducing model complexity, we may keep the size of filters in all layers to be 7 × 7 and decrease the number of filters after 2nd layer. The key to WIN5’s success is to embed larger size of filters in all convolution layers with at least 128 filters in the first two convolution layers. In CNNs, larger receptive fields may capture more pixel distribution statistics that shall be fed into convolutions for learning sparse features. Especially, a number of low-level features that are essential Epochs for denoising are primarily convolved in the first two layers, which Figure 8: Comparison of loss need more neurons focusing on receptive regions simultaneously to error of WIN5’s variants. Note: extract plentiful significant sparse features. Lower is better. 5
WIN5: 4L(128x7x7)+1L(1x7x7) 2L(128x7x7)+2L(128x5x5)+1L(1x5x5) 2L(128x5x5)+2L(128x7x7)+1L(1x7x7) 2L(128x7x7)+2L(64x7x7)+1L(1x7x7) 2L(64x7x7)+2L(128x7x7)+1L(1x7x7) 1L(64x9x9)+1L(128x7x7)+1L(192x5x5)+1L(256x3x3)+1L(1x3x3)
4.5
Loss Error
4
3.5 3
2.5 2
1.5 0
5
10 15 20 25 30 35 40 45 50 55 60 65 70 75 80
Prior and learning structure: Designing a learning structure that remembers more prior information during training can significantly boost the accuracy of estimation and inference. Prior has played a critical role in some early works. The well-known Gaussian scale mixture (GSM) [1] model employs a known multi-scale wavelet representation as a prior to represent images statistics. In addition, using Markov random fields (MRFs) [20] to define a prior over the image space is another approach to capturing statistical regularities of pixel intensities. In contrast, CNNs have a greater representational power to learn priors from the training set, which is not only associated with the regression statistical framework [10] but also able to benefit from network optimization techniques. Compared with other CNN-based models, in some sense, our 8
proposed model employs a regularization technique–BN [9], a learning strategy-Residual net [12], and degradation optimization skill-skip connections as an associative memory [8] to preserve more statistical priors. Hence, our proposed WIN model can achieve remarkable performance boost.
References [1] D. F. Andrews and C. L. Mallows. Scale mixtures of normal distributions. Journal of the Royal Statistical Society. Series B (Methodological), pages 99–102, 1974. [2] D. Ciregan, U. Meier, and J. Schmidhuber. Multi-column deep neural networks for image classification. In Computer Vision and Pattern Recognition (CVPR), 2012 IEEE Conference on, pages 3642–3649. IEEE, 2012. [3] K. Dabov, A. Foi, V. Katkovnik, and K. Egiazarian. BM3D image denoising with shape-adaptive principal component analysis. In SPARS’09-Signal Processing with Adaptive Sparse Structured Representations, 2009. [4] C. Dong, Y. Deng, C. Change Loy, and X. Tang. Compression artifacts reduction by a deep convolutional network. In Proceedings of the IEEE International Conference on Computer Vision, pages 576–584, 2015. [5] M. Elad and M. Aharon. Image denoising via sparse and redundant representations over learned dictionaries. IEEE Transactions on Image processing, 15(12):3736–3745, 2006. [6] C. Farabet, C. Couprie, L. Najman, and Y. LeCun. Learning hierarchical features for scene labeling. IEEE transactions on pattern analysis and machine intelligence, 35(8):1915–1929, 2013. [7] K. He, X. Zhang, S. Ren, and J. Sun. Deep residual learning for image recognition. In Proceedings of the IEEE Conference on Computer Vision and Pattern Recognition, pages 770–778, 2016. [8] J. J. Hopfield. Neural networks and physical systems with emergent collective computational abilities. Proceedings of the national academy of sciences, 79(8):2554–2558, 1982. [9] S. Ioffe and C. Szegedy. Batch normalization: Accelerating deep network training by reducing internal covariate shift. arXiv preprint arXiv:1502.03167, 2015. [10] V. Jain and S. Seung. Natural image denoising with convolutional networks. In Advances in Neural Information Processing Systems, pages 769–776, 2009. [11] N. Joshi, C. L. Zitnick, R. Szeliski, and D. J. Kriegman. Image deblurring and denoising using color priors. In Computer Vision and Pattern Recognition, 2009. CVPR 2009. IEEE Conference on, pages 1550–1557. IEEE, 2009. [12] D. Kiku, Y. Monno, M. Tanaka, and M. Okutomi. Residual interpolation for color image demosaicking. In 2013 IEEE International Conference on Image Processing, pages 2304–2308. IEEE, 2013. [13] J. Kim, J. K. Lee, and K. M. Lee. Accurate image super-resolution using very deep convolutional networks. In The IEEE Conference on Computer Vision and Pattern Recognition (CVPR Oral), June 2016. [14] A. Krizhevsky, I. Sutskever, and G. E. Hinton. Imagenet classification with deep convolutional neural networks. In Advances in neural information processing systems, pages 1097–1105, 2012. [15] S. Z. Li. Markov random field modeling in image analysis. Springer Science & Business Media, 2009. [16] X.-J. Mao, C. Shen, and Y.-B. Yang. Image restoration using convolutional auto-encoders with symmetric skip connections. arXiv preprint arXiv:1606.08921, 2016. [17] D. Martin, C. Fowlkes, D. Tal, and J. Malik. A database of human segmented natural images and its application to evaluating segmentation algorithms and measuring ecological statistics. In Computer Vision, 2001. ICCV 2001. Proceedings. Eighth IEEE International Conference on, volume 2, pages 416–423. IEEE, 2001. [18] D. Martin, C. Fowlkes, D. Tal, and J. Malik. A database of human segmented natural images and its application to evaluating segmentation algorithms and measuring ecological statistics. In Proc. 8th Int’l Conf. Computer Vision, volume 2, pages 416–423, July 2001. [19] V. Nair and G. E. Hinton. Rectified linear units improve restricted boltzmann machines. In Proceedings of the 27th international conference on machine learning (ICML-10), pages 807–814, 2010. [20] Y. A. Rozanov. Markov random fields. In Markov Random Fields, pages 55–102. Springer, 1982. [21] K. Simonyan and A. Zisserman. Very deep convolutional networks for large-scale image recognition. arXiv preprint arXiv:1409.1556, 2014. [22] J. T. Springenberg, A. Dosovitskiy, T. Brox, and M. Riedmiller. Striving for simplicity: The all convolutional net. arXiv preprint arXiv:1412.6806, 2014. [23] C. Szegedy, W. Liu, Y. Jia, P. Sermanet, S. Reed, D. Anguelov, D. Erhan, V. Vanhoucke, and A. Rabinovich. Going deeper with convolutions. In Proceedings of the IEEE Conference on Computer Vision and Pattern Recognition, pages 1–9, 2015. [24] J. Xu, L. Zhang, W. Zuo, D. Zhang, and X. Feng. Patch group based nonlocal self-similarity prior learning for image denoising. In Proceedings of the IEEE International Conference on Computer Vision, pages 244–252, 2015. [25] M. D. Zeiler and R. Fergus. Visualizing and understanding convolutional networks. In European Conference on Computer Vision, pages 818–833. Springer, 2014. [26] K. Zhang, W. Zuo, Y. Chen, D. Meng, and L. Zhang. Beyond a gaussian denoiser: Residual learning of deep cnn for image denoising. arXiv preprint arXiv:1608.03981, 2016.
9
6
More Visual Results
More visual results are essential evidence to show the effectiveness and the advantages of our methods. We have various images from two different datasets, BSD200-test and Set12, with noise levels σ = 30, 50, 70 applied separately. 6.1
One image from BSD200-test with noise level=70
(a) Ground-truth
(d) RED-Net / 29.93dB / 0.8534
(g) WIN5-R/ 32.17dB / 0.8912
(b) Noise=70 / 12.35dB / 0.1509
(e) DnCNN / 28.38dB / 0.8287
(h) WIN5-RB / 33.82dB / 0.8459
(c) BM3D / 27.91dB / 0.8172
(f) WIN5 / 31.09 dB / 0.8865
(i) WIN5-RB-B / 34.55dB / 0.9067
Figure 9: Visual results of one image from BSD200-test with noise level σ = 70 along with PSNR(dB) / SSIM. As we can see, our proposed methods can yield more natural and accurate details in the texture as well as visually pleasant results.
10
6.2
One image from BSD200-test with noise level=50
(a) Ground-truth
(e) DnCNN / 23.70dB / 0.5872
(b) Noise=50 / 14.78dB / 0.2652
(f) WIN5 / 23.88dB / 0.5858
(c) BM3D / 23.10dB / 0.5163
(g) WIN5-R / 24.70dB / 0.6640
(d) RED-Net / 23.48dB / 0.5610
(h) WIN5-RB / 26.95dB / 0.8254
Figure 10: Visual results of one image from BSD200-test with noise level σ = 50 along with PSNR(dB) / SSIM. As we can see, our proposed methods can yield more natural and accurate details in the texture as well as visually pleasant results.
11
6.3
One image from BSD200-test with noise level=30
(a) Ground-truth
(e) DnCNN / 30.70dB / 0.8661
(c) BM3D / 30.11dB / 0.8481
(d) RED-Net / 30.43dB / 0.8597
(g) WIN5-R / 31.66dB / 0.8780
(h) WIN5-RB / 33.65dB / 0.9010
(b) Noise=30 / 18.78dB / 0.2496
(f) WIN5 / 30.34dB / 0.8556
Figure 11: Visual results of one image from BSD200-test with noise level σ = 30 along with PSNR(dB) / SSIM. As we can see, our proposed methods can yield more natural and accurate details in the texture as well as visually pleasant results.
12
6.4
One image from Set12 with noise level=50
(a) Ground-truth
(b) Noise=50 / 14.59dB / 0.1797
(c) BM3D / 26.23dB / 0.7164
(d) RED-Net / 26.77dB / 0.7379
(e) DnCNN / 26.83 / 0.7393
(f) WIN5 / 27.99dB / 0.7796
(g) WIN5-R / 30.00dB / 0.8573
(h) WIN5-RB / 33.06dB / 0.9089
(i) WIN5-RB-B / 32.96dB / 0.9285
Figure 12: Visual results of one image from Set12 with noise level σ = 50 along with PSNR(dB) / SSIM. As we can see, our proposed methods can yield more natural and accurate details in the texture as well as visually pleasant results.
13
6.5
One image from Set12 with noise level=30
(a) Ground-truth
(b) Noise=30 / 18.71dB / 0.3263
(c) BM3D / 28.74dB / 0.8095
(d) RED-Net / 28.99dB / 0.8180
(e) DnCNN / 29.13dB / 0.8219
(f) WIN5 / 28.92dB / 0.8143
(g) WIN5-R/ 31.50dB / 0.8919
(h) WIN5-RB / 35.65dB / 0.9518
(i) WIN5-RB-B / 34.78dB / 0.9512
Figure 13: Visual results of one image from Set12 with noise level σ = 30 along with PSNR(dB) / SSIM. As we can see, our proposed methods can yield more natural and accurate details in the texture as well as visually pleasant results.
14