Dec 16, 2002 - explore wavelet denoising of images using several thresholding techniques such as SUREShrink, VisuShrink and BayesShrink. Further, we ...
Image Denoising Using Wavelets — Wavelets & Time Frequency —
Raghuram Rangarajan Ramji Venkataramanan Siddharth Shah December 16, 2002
Abstract Wavelet transforms enable us to represent signals with a high degree of sparsity. This is the principle behind a non-linear wavelet based signal estimation technique known as wavelet denoising. In this report we explore wavelet denoising of images using several thresholding techniques such as SUREShrink, VisuShrink and BayesShrink. Further, we use a Gaussian based model to perform combined denoising and compression for natural images and compare the performance of these methods.
Contents 1 Background and Motivation 1.1 Introduction . . . . . . . . . . . . . . . . . . . . . . . . . . . . . . . . . . . . . . . . . . . . . . 1.2 The concept of denoising . . . . . . . . . . . . . . . . . . . . . . . . . . . . . . . . . . . . . .
3 3 3
2 Thresholding 2.1 Motivation for Wavelet thresholding 2.2 Hard and soft thresholding . . . . . 2.3 Threshold determination . . . . . . . 2.4 Comparison with Universal threshold
. . . .
. . . .
. . . .
. . . .
. . . .
. . . .
. . . .
. . . .
. . . .
. . . .
. . . .
. . . .
. . . .
. . . .
. . . .
. . . .
. . . .
. . . .
. . . .
. . . .
. . . .
4 4 4 4 5
3 Image Denoising using Thresholding 3.1 Introduction: Revisiting the underlying principle . . . . . 3.2 VisuShrink . . . . . . . . . . . . . . . . . . . . . . . . . . 3.3 SureShrink . . . . . . . . . . . . . . . . . . . . . . . . . . 3.3.1 What is SURE ? . . . . . . . . . . . . . . . . . . . 3.3.2 Threshold Selection in Sparse Cases . . . . . . . . 3.3.3 SURE applied to image denoising . . . . . . . . . . 3.4 BayesShrink . . . . . . . . . . . . . . . . . . . . . . . . . . 3.4.1 Parameter Estimation to determine the Threshold
. . . . . . . .
. . . . . . . .
. . . . . . . .
. . . . . . . .
. . . . . . . .
. . . . . . . .
. . . . . . . .
. . . . . . . .
. . . . . . . .
. . . . . . . .
. . . . . . . .
. . . . . . . .
. . . . . . . .
. . . . . . . .
. . . . . . . .
. . . . . . . .
. . . . . . . .
. . . . . . . .
. . . . . . . .
. . . . . . . .
5 5 6 7 7 8 8 8 9
4 Denoising and Compression using Gaussian-based MMSE Estimation 4.1 Introduction . . . . . . . . . . . . . . . . . . . . . . . . . . . . . . . . . . . 4.2 Denoising using MMSE estimation . . . . . . . . . . . . . . . . . . . . . . 4.3 Compression . . . . . . . . . . . . . . . . . . . . . . . . . . . . . . . . . . 4.4 Results . . . . . . . . . . . . . . . . . . . . . . . . . . . . . . . . . . . . . .
. . . .
. . . .
. . . .
. . . .
. . . .
. . . .
. . . .
. . . .
. . . .
. . . .
. . . .
9 9 10 11 11
5 Conclusions
. . . .
. . . .
. . . .
. . . .
. . . .
. . . .
. . . .
. . . .
. . . .
. . . .
. . . .
12
3
“If you painted a picture with a sky, clouds, trees, and flowers, you would use a different size brush depending on the size of the features.Wavelets are like those brushes.”
be confused with smoothing; smoothing only removes the high frequencies and retains the lower ones. Wavelet shrinkage is a non-linear process and is what distinguishes it from entire linear denoising technique such as least squares. As will be explained later, wavelet shrinkage depends heavily on the choice -Ingrid Daubechies of a thresholding parameter and the choice of this threshold determines, to a great extent the efficacy of denoising. Researchers have developed various tech1 Background and Motivation niques for choosing denoising parameters and so far there is no “best” universal threshold determination technique. 1.1 Introduction The aim of this project was to study various From a historical point of view, wavelet analysis is thresholding techniques such as SUREShrink [1], Visa new method, though its mathematical underpinuShrink [3] and BayeShrink [5] and determine the best nings date back to the work of Joseph Fourier in the one for image denoising. In the course of the project, nineteenth century. Fourier laid the foundations with we also aimed to use wavelet denoising as a means of his theories of frequency analysis, which proved to be compression and were successfully able to implement enormously important and influential. The attention a compression technique based on a unified denoising of researchers gradually turned from frequency-based and compression principle. analysis to scale-based analysis when it started to become clear that an approach measuring average fluctuations at different scales might prove less sensitive The concept of denoising to noise. The first recorded mention of what we now 1.2 call a ”wavelet” seems to be in 1909, in a thesis by A more precise explanation of the wavelet denoising Alfred Haar. procedure can be given as follows. Assume that the In the late nineteen-eighties, when Daubechies and observed data is Mallat first explored and popularized the ideas of wavelet transforms, skeptics described this new field X(t) = S(t) + N (t) as contributing additional useful tools to a growing toolbox of transforms. One particular wavelet techsignal with additive nique, wavelet denoising, has been hailed as “offering where S(t) is the uncorrupted −1 noise N(t). Let W (·) and W (·) denote the forward all that we may desire of a technique from optimaland inverse wavelet transform operators.. Let D(·, λ) ity to generality” [6]. The inquiring skeptic, howdenote the denoising operator with threshold λ. We ever maybe reluctant to accept these claims based on ˆ as an estimate intend to denoise X(t) to recover S(t) asymptotic theory without looking at real-world evidence. Fortunately, there is an increasing amount of S(t). The procedure can be summarized in three of literature now addressing these concerns that help steps us appraise of the utility of wavelet shrinkage more realistically. Y = W (X) Wavelet denoising attempts to remove the noise Z = D(Y, λ) present in the signal while preserving the signal charˆ S = W −1 (Z) acteristics, regardless of its frequency content. It involves three steps: a linear forward wavelet transform, nonlinear thresholding step and a linear in- D(·, λ) being the thresholding operator and λ being verse wavelet transform.Wavelet denoising must not the threshold.
4
Noisy Signal in Time Domain (Original signal is Superimposed)
6
10
8
25
8
4
20
6
6
4
15
2
4
2 10
0
0 2
−2
5
−2 0
−4 0
−6
−4 −2
−4
−5
0
500
1000
1500
2000
2500
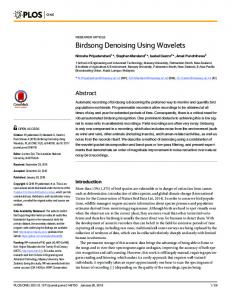
Figure 1: A noisy signal in time domain.
−10
−8
−10 −10 0
500
1000
1500
2000
−8
Thresholding
2.1
−4
−2
0
2
4
6
8
10
Figure 2: The same sig- Figure 3: Hard Threshnal in wavelet domain. olding. Note the sparsity of coefficients.
2.2
2
−6
−6 −10
−8
−6
−4
−2
0
2
4
6
8
10
2500
Motivation for Wavelet thresholding
The plot of wavelet coefficients in Fig 2 suggests that small coefficients are dominated by noise, while coefficients with a large absolute value carry more signal information than noise. Replacing noisy coefficients ( small coefficients below a certain threshold value) by zero and an inverse wavelet transform may lead to a reconstruction that has lesser noise. Stated more precisely, we are motivated to this thresholding idea based on the following assumptions:
Figure 4: Soft Thresholding.
Hard and soft thresholding
Hard and soft thresholding with threshold λ are defined as follows The hard thresholding operator is defined as D(U, λ) = U for all|U | > λ = 0 otherwise The soft thresholding operator on the other hand is defined as D(U, λ) = sgn(U )max(0, |U | − λ)
Hard threshold is a “keep or kill” procedure and is more intuitively appealing. The transfer function of the same is shown in Fig 3. The alternative, soft thresholding (whose transfer function is shown in Fig 4 ), shrinks coefficients above the threshold in abso• The decorrelating property of a wavelet translute value. While at first sight hard thresholding may form creates a sparse signal: most untouched seem to be natural, the continuity of soft thresholdcoefficients are zero or close to zero. ing has some advantages. It makes algorithms mathematically more tractable [3]. Moreover, hard thresh• Noise is spread out equally along all coefficients. olding does not even work with some algorithms such as the GCV procedure [4]. Sometimes, pure noise co• The noise level is not too high so that we can efficients may pass the hard threshold and appear distinguish the signal wavelet coefficients from as annoying ’blips’ in the output. Soft thesholding the noisy ones. shrinks these false structures.
As it turns out, this method is indeed effective and thresholding is a simple and efficient method for noise reduction. Further, inserting zeros creates more sparsity in the wavelet domain and here we see a link between wavelet denoising and compression which has been described in sources such as [5].
2.3
Threshold determination
As one may observe, threshold determination is an important question when denoising. A small threshold may yield a result close to the input, but the result may still be noisy. A large threshold on the
5
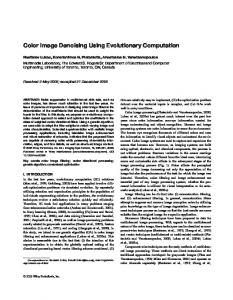
other hand, produces a signal with a large number of zero coefficients. This leads to a smooth signal. Paying too much attention to smoothness, however, destroys details and in image processing may cause blur and artifacts. To investigate the effect of threshold selection, we performed wavelet denoising using hard and soft thresholds on four signals popular in wavelet literature: Blocks, Bumps, Doppler and Heavisine[2]. The setup is as follows:
Haar Db2 Db4 Db8
• For each threshold, the MSE of the denoised signal is calculated. • Repeat the above steps for different orthogonal bases, namely, Haar, Daubechies 2,4 and 8. The results are tabulated in the table 1
2.4
Comparison threshold
with
As seen from the table, the best empirical thresholds for both hard and soft thresholding are much lower than this value, independent of the wavelet used. It therefore seems that the universal threshold is not useful to determine a threshold. However, it is useful for obtain a starting value when nothing is known of the signal condition. One can surmise that
Haar Db2 Db4 Db8
Bumps Hard 1.2 1.4 1.4 1.4
Soft 1.6 1.6 1.6 1.8
Haar Db2 Db4 Db8
Doppler Hard 1.6 1.6 1.6 1.6
Soft 2.2 1.6 2.0 2.2
Table 1: Best thresholds, empirically found with different denoising schemes, in terms of MSE
the universal threshold may give a better estimate for the soft threshold if the number of samples are larger (since the threshold is optimal in the asymptotic sense).
Universal 3
√ The threshold λU N IV = 2lnN σ (N being the signal length, σ 2 being the noise variance) is well known in wavelet literature as the Universal threshold. It is the optimal threshold in the asymptotic sense and minimises the cost function of the difference between the function and the soft thresholded version of the same in the L2 norm sense(i.e. it minimizes E k YT hresh − YOrig . k2 ). In our case, N=2048, σ = 1, therefore theoretically, p λU N IV = 2ln(2048)(1) = 3.905 (1)
Soft 1.6 1.6 1.6 1.8
Heavy Sine Hard Soft Haar 1.4 1.6 Db2 1.4 1.6 Db4 1.4 1.6 Db8 1.4 1.6
• The original signals have length 2048. • We step through the thresholds from 0 to 5 with steps of 0.2 and at each step denoise the four noisy signals by both hard and soft thresholding with that threshold.
Blocks Hard 1.2 1.2 1.2 1.2
3.1
Image Denoising Thresholding
using
Introduction: Revisiting the underlying principle
An image is often corrupted by noise in its acquisition or transmission. The underlying concept of denoising in images is similar to the 1D case. The goal is to remove the noise while retaining the important signal features as much as possible. The noisy image is represented as a twodimensional matrix {xij }, i, j = 1, · · · , N. The noisy version of the image is modelled as yij = xij + nij
i, j = 1, · · · , N.
where {nij } are iid as N(0,σ 2 ). We can use the same principles of thresholding and shrinkage to achieve denoising as in 1-D signals. The problem again boils down to finding an optimal threshold such that the
6
Blocks 1.1 soft hard 1
0.9
0.8
MSE
0.7
0.6
0.5
0.4
0.3
0.2
0.1
0
0.5
1
1.5
2
2.5 threshold
3
3.5
4
4.5
5
Bumps 1.1 soft hard 1
mean squared error between the signal and its estimate is minimized. The wavelet decomposition of an image is done as follows: In the first level of decomposition, the image is split into 4 subbands,namely the HH,HL,LH and LL subbands. The HH subband gives the diagonal details of the image;the HL subband gives the horizontal features while the LH subband represent the vertical structures. The LL subband is the low resolution residual consisiting of low frequency components and it is this subband which is further split at higher levels of decomposition. The different methods for denoising we investigate differ only in the selection of the threshold. The basic procedure remains the same :
0.9
• Calculate the DWT of the image.
0.8
MSE
0.7
• Threshold the wavelet coefficients.(Threshold may be universal or subband adaptive)
0.6
0.5
• Compute the IDWT to get the denoised estimate.
0.4
0.3
0.2
0.1
0
0.5
1
1.5
2
2.5 threshold
3
3.5
4
4.5
5
Heavisine 1.1 soft hard 1
0.9
0.8
MSE
0.7
0.6
0.5
0.4
Soft thresholding is used for all the algorithms due to the following reasons: Soft thresholding has been shown to achieve near minimax rate over a large number of Besov spaces[3]. Moreover, it is also found to yield visually more pleasing images. Hard thresholding is found to introduce artifacts in the recovered images. We now study three thresholding techniques- VisuShrink,SureShrink and BayesShrink and investigate their performance for denoising various standard images.
0.3
0.2
0.1
0
0.5
1
1.5
2
2.5 threshold
3
3.5
4
4.5
5
soft hard 1.2
1
MSE
0.8
0.6
0.4
0.2
0
0.5
1
1.5
2
2.5 threshold
3
3.5
4
4.5
VisuShrink
Visushrink is thresholding by applying the Universal threshold proposed by Donoho and Johnstone [2]. √ This threshold is given by σ 2logM where σ is the noise variance and M is the number of pixels in the image.It is proved in [2] that the maximum of any M values iid as N(0,σ 2 )will be smaller than the universal threshold with high probability, with the probability approaching 1 as M increases.Thus, with high
Doppler 1.4
0
3.2
5
Figure 5: MSE V/s Threshold values for the four test signals.
7
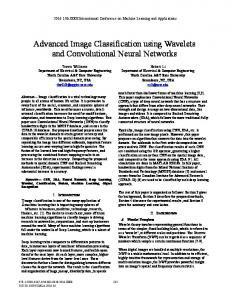
(a) 512 × 512 image of ‘Lena’
probabilty, a pure noise signal is estimated as being identically zero. However, for denoising images, Visushrink is found to yield an overly smoothed estimate as seen in Figure 6. This is because the universal threshold(UT) is derived under the constraint that with high probability the estimate should be at least as smooth as the signal. So the UT tends to be high for large values of M, killing many signal coefficients along with the noise. Thus, the threshold does not adapt well to discontinuities in the signal.
3.3 3.3.1
(b) Noisy version of ‘Lena’
SureShrink What is SURE ?
Let µ = (µi : i = 1, . . . d) be a length-d vector, and let x = {xi } (with xi distributed as N(µi ,1)) be multivariate normal observations with mean vector µ. Let µ b=µ b(x) be an fixed estimate of µ based on the observations x. SURE (Stein’s unbiased Risk Estimator) is a method for estimating the loss kb µ − µk2 in an unbiased fashion. In our case µ b is the soft threshold estimator (t) µ bi (x) = ηt (xi ). We apply Stein’s result[1] to get an unbiased estimate of the risk Ekb µ(t) (x) − µk2 :
SU RE(t; x) = d−2·#{i : |xi | < T }+
d X
min(|xi |, t)2 .
i=1
(2) For an observed vector x(in our problem, x is the set of noisy wavelet coefficients in a subband), we want to find the threshold tS that minimizes SURE(t;x),i.e (c) Denoised using Hard Thresholding
tS = argmint SU RE(t; x).
(3)
The above optimization problem is computationally straightforward. Without loss of generality, we can reorder x in order of increasing |xi |.Then on intervals of t that lie between two values of |xi |, SURE(t) is strictly increasing. Therefore the minimum value of tS is one of the data values |xi |. There are only d values and the threshold can be obtained using O(d log(d)) computations.
(d) Denoised using Soft Thresholding
Figure 6: Denoising using VisuShrink
8
3.3.2
Threshold Selection in Sparse Cases
The SURE principle has a drawback in situations of extreme sparsity of the wavelet coefficients. In such cases the noise contributed to the SURE profile by the many coordinates at which the signal is zero swamps the information contributed to the SURE profile by the few coordinates where the signal is nonzero. Consequently, SureShrink uses a Hybrid scheme. The idea behind this hybrid scheme is that the losses while using an universal threshold, tF = d √ 2 log d, tend to be larger than SURE for dense situations, but much smaller for sparse cases.So the S threshold is set to tF d in dense situations and to t in sparse situations. Thus the estimator in the hybrid method works as follows ½ µ bx (x)i =
s2d ≤ γd s2d > γd ,
ηtFd (xi ) ηtS (xi )
where P s2d =
2 i (xi
d
− 1)
3/2
γd =
log2 (d) √ d
η being the thresholding operator. 3.3.3
3.4
BayesShrink
In BayesShrink [5] we determine the threshold for each subband assuming a Generalized Gaussian Distribution(GGD) . The GGD is given by GGσX ,β (x) = C(σX , β)exp−[α(σX , β)|x|]β
(6)
−∞ < x < ∞, β > 0, where 1/2
−1 Γ(3/β) α(σX , β) = σX [ Γ(1/β) ]
and C(σX , β) =
β·α(σX ,β) 1 2Γ( β )
R∞ and Γ(t) = 0 e−u ut−1 du. (4) The parameter σX is the standard deviation and β is the shape parameter It has been observed[5] that with a shape parameter β ranging from 0.5 to 1, we can describe the the distribution of coefficients in a subband for a large set of natural images.Assuming (5) such a distribution for the wavelet coefficients, we empirically estimate β and σX for each subband and try to find the threshold T which minimizes the Bayesian Risk, i.e, the expected value of the mean square error.
SURE applied to image denoising
We first obtain the wavelet decomposition of the noisy image. The SURE threshold is determined for each subband using (2) and (3). We choose between this threshold and the universal threshold using (4).The expressions s2d and γd in (5), given for σ = 1 have to suitably modified according to the noise variance σ and the variance of the coefficients in the subband. The results obtained for the image ’Lena’ (512×512 pixels) using SureShrink are shown in Figure 7(c). The ‘Db4’ wavelet was used with 4 levels of decomposition. Clearly, the results are much better than VisuShrink. The sharp features of the image are retained and the MSE is considerably lower. This because SureShrink is subband adaptive- a separate threshold is computed for each detail subband.
b − X)2 = EX EY |X (X b − X)2 τ (T ) = E(X
(7)
b = ηT (Y ), Y |X ∼ N (x, σ 2 ) and X ∼ where X GGX ,β . The optimal threshold T ∗ is then given by T ∗ (σx , β) = arg min τ (T ) T
(8)
This is a function of the parameters σX and β. Since there is no closed form solution for T ∗ , numerical calculation is used to find its value. It is observed that the threshold value set by TB (σX ) =
σ2 σX
(9)
is very close to T ∗ . The estimated threshold TB = σ 2 /σX is not only nearly optimal but also has an intuitive appeal. The
9
normalized threshold, TB /σ. is inversely proportional to σ, the standard deviation of X, and proportional to σX , the noise standard deviation. When σ/σX ¿ 1, the signal is much stronger than the noise, Tb /σ is chosen to be small in order to preserve most of the signal and remove some of the noise; when σ/σX À 1, the noise dominates and the normalized threshold is chosen to be large to remove the noise which has overwhelmed the signal. Thus, this threshold choice adapts to both the signal and the noise characteristics as reflected in the parameters σ and σX . 3.4.1
Parameter Estimation to determine the Threshold
The GGD parameters, σX and β, need to be estimated to compute TB (σX ) . The noise variance σ 2 is estimated from the subband HH1 by the robust median estimator[5], σ b=
M edian(|Yij |) , 0.6745
Yij ∈ subbandHH1
(11)
where σY2 is the variance of Y. Since Y is modelled as zero-mean, σY2 can be found empirically by σ bY2 =
n 1 X 2 Y n i,j=1 ij
σ b2 TbB (b σX ) = . σ bX The results obtained by BayesShrink for the image ’Lena’ (512 × 512 pixels) is shown in figure 7(d).The ’Db4’ wavelet was used with four levels of decomposition. We found that BayesShrink performs better than SureShrink in terms of MSE. The reconstruction using BayesShrink is smoother and more visually appealing than the one obtained using SureShrink. This not only validates the approximation of the wavelet coefficients to the GGD but also justifies the approximation to the threshold to a value independent of β.
(10)
The parameter β does not explicitly enter into the expression of TB (σX ). Therefore it suffices to estimate directly the signal standard deviation σX . The observation model is Y = X + V , with X and V independent of each other, hence 2 σY2 = σX + σ2
To summarize,Bayes Shrink performs softthresholding, with the data-driven, subbanddependent threshold,
(12)
where n × n is the size of the subband under consideration. Thus σ b2 TbB (b σX ) = (13) σ bX where q σ bX = max(b σY2 − σ b2 , 0) (14) In the case that σ b2 ≥ σ bY2 , σ bX is taken to be b zero, i.e, TB (b σX ) is ∞, or, in practice,TbB (b σX ) = max(|Yij |), and all coefficients are set to zero.
4
4.1
Denoising and Compression using Gaussian-based MMSE Estimation Introduction
The philosophy of compression is that a signal typically has structural redundancies that can be exploited to yield a concise representation.White noise, however does not have correlation and is not easily compressible. Hence, a good compression method can provide a suitable method for distinguishing between signal and noise.So far,we have investigated wavelet thresholding techniques such as SureShrink and BayesShrink for denoising.We now use MMSE estimation based on a Gaussian prior and show that significant denoising can be achieved using this method. We then perform compression of the denoised coefficients based on their distribution and find that this can be done without introducing significant quantization error. Thus, we achieve simultaneous denoising and compression.
10
4.2
Denoising using MMSE estimation
As explained in the previous section,the Generalized Gaussian distribution (GGD) is a good model for the distribution of wavelet coefficients in each detail subband of the image. However, for most images,a Gaussian distribution is found to be a satisfatory approximation. Therefore, the model for the ith detail subband becomes Yji = Xji + Nji
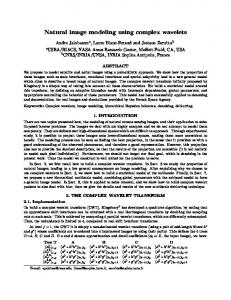
(a) 512 × 512 image of ‘Lena’
j = 1, 2, · · · , Mi .
(15)
where Mi is the number of wavelet coefficients in the ith detail subband.The coefficients {Xji } are inde2 pendent and identically distributed as N (0, σX i ) and i are independent of {Nj }, which are iid draws from N (0, σ 2 ). We want to get the best estimate of {Xji } based on the noisy observations {Yji }.This is done through the following steps: 1. The noise variance σ 2 is estimated as described in the previous section. 2. The variance σY2 i is calculated as
(b) Noisy version of ‘Lena’
σ ˆY2 i =
M 1 Xi i 2 Y n2 j=1 j
3. σ ˆX for the subband i is estimated as before as q ˆ 2 , 0). σ ˆX i = max(ˆ σY2 i − σ This comes about because 2 σ ˆY2 i = σ ˆX ˆ2 i + σ
and in the case that σ ˆ2 ≥ σ ˆY2 i , σ ˆX i is taken to be zero. This means that the noise is more dominant than the signal in the subband and so the signal cannot be estimated with the noisy observations.
(c) Denoised using SureShrink
4. Based on (15),the MMSE estimate of Xji based on observing Yji is σ ˆ2 i Xˆji = E[X/Y ] = X · Yji σ ˆY2 i
(d) Denoised using BayesShrink
Figure 7: Denoising SureShrink(σ = 30)
by
BayesShrink
and
(16)
11
We observe the similarity of this step to wavelet shrinkage, since each coefficient Yji is brought closer to zero in absolute value by multiplying with
2 σ ˆX i σ ˆ2 i
(< 1). This effect is similar to that of
Y
wavelet shrinkage in soft thresholding. Steps 2 through 4 are repeated for each detail subband i. Note that the coefficients in the low resolution LL subband are kept unaltered. The results obtained using this method for the ’Elaine’ image with a Db4 wavelet with 4 levels are shown in the first three parts of Figure 8.The MSE comparison plot in Figure 9 shows that denoising by Gaussian estimation performs slightly better than SureShrink for the ’Clock’ image. The slightly inferior performance to BayesShrink is to be expected since a GGD prior is a more exact representation of the wavelet coefficients in a subband than the Gaussian prior.
4.3
Compression
We now introduce a quantization scheme for a concise representation of the denoised coefficients ˆ i }. From (16), the {X ˆ i } are iid with distribu{X j j tion N (0,
4 σ ˆX i σ ˆ2 i
). The number of bits used to encode
Y
ˆ i is determined as follows. For simeach coefficient X j ˆ i as Aj , keeping in plicity of notation , we denote X j mind that Aj is a part of subband i 1. We first fix the maximum allowable distortion, say D, for each coefficient. 2. The variance of each coefficient Aj is found empirically by calculating the variance of a 3 × 3 block of coefficients centered at Aj . It is assumed that we have available a finite set of optimal Lloyd Max quantizers for the N (0, 1) distribution. In our experiments, we took 5 quantizers with number of quantization levels M = 2, 4, 8, 16 and 32.
3. Each coefficient Aj is encoded using the quantizer with the least M so that (Aj − Aˆj )2 ≤ D. Note that both D and the quantizer levels, defined for N (0, 1) have to scaled by σAj for each coefficient Aj . 4. Steps 2 and 3 are repeated for all the coefficients Aj in a subband and for all the detail subbands. 5. The coefficents in the low resolution subband are quantized assuming a uniform distribution [5]. This is motivated by the fact that the LL coefficients are essentially local averages of the image and are not characterized by a Gaussian distribution.
4.4
Results
Figure 8 shows the results obtained when this denoising and compression scheme is applied to the image ’Elaine’ with σ = 30.We used Db-4 discrete wavelet series with 4 levels of decomposition.We see the denoised version has much lower MSE (143.7 vs σ 2 = 900)and better visual quality too. The compressed version looks very similar to the denoised image with an additional MSE of around 20. It has been encoded using 1.52 bpp (distortion value D set at=0.1). The rate can be controlled by changing the distortion level D. If we fix a large distortion level D, we get a low encoding rate, but have a price to paylarger quantization error. We choose to operate at a particular point on the ’Rate v Distortion’ curve based on the distortion we are prepared to tolerate. The performance of the different denoising schemes is compared in Figure 9. A 200 × 200 image ’Clock’ is considered and the MSEs for different values of σ are compared. Clearly, VisuShrink is the least effective among the methods compared. This is due to the fact that it is based on a Universal threshold and not subband adaptive unlike the other schemes. Among these, BayesShrink clearly performs the best. This is expected since the GGD models the distribution of coefficients in a subband well. MMSE estimation based on a Gaussian distribution performs slightly worse than BayesShrink. We also see that a quantization error(approximately constant) is introduced due to compression. Among the subband
12
MSE comparsions of different thresholding methods for the image:Clock 400
20
BayesShrink SureShrink VisuShrink:Soft MMSE Estimation Quantization version
40
350 60
80
300
100
250
120
MSE
140
160
200
180
150 200 20
40
60
80
100
120
140
160
180
200
(a) 200 × 200 image of ‘Elaine’
100
50 20
0
40
5
10
15
20
25
30
sigma
60
80
Figure 9: Comparison of MSE of various denoising schemes
100
120
140
160
180
200 20
40
60
80
100
120
140
160
180
200
(b) Noisy version of ‘Elaine’ Denoised Elaine with estimation with wavelet db4 # levels=4
adaptive schemes, SureShrink has the highest MSE. But it should be noted that SureShrink has the desirable property of adapting to the discontinuities in the signal. This is more evident in 1-D signals such as ’Blocks’ than in images.
5
(c) Denoised version of ‘Elaine’ Quantized version of Denoised Elaine
(d) Quantized image of ‘Elaine’
Figure 8: MMSE Denoising and Quantization
Conclusions
We have seen that wavelet thresholding is an effective method of denoising noisy signals. We first tested hard and soft on noisy versions of the standard 1-D signals and found the best threshold.We then investigated many soft thresholding schemes viz.VisuShrink, SureShrink and BayesShrink for denoising images. We found that subband adaptive thresholding performs better than a universal thresholding. Among these, BayesShrink gave the best results. This validates the assumption that the GGD is a very good model for the wavelet coefficient distribution in a subband. By weakening the GGD assumption and taking the coefficients to be Gaussian distributed, we obtained a simple model that facilitated both denoising and compression. An important point to note is that although
13
SureShrink performed worse than BayesShrink and Gaussian based MMSE denoising, it adapts well to sharp discontinuities in the signal. This was not evident in the natural images we used for testing. It would be instructive to compare the performance of these algorithms on artificial images with discontinuities (such as medical images). It would also be interesting to try denoising (and compression) using other special cases of the GGD such as the Laplacian (GGD with β = 1).Most images can be described with a GGD with shape parameter β ranging from 0.5 to 1. So a Laplacian prior may give better results than a Gaussian prior (β = 2) although it may not be as easy to work with.
References [1] Iain M.Johnstone David L Donoho. Adapting to smoothness via wavelet shrinkage. Journal of the Statistical Association, 90(432):1200–1224, Dec 1995. [2] David L Donoho. Ideal spatial adaptation by wavelet shrinkage. Biometrika, 81(3):425–455, August 1994. [3] David L Donoho. De-noising by soft thresholding. IEEE Transactions on Information Theory, 41(3):613–627, May 1995. [4] Maarten Jansen. Noise Reduction by Wavelet Thresholding, volume 161. Springer Verlag, United States of America, 1 edition, 2001. [5] Martin Vetterli S Grace Chang, Bin Yu. Adaptive wavelet thresholding for image denoising and compression. IEEE Transactions on Image Processing, 9(9):1532–1546, Sep 2000. [6] Carl Taswell. The what, how and why of wavelet shrinkage denoising. Computing in Science and Engneering, pages 12–19, May/June 2000.