Bayesian Analysis (2011)
6, Number 3, pp. 429–456
Goodness-of-Fit of Conditional Regression Models for Multiple Imputation Stefano Cabras∗ , Mar´ıa Eugenia Castellanos† and Alicia Quir´os‡ Abstract. We propose the calibrated posterior predictive p-value (cppp) as an interpretable goodness-of-fit (GOF) measure for regression models in sequential regression multiple imputation (SRMI). The cppp is uniformly distributed under the assumed model, while the posterior predictive p-value (ppp) is not in general and in particular when the percentage of missing data, pm, increases. Uniformity of cppp allows the analyst to evaluate properly the evidence against the assumed model. We show the advantages of cppp over ppp in terms of power in detecting common departures from the assumed model and, more importantly, in terms of robustness with respect to pm. In the imputation phase, which provides a complete database for general statistical analyses, default and improper priors are usually needed, whereas the cppp requires a proper prior on regression parameters. We avoid this problem by introducing the use of a minimum training sample that turns the improper prior into a proper distribution. The dependency on the training sample is naturally accounted for by changing the training sample at each step of the SRMI. Our results come from theoretical considerations together with simulation studies and an application to a real data set of anthropometric measures. Keywords: Calibrated posterior predictive p-value, Discrepancy measure, Minimum training sample, Missing at random, Predictive distribution, Sequential regression multiple imputation
1
Introduction
Multiple imputation (MI) techniques, first introduced by Rubin (1978), have become popular in the last decades, and nowadays there are a variety of multiple imputation models and software available (e.g., the MICE package in R). MI consists of filling missing data values of a variable with multiple samples from an imputation model. In practice, MI is a simulation technique in which the missing values are replaced by S > 1 draws from the conditional predictive distribution of the imputed variable given the others in the data set. Imputation techniques include, among others, ordinary least-squares regression, logistic regression, factor analysis, variance components estimation, and proportional hazard models. Further details on MI can be found in Rubin (2004, 1996); Schafer (1999) and references therein. ∗ Dipartimento di Matematica e Informatica, Universit´ a Degli Studi di Cagliari, Italy, mailto:s.
[email protected] † Departamento de Estad´ ıstica e I.O., Universidad Rey Juan Carlos, Spain, mailto:maria.
[email protected] ‡ Departamento de Estad´ ıstica e I.O., Universidad Rey Juan Carlos, Spain, mailto:alicia.quiros@ urjc.es
© 2011 International Society for Bayesian Analysis
DOI:10.1214/11-BA617
430
GOF of Conditional Regression Models for MI
In this paper we assume that missing values are generated under the missing at random (MAR) mechanism, in which the probability of missingness depends only on available information. Based on this, we focus on linear regression models for imputation. In particular, we consider sequential regression multiple imputation (SRMI) that imputes each variable in turn, depending on the rest, using a regression model (Raghunathan et al. 2001). It is important to note that in SRMI, once a variable is completed, it is used as a regressor for the next variable to be imputed, in a Gibbs-like manner, until convergence of the regression coefficients is achieved. As SRMI operates at the level of the conditional distribution of a variable given the rest, then the joint distribution for all variables is not specified. Despite the popularity of MI methods, assessing their goodness-of-fit (GOF) is not a common practice and only a few papers address this problem. Gelman et al. (2005), Gelman (2004) and Abayomi et al. (2008) propose Bayesian posterior predictive checks for imputed data sets. Graphical diagnostics and exploratory data analysis are considered in Gelman et al. (2005) and Gelman (2004) whereas Abayomi et al. (2008) judge the propriety of the imputed values by comparison with the observed data, using Kolmogorov-Smirnov (KS) tests for each variable, together with bivariate scatterplots and residual plots. In He et al. (2007), the authors suggest the use of the posterior predictive p-value, ppp, originally proposed by Rubin (1984) and Meng (1994), further formalized and extended in Gelman et al. (1996), to assess the GOF of a certain imputation parametric model. Let Y be the variable to be imputed following the sampling model f (y|β) where β ∈ Θ is distributed according to prior π(β), then the ppp is defined as ppp(y) = Pr (D(Y rep , β) ≥ D(y, β)|y) .
(1)
Here D(y, β) is a discrepancy measure, y represents the observed Rdata and the distribution of Y rep is the posterior predictive distribution, m(Y |y) = Θ f (y|β)π(β|y)dβ. Without loss of generality, in (1) we assume that larger values of D indicate incompatibility. The ppp is usually approximated by a Monte Carlo sum where β and Y rep are drawn from the posterior distribution π(β|y) and f (Y |β), respectively. In this work, we focus on a GOF approach based on p-values, pointing out that ppp cannot be interpreted under the usual uniform distribution in (0,1), as also noted in Bayarri and Berger (2000); Dahl (2006); Hjort et al. (2006). We show here that ppp is conservative for GOF of SRMI, when GOF is based on suitable discrepancy measures. The work of Robins et al. (2000) demonstrated that ppp is asymptotically conservative when using GOF statistics whose distribution depends on unknown parameters. In order to overcome these drawbacks we propose to assess the GOF of SRMI with the calibrated posterior predictive p-value, cppp, proposed in Hjort et al. (2006). In that work, the authors propose post-processing the ppp obtaining the cppp, defined as cppp(y) = Pr (ppp(Y ) ≤ ppp(y)) ,
(2) R
where Y comes from the prior predictive distribution, m(Y ) = Θ f (y|β)π(β)dβ. In contrast to ppp, cppp is uniformly distributed under the null model, but it requires proper
S. Cabras, M. E. Castellanos and A. Quir´os
431
priors for β, being sensitive to the choice of π(β). Nonetheless, Bayesian imputation techniques usually make use of default and improper priors. This creates a problem for GOF based on cppp that we overcome by introducing the use of a minimal training sample. Following Definition 1 in Berger and Pericchi (1996) we make use of the idea of minimum training sample, that consists of a sample of the data, of minimal size, that trains an improper prior into a proper distribution through the Bayes’ theorem. Additionally, we compare this approach with that based on conjugate priors. Finally, as stated in Hjort et al. (2006), the performance of the GOF critically depends on the choice of D(y, β). We choose several types of discrepancy measures, D(y, β), intuitively related to regression models, but a more comprehensive study of such discrepancies is beyond the scope of this paper. Also note that this paper is focused on GOF rather than on model selection and we encourage the reader to look at O’Hagan (2003) for a discussion of the role of Bayesian model checking versus model selection. The rest of the paper is organized as follows: GOF for SRMI, using two different priors and several discrepancy measures, is explained in Section 2. Section 3 validates the performance of the proposed technique with a simulation study and Section 4 illustrates an application to a real data set. Further remarks and conclusions are contained in Section 5.
2
Goodness-of-fit for SRMI
Consider the incomplete dataset, (Y1 , . . . , YQ ), where variables are ordered by increasing number of missing values. SRMI imputes each variable, one at a time, given the rest in a sequence of S imputations. Let s = 1, . . . , S denote the step of the procedure, the imputation model for Yq , q = 1, . . . , Q, is the posterior predictive distribution, m(Yq |yq ), based on the regression model Yq |Y−q , β ∼ Nn (Y−q β, σ 2 I),
β = (β, σ 2 ) ∈ Rpq × R+ , q = 1, . . . , Q,
(3)
where Y−q denotes the rest of the variables or a subset of these, and the intercept, while Nn represents the n-dimensional normal distribution. For the sake of simplicity, regression parameters are denoted by β instead of βq . Notice that Y−q includes a total of pq ≤ Q variables that are either fully observed or have been completed in previous steps. In order to evaluate the GOF of the conditional regression models in SRMI, we propose the cppp as a measure of the adequacy of each regression model (3) used to impute variable Yq at each step s. In the sequel, we illustrate the details of the procedure. As stated in the previous section, cppp requires a proper prior distribution on β. In order to evaluate the robustness of cppp with respect to π(β), we consider two different choices: i) a trained prior, π t (β), that is based on the usual default prior trained with a minimum training sample (Berger and Pericchi 1996), drawn from the observed data; and ii) a vague conjugate prior, π c (β), in which the analyst specifies the order of vagueness.
432
2.1
GOF of Conditional Regression Models for MI
Trained prior and posterior distribution
Suppose we are imputing, at a certain step s, variable Y = Yq using model (3) where Y−q is here denoted by X. Here Y is a vector of length n and X is an n × p matrix with T T p = pq . We assume Y and X partitioned as Y = (yoT , YmT )T and X = (XoT , Xm ) , where subindices o and m indicate the no observed and nm = n − no missing values of Y . Note that X is either fully observed or previously completed in the sequential imputation scheme. Let
1 σ2 be the usual default prior for parameters β in the linear regression model. The trained prior is π t (β) ∝ f (yt |Xt , β)π N (β) π N (β) = π N (β, σ 2 ) ∝
where f (yt |Xt , β) is the density of model (3) and yt is a random sample of size nt drawn from the observed data yo , and Xt represents the corresponding rows of X. In the case of the linear regression model, with p covariates, the minimum training sample {yt , Xt } that turns π N (β) into a proper density has size nt = p + 1. The trained prior, π t (β), is given by β | yt , X t , σ 2 2
σ | yt , Xt
∼ Np (βbt , σ 2 Vβ−1 ) 2
∼ Inv− χ (nt −
p, σ bt2 )
(4) 2
= Inv− χ
(1, σ bt2 )
with βbt Vβ σ bt2
= (XtT Xt )−1 XtT yt = (XtT Xt ) ct )T (yt − Xt β ct ). = (yt − Xt β
Let yo\t = yo \ yt and Xo\t = Xo \ Xt be the observed data after removing {yt , Xt }, then the posterior distribution, π(β|yo , Xo ), is the result of the usual conjugate analysis with response yo\t and design matrix Xo\t and the trained prior distribution π t (β) (4). Notice that the trained posterior, π(β|yo , Xo ), equals the posterior distribution calculated over all observed data with default prior π N (β). An advantage of π t (β) is that it allows us to use a default improper prior π N (β) in the GOF. Nevertheless, the main criticism of trained priors is that π t (β) depends on the training sample. It is important to stress here that this dependency is naturally accounted for by changing {yt , Xt } in each imputation step of the SRMI.
2.2
Conjugate prior and posterior distribution
The conjugate prior, π c (β), for (3) is β | σ2 σ2
∼ ∼
Np (β0 , σ 2 V0−1 ) Inv− χ2 (n0 , σ02 )
(5)
S. Cabras, M. E. Castellanos and A. Quir´os
433
and the posterior distribution, π c (β|yo , Xo ), is the usual one for the conjugate analysis, where prior parameters in (5) must be specified reflecting the analyst’s uncertainty about β. Here Np denotes a p-dimensional normal distribution. Note that, different to the case of a non-informative prior, both the posterior π c (β|yo , Xo ) and the GOF, based on cppp, depend on the information contained in π c (β). In Section 3 the effect of the degree of vagueness of the prior in the performance of the cppp is analyzed and both priors, π c (β) and π t (β), are compared.
2.3
Discrepancy measures
In this section we specify the discrepancy measures used to compute (1) for each s. Although many discrepancy measures may be used to assess the GOF of an imputation model, we consider the following discrepancies which are intuitively related to regression and are based on residuals, ei = yi − xTi β, for i = 1, . . . , n: Pn 2 n X e e2i 2 R = 1 − Pn i=1 i 2 , SSR = , σ2 ¯) i=1 (yi − y i=1 M ax = max i
|ei | , σ
KS = KS discrepancy for normality of e1 , . . . , en ,
Pn where yi is the i-th element of Y , xi is the corresponding row of X and y¯ = i=1 yi /n. These discrepancies are random variables defined over Y , i.e. D((yo , Ym ), β). As R2 has a different interpretation with respect to the rest of measures, in the sense that values of R2 indicate poorer fit, we use the following definition of ppp: ¡ lower ¢ 2 rep Pr R (Y , β) ≤ R2 (y, β)|y . Note that all these quantities are discrepancy measures and not statistics, implying, for instance, that R2 may take negative values.
2.4
SRMI and approximation of cppp
Consider again (Y1 , . . . , YQ ) ordered by increasing number of missing values. In the first round of SRMI, s = 1, the first variable with missing values, Yr , is imputed using its posterior predictive distribution m(Yr |y−r ) based on model (3) where, in this case, the covariates Y−r = (1, Y1 , . . . , Yr−1 ) are the intercept and the fully observed variables, if any. Note that if r = 1, Y−1 consists only of the intercept term. The rest of the variables, Yr+1 , . . . , YQ , are imputed sequentially using as covariates the fully observed variables jointly with those previously imputed. For s > 1, the imputation process is carried out as in round 1, except that, in each regression, all other variables are included as predictors. Schematically, for round s > 1, and for each q such that r ≤ q ≤ Q, impute variable Yq by drawing missing values from m(Yq |y−q ) for model (3), where s−1 s s Y−q = Y−q = (1, Y1 , . . . , Yr−1 , Yrs . . . , Yq−1 , Yq+1 , . . . , YQs−1 )
to obtain the completed qth variable at step s, namely Yqs . For fixed s and q in the above SRMI procedure, let Y = Yq , X = Y−q and denote,
434
GOF of Conditional Regression Models for MI
with an abuse of notation, ppp = ppps,q and cppp = cppps,q . The following algorithm provides an approximation of ppp and cppp when using the trained prior. 1. Draw a minimum training sample, {yt , Xt }, where yt is a random sample of size nt = p + 1 uniformly drawn from the observed data yo (see Section 2.1), and Xt are the corresponding rows of X. 2. Calculate ppp(yo ) using the following Monte Carlo sum: ppp(yo ) =
J 1X I{D(Yjrep , βj ) ≥ D(yo , Ym,j , βj )}, J j=1
(6)
where βj is drawn from π(β|yo , Xo ) defined in Section 2.1, while imputed values, Ym,j , and replicated data, Yjrep , are simulated from model (3) given βj with covariates Xm and X, respectively. 3. Approximate cppp according to: cppp(yo ) =
K 1 X I{ppp(Yo,k ) ≤ ppp(yo )}, K
(7)
k=1
where Yo,k is drawn from model (3) with covariates Xo , and βk is simulated from π t (β). For each Yo,k , compute ppp(Yo,k ) using step 2. In the case of using a conjugate prior, in order to approximate ppp and cppp, remove step 1 and replace π t (β) and π(β|yo , Xo ) with π c (β) and π c (β|yo , Xo ), respectively. We propose to assess the GOF of SRMI, for a certain variable Yq , using the whole sequence cppp1,q , . . . , cpppS,q , as illustrated in the application. We suggest discarding the whole SRMI if there is at least one q such that the corresponding model is not compatible with the observed data. In fact, due to the nature of SRMI, the imputation of variable Yq affects the imputation of the rest of variables. It is worth remarking here that we are assessing the GOF of conditional regression models and it is theoretically possible that the imputation procedure may not converge to a stationary distribution, because the conditional densities may not be compatible with any joint distribution of all variables (Gelman and Speed 1993). This problem is beyond the scope of the paper and our GOF procedure is not able to detect any such kind of incompatibility even if all conditional models were compatible. However, as noted in Raghunathan et al. (2001), this rarely occurs in practical cases. Moreover, according to van Buuren (2007), the approach of Fully Conditional Specification, that includes SRMI, should be preferred to that of Joint Modeling when the joint distribution of the data cannot easily be specified.
3
Simulation study
In this section we present the results of a simulation study in which we investigate and compare the performance of ppp and cppp using π t (β) and some choices of π c (β).
S. Cabras, M. E. Castellanos and A. Quir´os
435
Firstly, we consider one variable with missing values, y, and one complete covariate, x, and, secondly, we explore the case where both y and x are incomplete. We generate n observations according to three models: Null model: yi |xi ∼ N (1 + xi , 1); Alternative 1: yi |xi ∼ N (1 + x2i , 1); Alternative 2: yi |xi ∼ N (1 + zi , 1), where z is another covariate such that z 6= x, for i = 1, . . . , n. Covariates x and z are generated independently from two standard normal distributions. In order to mimic a MAR mechanism, let pm denote the proportion of missing values, then we randomly delete [n · pm] elements of y and x, with probability of missingness proportional to Φ(x) and Φ(y), respectively, where Φ denotes the cumulative standard normal distribution. The above MAR mechanism corresponds, under Alternative 2, to an MCAR mechanism for y and x. Within these frameworks we consider assessing the GOF of the following imputation model: yi |xi ∼ N (β0 + β1 xi , σ 2 ),
for the case of missing observations only in y.
In the case of two incomplete variables, the two models derived from SRMI definition are: yi |xi xi |yi
∼ ∼
N (β0 + β1 xi , σ 2 ) N (β00 + β10 yi , σ 02 ).
This study has been performed with different sample sizes, n ∈ {100, 500}, and proportion of missing values, pm ∈ {0.1, 0.4, 0.6, 0.9}. For each scenario, we evaluate the null sampling distribution of ppp and cppp, using the four discrepancy measures defined above, and their behavior under alternatives 1 and 2, using 100 replications of data. In the case of missing observations only in y, we consider the improper prior π N (β) = π (β0 , β1 , σ 2 ) joint with the training procedure, where the training sample, yt , changes for each cppp. We compare this with three different conjugate priors π c (β) = π c (β0 , β1 , σ 2 ) with n0 = 2, 0.2 and 0.1, σ02 = 1, β0 = (0, 0) and V0−1 = 100I, in (5). Such parameters have been chosen in order to evaluate the effect of vagueness. In particular, note that the moments of π c (β) are not defined for n0 ≤ 2. When x and y are both incomplete, we only consider the trained prior. N
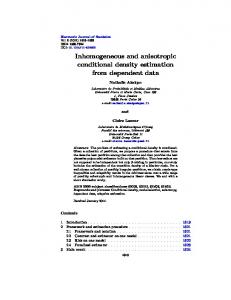
Figure 1 shows the sampling distributions of cppp and ppp under the null model, with n = 100 and pm = 0.1 and 0.6, considering the trained prior when only y is incomplete. As expected, the cppp is uniformly distributed under the null model, while this generally does not apply to ppp. In particular, for discrepancies R2 and SSR, ppp concentrates around 0.5 (plots in the left), while for KS and M ax it loses uniformity when pm increases (plots in the right). The same comments apply to all considered versions of π c (β), showing that under the null model, the automatic procedure, based
436
GOF of Conditional Regression Models for MI
on π N (β) provides similar results to that based on π c (β). By construction, sampling null distributions of the cppp are uniform, therefore they are so when both x and y are incomplete (not shown here). Therefore, it is more interesting to compare the power of ppp and cppp when rejecting the null model for a cut-off of 0.05 under alternatives 1 and 2. Power, under each alternative, is approximated by the proportion of the 100 p-values below 0.05. Figure 2 represents the approximated power for alternatives 1 and 2 using π N (β) and π c (β) with n0 = 0.2, for n = 100 and values of pm ranging between 0.1 and 0.9 and only missing values in y. For Alternative 1, KS and M ax are the most powerful discrepancies followed by R2 and SSR, with the corresponding cppp showing better performance than ppp. Under Alternative 2, the most powerful discrepancy is R2 and again, it is more powerful under cppp than under ppp. When using the vague conjugate prior, power of both measures increases slightly. For both alternatives, power generally increases with n, see Figure 3. As expected, the larger the pm, the smaller the power, specially in the case of ppp whose robustness with respect to pm is considerably lower than that of cppp, in particular for reasonable pm, i.e. pm < 0.9. Due to the missing mechanism, for pm = 0.9, data loses its quadratic structure in Alternative 1, leading to a sensible loss of power. Instead, when assuming the MCAR mechanism in Alternative 1, data keep the original quadratic structure also for pm = 0.9 and the power of cppp rises. Figures 4-5 report the power of cppp under the trained priors for the imputation models of y|x and x|y, respectively. For Alternative 1, in spite of the larger overall number of missing values, when both x and y are missing, powers for the imputation model of y|x are essentially in line with those in Figures 2-3. Regarding x|y, the lower power, compared to that of y|x, is due to the quadratic relationship we suppose between y|x. However, the power’s decrease for x|y is abundantly compensated with the power’s increase for y|x and thus the joint assessment of the GOF of the linear imputation model would strongly indicate its inadequacy. The increase of the power, at pm = 0.4 of KS and M ax for x|y, is due to the combination of the quadratic relationship y|x and the assumed MAR mechanism. In fact, after deleting observations, there remain some points, corresponding to large y, that act as outliers inducing linear model rejection. For large pm such outliers disappear resulting in model compatibility. However, also in such situations, using ppp, instead of cppp, we cannot detect model incompatibility. For Alternative 2, as the overall number of missing values increases, power decreases more than when only y is missing, specially for n = 500. The above results show that the power of cppp depends on the prior used and the global amount of missing values in the data. However, differences between priors seem to vanish for large sample sizes. The smaller power of the ppp using π N (β) is due to less weight of this prior with respect to data, when compared with π c (β). Using π c (β) instead of π N (β) we are measuring not only the discrepancy of the imputation model with data, but also between the assumed imputation model and the prior. The same reason can be ascribed to the behavior of cppp: when it is based on the trained prior its power decreases compared to the corresponding one based on the conjugate prior.
S. Cabras, M. E. Castellanos and A. Quir´os
0.4
0.8
0.0
0.4
0.8
1.0 0.8 0.6
Empirical Quant.
0.4 0.0
0.0
0.2
Empirical Quant.
0.6
0.8
1.0
KS (n=100, pm=0.1) (under the null model)
0.2
0.4
0.8 0.6
Empirical Quant.
0.0
0.2
0.4
0.8 0.6
0.0
0.4
0.8
0.0
0.4
0.8
R2 (n=100, pm=0.6) (under the null model)
SSR (n=100, pm=0.6) (under the null model)
Max (n=100, pm=0.6) (under the null model)
KS (n=100, pm=0.6) (under the null model)
0.8
0.0
0.4
0.8
Theoretical Quant.
0.8 0.6
Empirical Quant.
0.0
0.2
0.4
0.8 0.6
Empirical Quant.
0.2 0.0
0.2 0.0 0.4
Theoretical Quant.
0.4
0.8 Empirical Quant.
0.6
0.8 0.6 0.4 0.2 0.0 0.0
1.0
Theoretical Quant.
1.0
Theoretical Quant.
1.0
Theoretical Quant.
1.0
Theoretical Quant.
0.4
Empirical Quant.
0.4 0.2 0.0 0.0
Empirical Quant.
Max (n=100, pm=0.1) (under the null model)
1.0
SSR (n=100, pm=0.1) (under the null model)
1.0
R2 (n=100, pm=0.1) (under the null model)
437
0.0
0.4
0.8
Theoretical Quant.
0.0
0.4
0.8
Theoretical Quant.
Figure 1: For the case of an improper prior and a minimum training sample, this figure shows, through QQ-plots, sampling distributions of cppp (black) and ppp (red), under the null model, where missing values are only in y, with n = 100 and n = 500 and two proportions of missing values, namely 10% and 60%. Posterior predictive p-values are not uniformly distributed under the null hypothesis.
438
GOF of Conditional Regression Models for MI
0.9 0.8 0.7 0.6 0.4 0.3 0.2 0.1 0.0 0.1
0.4
0.6
0.9
0.1
0.4
0.6
0.9
Training Sample. Power for Alternative # 2 , n= 100
Vague prior. Power for Alternative # 2 , n= 100
0.9 0.8 0.7 0.6 0.5
R2 SSR
max KS
0.3 0.2 0.1 0.0
0.0
0.1
0.2
0.3
0.4
0.5
Power
0.7 0.6
0.8
0.9
1.0
Proportion of missings
1.0
Proportion of missings
0.4
Power
0.5
Power
0.5 0.0
0.1
0.2
0.3
0.4
Power
0.6
0.7
0.8
0.9
1.0
Vague prior. Power for Alternative # 1 , n= 100
1.0
Training Sample. Power for Alternative # 1 , n= 100
0.1
0.4
0.6
Proportion of missings
0.9
0.1
0.4
0.6
0.9
Proportion of missings
Figure 2: Powers of cppp (continuous lines) and ppp (dashed lines), under rejection of the null with p-value less than 0.05, and missing values only in y. Powers are calculated with n = 100 and proportion of missing varying from 10% up to 90%.
S. Cabras, M. E. Castellanos and A. Quir´os
439
0.9 0.8 0.7 0.6 0.4 0.3 0.2 0.1 0.0 0.1
0.4
0.6
0.9
0.1
0.4
0.6
0.9
Training Sample. Power for Alternative # 2 , n= 500
Vague prior. Power for Alternative # 2 , n= 500
R2 SSR
max KS
0.9 0.8 0.5 0.3 0.2 0.1 0.0
0.0
0.1
0.2
0.3
0.4
0.5
Power
0.6
0.7
0.9 0.6
0.7
0.8
1.0
Proportion of missings
1.0
Proportion of missings
0.4
Power
0.5
Power
0.5 0.0
0.1
0.2
0.3
0.4
Power
0.6
0.7
0.8
0.9
1.0
Vague prior. Power for Alternative # 1 , n= 500
1.0
Training Sample. Power for Alternative # 1 , n= 500
0.1
0.4
0.6
Proportion of missings
0.9
0.1
0.4
0.6
0.9
Proportion of missings
Figure 3: Powers of cppp (continuous lines) and ppp (dashed lines), under rejection of the null with p-value less than 0.05, and missing values only in y. Powers are calculated with n = 500 and proportions of missing varying from 10% up to 90%.
440
GOF of Conditional Regression Models for MI
0.9 0.8 0.7 0.6 0.4 0.3 0.2 0.1 0.0 0.1
0.4
0.6
0.9
0.1
0.4
0.6
0.9
max KS
0.5
0.6
0.7
0.8
R2 SSR
0.3 0.2 0.1 0.0
0.0
0.1
0.2
0.3
0.4
0.5
Power
0.6
0.7
0.8
1.0
Training Sample for y|x. Power for Alternative # 2 , n= 500
0.9
Training Sample for y|x. Power for Alternative # 2 , n= 100 1.0
Proportion of missings
0.9
Proportion of missings
0.4
Power
0.5
Power
0.5 0.0
0.1
0.2
0.3
0.4
Power
0.6
0.7
0.8
0.9
1.0
Training Sample for y|x. Power for Alternative # 1 , n= 500
1.0
Training Sample for y|x. Power for Alternative # 1 , n= 100
0.1
0.4
0.6
Proportion of missings
0.9
0.1
0.4
0.6
0.9
Proportion of missings
Figure 4: Powers of cppp (continuous lines) and ppp (dashed lines), for the imputation model of y|x when rejecting the null for p-value less than 0.05. Powers are calculated with n = 100, n = 500 and proportion of missing varying from 10% up to 90% on each variable.
S. Cabras, M. E. Castellanos and A. Quir´os
441
0.9 0.8 0.7 0.6 0.4 0.3 0.2 0.1 0.0 0.1
0.4
0.6
0.9
0.1
0.4
0.6
0.9
max KS
0.5
0.6
0.7
0.8
R2 SSR
0.3 0.2 0.1 0.0
0.0
0.1
0.2
0.3
0.4
0.5
Power
0.6
0.7
0.8
1.0
Training Sample for x|y. Power for Alternative # 2 , n= 500
0.9
Training Sample for x|y. Power for Alternative # 2 , n= 100 1.0
Proportion of missings
0.9
Proportion of missings
0.4
Power
0.5
Power
0.5 0.0
0.1
0.2
0.3
0.4
Power
0.6
0.7
0.8
0.9
1.0
Training Sample for x|y. Power for Alternative # 1 , n= 500
1.0
Training Sample for x|y. Power for Alternative # 1 , n= 100
0.1
0.4
0.6
Proportion of missings
0.9
0.1
0.4
0.6
0.9
Proportion of missings
Figure 5: Powers of cppp (continuous lines) and ppp (dashed lines), for the imputation model of x|y when rejecting the null for p-value less than 0.05. Powers are calculated with n = 100, n = 500 and proportion of missing varying from 10% up to 90% on each variable.
442
GOF of Conditional Regression Models for MI
Finally, for the considered different degrees of freedom, n0 , in π c (β), we obtain similar results (not shown here). It is interesting to analyze in more detail the behavior of some of these measures under both alternatives. As we have seen the calibration has no power when using D = SSR. This is explained, in Figures 6 and 7, by the fact that posterior distributions of D(Y rep , β)|y and D((y, Ym ), β)|y, used to calculate ppp in equation (6), do not change for y = yo and y = Yo,k coming from alternatives 1 or 2 and the prior predictive distribution, respectively. This is due to the fact that the sampling distribution of SSR do not change for the three considered scenarios and it makes this discrepancy useless for GOF even using cppp. For D = R2 we observe that posterior distributions of D(Y rep , β)|yo and D((yo , Ym ), β)|yo are located in the same region (around 0.7) for yo coming from Alternative 1, bottom-left plot of Figure 6, while D(Y rep , β)|Yo,k and D((yo , Ym ), β)|Yo,k are located in another region (around 0.95). In both cases the shape of the clouds is the same around the bisector, leading to the same ppp and rendering useless the calibration with cppp. This is why we cannot detect incompatibilities working with R2 under Alternative 1. Instead, under Alternative 2, D(Y rep , β)|yo is centered around 0 meanwhile D((yo , Ym ), β)|yo is located in smaller values, bottom-left plot in Figure 7. Also in this case, ppp (0.322) is not able to detect incompatibilities whereas, if we consider the calibration, we have that values ppp(Yo,k ) for k = 1, . . . , K are around 0.5 and these values are sufficiently different from the observed one (0.322) to detect incompatibility under Alternative 2. This simulation study is limited in the sense that it only considers two types of departures from the null model, which are the most common found in practice. Other types of departure from the null model may need other discrepancies to be detected, but a comprehensive study of such departures and discrepancies is beyond the scope of the paper. Instead, the focus of this work is to analyze the behavior of cppp, selecting several discrepancy measures but without an extensive study of these.
4
Application
For illustration purposes we present an application to the boys data set included in the MICE package. This data set consists of a random sample of 10% of observations from the cross-sectional data used to construct the Dutch growth references in 1997 (Fredriks et al. 2000). In this data set there are several variables related to n = 748 Dutch boys, from which we restrict to the following continuous ones: Age, Height, W eight and Head Circumference (HC). A matrix of dispersion plots for these variables along with their marginal distributions appears in Figure 8. We can see that, as growth rates differ from younger to older boys, there are highly non linear relations between these four variables across all ages. In contrast, these are very well approximated by linear relations for small age groups, such as that of boys under 1 year old. Based on this, we expect that the linear imputation model (3) is compatible with data if applied to a specific age group rather than to the whole data set. The percentage of missing
S. Cabras, M. E. Castellanos and A. Quir´os
443 SSR , ppp(Yo,k) = 0.56 160 140 120 80 60
80
100
120
140
160
60
80
100
120
140
D(Yo,k,Ym,θ |Yo,k)
R2 , ppp(yo) = 0.581
R2 , ppp(Yo,k) = 0.594
160
0.9 0.8 0.7 0.6 0.5
0.5
0.6
0.7
D(Yrep,θ |Yo,k)
0.8
0.9
1.0
D(yo,Ym,θ |yo)
1.0
60
D(Yrep,θ |yo)
100
D(Yrep,θ |Yo,k)
100 60
80
D(Yrep,θ |yo)
120
140
160
SSR , ppp(yo) = 0.528
0.5
0.6
0.7
0.8
D(yo,Ym,θ |yo)
0.9
0.5
0.6
0.7
0.8
0.9
1.0
D(Yo,k,Ym,θ |Yo,k)
Figure 6: For a random sample of size n = 100 and pm = 0.1, generated under Alternative 1, we show, 1000 generations of D(Y rep , β)|yo and D((yo , Ym ), β)|yo (left plots) used in (6) for SSR (top) and R2 (bottom). In each case ppp is obtained by the proportion of black points for each discrepancy. Right plots contain 1000 generations of D(Y rep , β)|Yo,k and D((Yo,k , Ym ), β)|Yo,k , Yo,k ∼ m(Y ) based on π t (β). These simulations are used to approximate ppp(Yo,k ) in (7).
444
GOF of Conditional Regression Models for MI SSR , ppp(Yo,k) = 0.56 160 140 120 80 60 80
100
120
140
160
60
80
100
120
140
D(Yo,k,Ym,θ |Yo,k)
R2 , ppp(yo) = 0.322
R2 , ppp(Yo,k) = 0.62
160
0.6 0.4 0.2 0.0 −0.2
−0.2
0.0
0.2
0.4
D(Yrep,θ |Yo,k)
0.6
0.8
D(yo,Ym,θ |yo)
0.8
60
D(Yrep,θ |yo)
100
D(Yrep,θ |Yo,k)
120 100 60
80
D(Yrep,θ |yo)
140
160
SSR , ppp(yo) = 0.489
−0.2
0.0
0.2
0.4
D(yo,Ym,θ |yo)
0.6
0.8
−0.2
0.0
0.2
0.4
0.6
0.8
D(Yo,k,Ym,θ |Yo,k)
Figure 7: For a random sample of size n = 100 and pm = 0.1, generated under Alternative 2, we show, 1000 generations of D(Y rep , β)|yo and D((yo , Ym ), β)|yo (left plots) used in (6) for D = SSR (top) and D = R2 (bottom). In each case ppp is obtained by the proportion of black points for each discrepancy. Right plots contain 1000 generations of D(Y rep , β)|Yo,k and D((Yo,k , Ym ), β)|Yo,k , Yo,k ∼ m(Y ) based on π t (β). These simulations are used to approximate ppp(Yo,k ) in (7).
S. Cabras, M. E. Castellanos and A. Quir´os
445
values for the considered variables are: 0.5% for W eight; 5% for Height; 6% for HC; and Age is fully observed. SRMI was iterated S = 100 times and we computed {cppps,q , q = 1, 2, 3, s = 1, . . . , 100} for assessing the GOF of each imputation model (3), where each variable was imputed given the rest, i.e. all the variables except the one being imputed are covariates in the imputation model. We considered the two classes of priors proposed here. For the conjugate prior, we used the same values of hyperparameters as in the simulation study but with V0−1 = 200I. As the results for both priors were similar and based on the previous simulation study, we only show the results for the trained prior π t (β), provided that n is large. The corresponding cppp, for all iterations and all three imputation models, are shown in Figure 9 for M ax and KS with individuals of all ages (first row). The values of cppp in Figure 9 suggest that the conditional regression models are incompatible with the observed data. There are problems with the normality of residuals for the three models, as shown by the cppp associated with the KS discrepancy. Also the M ax discrepancy reflects incompatibility between the observed values and the predicted maximum for models: W eight|rest and HC|rest. Based on this, and also on what has been noted above, we consider imputing only data for boys younger than 1 year. The corresponding cppp for this case are shown in the second row of Figure 9. We can see that, for this age group, all linear imputation models are compatible with the observed data. These results are in line with the above considerations on the growth rates. The same analysis was performed using ppp as shown in Figure 10. Results from Figures 9-12 are further summarized in Table 1, where the proportion of times in which cppp or ppp are lower than 0.05 and 0.1 are reported. These proportions approximate the power of the method when considering boys of all ages. For the case of younger boys, these quantities can be interpreted as the Type I error. Although the results for ppp are basically similar to those for cppp, it can be seen in Table 1 that power of ppp is 0.27 (for a cut-off of 0.05) for model HC|rest when using KS in all ages, while the corresponding cppp are clearly below 0.05 (power 0.77). In order to check whether the performance of the cppp is adequate with a higher percentage of missing values, and only for illustration purposes, we repeat the previous analysis by considering the same individuals, in which a total of 30% of the observations of each variable W eight, Height and HC have been uniformly deleted at random. This way of introducing missing values mimics the missing completely at random mechanism, a particular case of MAR. Results of the GOF for the three imputation models over all ages and younger boys are shown in Figure 11, while corresponding ppp are shown in Figure 12. Using the cppp we reach the same conclusions with respect to the analysis with all available data, although the cppp exhibits larger noise. Instead, the results obtained through the ppp for KS measure suggest that models HC|rest and Height|rest are compatible with data for all ages. These results provide evidence for the fact that the proposed method is robust with respect to the percentage of missing data. Both Figures 9 and 11 suggest stability of the cppp with respect to the sequential
446
GOF of Conditional Regression Models for MI
5
10
15
20
100
150
200
20 0
5
10
15
20 15 10 5 50
0
20
40
Height
Age
80 100
35
40
50
55
60
65
60
65
60
65
150
150
100
100
5
10
15
20
50
100
150
200
0
20
Height
40
60
80 100
15
20
80 40 20
100
150
200
0 0
20
40
80 100
35
40
45
50
55
Head Circ.(HC)
65
Head Circ.(HC)
0
5
10 Age
15
20
60
50 50
100 Height
150
200
0
35
20
40
40
45
50 45 40 35
35
40
45
50
80
55
60
65 55
60
65
60 Weight
Height
60
55
60
100 50 0 50
Age
55
50
100 120
10
45
Head Circ.(HC)
100
150
120 100 80 60 40 5
40
Weight
20 0
35
Weight
0
0
20
40
60
80
100
120
Age
120
0
50
50
0
50
20
100
40
60
150
80
100
45
Head Circ.(HC)
200
Height
200
60 Weight
200
0
0
0
0
5
50
10
100
15
150
20
200
Age
0
20
40
60 Weight
80 100
35 40 45 50 55 60 65 Head Circ.(HC)
Figure 8: Boys Data. Linear Regressions (black) and Lowess Regressions (red) show that relations among variables are not linear, meanwhile for boys younger than 1 year it seems to be linear.
S. Cabras, M. E. Castellanos and A. Quir´os
447
1.0
KS (all ages)
1.0
Max (all ages)
0.8 0.6 0.0
0.2
0.4
cppp 0.0
0.2
0.4
cppp
0.6
0.8
Height | Rest Weight | Rest HC | Rest
40
60
80
100
0
20
40
60
Iterations
Iterations
Max (age