Jan 13, 2010 - ments, such as the Square Kilometre Array and its Pathfinders, will produce. ... astrophysical visualization in preparation for the Petascale Era.
Astronomical Data Analysis Software and Systems XIX ASP Conference Series, Vol. XXX, 2009 Y. Mizumoto, K.-I. Morita, and M. Ohishi, eds.
P27
arXiv:1001.2049v1 [astro-ph.IM] 13 Jan 2010
GPU-Based Volume Rendering of Noisy Multi-Spectral Astronomical Data Amr H. Hassan, Christopher J. Fluke, and David G. Barnes Centre for Astrophysics & Supercomputing, Swinburne University of Technology, Hawthorn, Victoria, Australia Abstract. Traditional analysis techniques may not be sufficient for astronomers to make the best use of the data sets that current and future instruments, such as the Square Kilometre Array and its Pathfinders, will produce. By utilizing the incredible pattern-recognition ability of the human mind, scientific visualization provides an excellent opportunity for astronomers to gain valuable new insight and understanding of their data, particularly when used interactively in 3D. The goal of our work is to establish the feasibility of a real-time 3D monitoring system for data going into the Australian SKA Pathfinder archive. Based on CUDA, an increasingly popular development tool, our work utilizes the massively parallel architecture of modern graphics processing units (GPUs) to provide astronomers with an interactive 3D volume rendering for multi-spectral data sets. Unlike other approaches, we are targeting real time interactive visualization of datasets larger than GPU memory while giving special attention to data with low signal to noise ratio - two critical aspects for astronomy that are missing from most existing scientific visualization software packages. Our framework enables the astronomer to interact with the geometrical representation of the data, and to control the volume rendering process to generate a better representation of their datasets.
1.
Introduction
Next-generation astronomy research facilities will generate new challenges for data storage, access, analysis and system monitoring, bringing astronomy into the Petascale Data Era. But even today, astronomical knowledge is not growing at the same rate as the data. Scientific visualization is a fundamental, enabling technology for knowledge discovery. Despite recent progress, many current astronomy visualization approaches will be seriously challenged by, or are completely incompatible with, the Petascale Data Era. With an emphasis on developing new approaches compatible with data from the Square Kilometer Array and its Pathfinders, the goal of this work is to advance the field of astrophysical visualization in preparation for the Petascale Era.
2.
Challenges and Design Objectives
The main goal of this work is to enable astronomers to visualize large spectral data cubes (e.g. at least 1 TB in size) of the size that will be generated from the 1
2
Hassan, Fluke, and Barnes
Australian SKA Pathfinder (ASKAP)4 . Multispectral data can be considered as a 4D data volume where three dimensions are associated to position allocation (two dimensions for the spatial position in sky coordinates and one dimension for the wavelength or frequency - both of which are related to the line of sight velocity) and one dimension for the flux density. The data cube can be considered as a stack of images where each image presents a sky portion over a small frequency range (∆ν). To achieve this target we designed a framework that utilizes the latest available hardware technologies combined with the latest software infrastructure. The main design objectives and challenges for this framework were: 1. Being scalable enough to offer better visualization outcomes when more hardware is available; 2. Support heterogeneous computing systems; 3. Using off-the-shelf hardware solution, such as graphics processing units (GPUs); 4. Requires minimum user intervention to reduce the time needed by astronomers to run and install the system; 5. Being capable to handle tiled display systems to provide the user with high resolution output; and 6. Handle data sizes exceeding current single machine memory limits. To achieve these objectives, the following design decisions were taken: 1. Using ray-casting volume rendering as our visualization technique. Although being computationally intensive and relatively hard to implement, volume rendering is an important visualization tool in our case because it gives the user a global picture of the data cube; it does not need the user to know in advance what s/he is searching for; and provides visuals that are easy to understand. Also, using ray-casting will support our framwork to achieve a high resolution output without any visual artifacts (Schwarz 2007). 2. Build a framework based on a distributed GPU architecture. With a theoretical peak performance greater than 4 TFLOP/S (1012 floating point operations per second) on hardware such as NVIDIA’s Tesla, general purpose computing on graphics processing units offers a more effective and cheaper parallel architecture than existing multi-core processors. 3.
Distributed GPU Framework
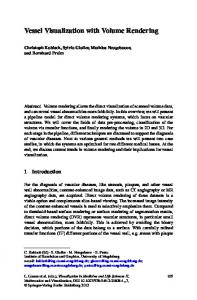
As shown in Figure 1, our distributed GPU framework combines the processing power of multiple GPU nodes to speed-up and enhance the spectral cube visualization process. This framework uses Message Passing Interface5 (MPI), multi-threading, and the Compute Unified Device Architecture6 (CUDA) framework from NVIDIA to allow many GPUs to work on the same problem.
4
http://www.atnf.csiro.au/projects/askap/
5
http://www.mcs.anl.gov/research/projects/mpi/
6
http://www.nvidia.com/object/cuda_what_is.html
GPU-Based Volume Rendering
Figure 1. Schematic diagram showing the framework’s main hardware components. Each node is connected to the other nodes through a standard network interface which is managed through a seperate thread. The communication threads serve as a software communication channels between kernels on different GPUs. The scheduler server maps the current available tasks to the available computing resources. The scheduler module assumes that the resources are heterogenous and assign the computational tasks to each of them according to their computing capabilities. The final rendering result is presented to the user through a thin-client which translates the user interaction into rendering commands to the scheduler server.
3
4 3.1.
Hassan, Fluke, and Barnes Framework Modules
The main components of our proposed framework are partitioned based on their main functionality into: 1. Scheduling module: responsible for managing and controlling the overall process; 2. GPU module: includes different execution kernels and utilizes the parallelization paradigm of the GPUs. We chose NVIDIA’s CUDA library because it has a C like syntax, it is easy to use, and covers all the general purpose GPU computing functionality we require; 3. Scene integration module: responsible for generating the final display output by combining the output of the contributing GPUs; and 4. I/O and User interaction modules: support the user’s interactivity and change the output according to user input. The process of generating a single volume rendering view of the spectral line cube goes through the following processes: 1. The spectral data cube is partitioned into a set of smaller sub-cubes; 2. The scheduler module assigns these sub-cubes to the processing nodes/GPUs; 3. Each GPU applies ray-tracing volume rendering to map each output pixel into a color plus alpha transparency channel (RGBA) based on a preselected transfer function; 4. The process of volume rendering produces N images with the same resolution as the output screen(s); 5. The scene integration module reapplies the same transfer function to these images to combine them into the final output; and 6. The final output is directed to the output display(s). 4.
Conclusion
The focus of this work is to improve multi-spectral data visualization to cope with the vast amount of data to be produced by ASKAP and similar facilities. By employing GPUs combined with distributed processing, we are aiming to implement a scalable system capable of interactively visualizing “greater than memory” astrophysical datasets. References Schwarz, N. 2007, Masters thesis - Distributed volume rendering of very large data on high-resolution scalable display - University of Illinois, Chicago.