Nov 9, 2012 - as tuberculosis or pneumoconiosis screening. Researchers at the National Library of Medicine in collaboration with. Indiana University School ...
1st Annual IEEE Healthcare Innovation Conference of the IEEE EMBS Houston, Texas USA, 7 - 9 November, 2012
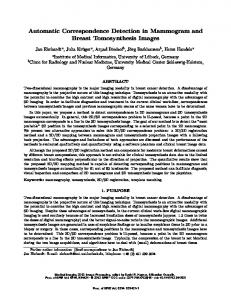
Graph Cut Based Automatic Lung Boundary Detection in Chest Radiographs Sema Candemir1 , Stefan Jaeger2 , Kannappan Palaniappan1 , Sameer Antani2 , and George Thoma2 Abstract— The National Library of Medicine (NLM) is developing a digital chest x-ray (CXR) screening system for deployment in resource constrained communities. An important first step in the analysis of digital CXRs is the automatic detection of the lung regions. In this paper, we present a graph cut based robust lung segmentation method that detects the lungs with high accuracy. The method consists of two stages: (i) average lung shape model calculation, and (ii) lung boundary detection based on graph cut. Preliminary results on public chest x-rays demonstrate the robustness of the method. Fig. 1. Anatomical features in a chest x-ray and its variability. Challenges: varying lung shape, strong edges of the rib cage, visible shape of the heart, intensity variation around the clavicle bones and sharp corner at costophrenic angle.
I. INTRODUCTION Detecting the lung regions in chest x-ray images is an important step of computer-aided diagnosis applications such as tuberculosis or pneumoconiosis screening. Researchers at the National Library of Medicine in collaboration with Indiana University School of Medicine and Moi University in Kenya, are developing a computer-aided system for tuberculosis screening using chest x-ray radiographs. One of the important first steps of the system is to detect the lung regions accurately in chest radiographs. In this paper, we present a graph cut based robust lung detection system designed for this project. Processing of x-ray chest images poses some challenges. For example, for lung segmentation, the strong edges at the rib cage and clavicle region cause local minima for most minimization approaches. Segmenting the lung apex is also a nontrivial problem because of the changing intensity at the clavicle bone. Additional challenges are segmenting the small costophrenic angle, making allowances for anatomical shape variations such as varying heart dimensions or other pathology, and the x-ray imaging inhomogeneities. Figure 1 shows some of these variations in lung appearance. Various methods have been applied to detect the lung boundary on x-ray chest images [1], [2], [3], [4], [5], [6]. Shi et al. [1] classified these methods into four categories: (i) rule-based ii) pixel-based iii) hybrid and 4) deformable model-based methods. In this paper, we are presenting a hybrid system to robustly detect lung boundaries.
graph cut segmentation algorithm [7], [8] to detect the lung regions with the help of the calculated shape model. Figure 2 illustrates the stages of the system.
Fig. 2. Proposed scheme to detect the lung boundary. The system consists of two stages: Stage-I) Lung shape model computation. Top left: original image, top right: calculated shape model by taking the average of training masks. Stage-II) Lung boundary detection with a graph-based algorithm. Bottom left: global binary segmentation, bottom right: calculated boundary contour.
A. System Overview The system has two main stages. It first computes an average shape model using training images. Then it uses a
To compute an approximate shape model, we use training images which are selected according to their shape similarity. The average of all selected masks is used as an approximate shape model for the observed patient lung image. The second stage of the system detects the lung region with a segmentation algorithm. We employ a graph cut algorithm which
1 S.
Candemir and K.Palaniappan are with the Department of Computer Science, University of Missouri-Columbia, MO, USA {candemirs, pal}@missouri.edu 2 S.Jaeger, S.Antani and G.Thoma are with Lister Hill National Center for Biomedical Communications U. S. National Library of Medicine, National Institutes of Health, Bethesda, MD, USA {stefan.jaeger,sameer.antani,george.thoma}@nih.gov
31
models the segmentation problem with an objective function in terms of boundary, region, and shape model properties. The algorithm computes a global binary segmentation by minimizing the objective function. We tested the system on a publicly available data set [9]. Preliminary results show that the proposed system detects the lung regions robustly on x-ray chest images. In Section II, we describe the proposed system in detail. Section III provides the description of the data set and experimental results. Conclusions and future work are given in Section IV.
B. Stage-II: Segmentation The second stage of the system is detecting the lung boundary of x-ray images using image properties and the lung shape model from the previous section. A number of different segmentation methods reported in the literature can be used, e.g. [10], [11]. We perform image segmentation using a graph cut method [7], [8], [12] and model the segmentation problem with an objective function. The maxflow min-cut algorithm [13] minimizes the objective function to find the global minimum which corresponds to foreground (fg) and background (bg) labeling of the pixels. This section gives the details of the segmentation component of the system. 1) Basic Terminology of Graph Cut: The graph cut algorithm models computer vision labeling problems such as segmentation and disparity estimation as energy minimization using an undirected weighted graph G = (V,E). The set of vertices V represents the pixel properties such as intensity; and a set of edges E connects these vertices. The edge weights typically represent the spatial proximity measure between vertices. The graph has two special vertices (terminals) representing fg and bg labels. There are two types of edges: (i) neighborhood edges denoted as {p, q}, where p, q ∈ V model the boundary properties of objects; and (ii) edges between terminals and pixels denoted as {p, S} and {p, T }, where S and T represent the fg and the bg terminals. The graph cut algorithm uses an objective function that consists of a data and a smoothness term. The data term forces the algorithm to produce a solution that is consistent with the data (e.g. image intensities). On the other hand, the smoothness term encourages the algorithm to favor a smooth solution (e.g. assigning similar labels to neighborhood pixels). The edge weights between the terminals and the pixels are integrated into the data energy term; the neighborhood edges are integrated into the smoothness energy term of the objective function. To minimize the objective function, we compute the min-cut which partitions the graph into two subgraphs such that each pixel is connected to either the S or the T terminal, and thus is either labeled as fg or bg. 2) Objective Function: To formulate the objective function, we define the desired segmentation criteria such that: (i) segmentation labels (e.g. fg/bg) should be consistent with the image intensities of the lung; (ii) the neighborhood labels should be consistent with each other; (iii) the resulted segmentation should fit the calculated shape model. Let f = {f1 , ..., fp , ..., fP } be a binary vector whose components fp correspond to fg/bg label assignments to pixels p ∈ P . The algorithm aims to find an optimal configuration of f according to the specified constraints. Based on the segmentation criteria, we define the objective function in terms of boundary, region, and shape model properties of the pixels as follows
II. T HE P ROPOSED M ETHOD A. Stage-I: Average Lung Shape Model Segmentation in medical imaging has challenges such as poor contrast, distortions caused by the acquisition equipment, and anatomical shape variations due to diseases. A segmentation algorithm without a priori knowledge about the objects may not produce satisfactory results on medical images. In order to provide a priori lung location, we incorporate a static lung shape model into the system. We employ a set of training masks to learn the lung shape model. Instead of using all training mask [6], we select the training set based on a simple shape similarity measure in order to increase the lung shape model accuracy. We first calculate the intensity projection of the histogram-equalized images in the vertical and the horizontal directions. Then we measure the similarity of both projection distributions using the average of the Bhattacharyya coefficient (Eq 1), p 1X p ( p1 (x)p2 (x) + q1 (x)q2 (x)) (1) 2 where p1 (x) and p2 (x) are the horizontal projections, q1 (x) and q2 (x) are the vertical projections of I1 and I2 , respectively, and x are the histogram bins of the projection vectors. BC(I1 , I2 ) =
Fig. 3. Training images for the lung shape model step are chosen according to the similarity of the lung shapes. Image similarity is calculated by comparing horizontal and vertical projections.
Once the training masks are chosen, the approximate shape model is calculated by taking the average of the selected masks. The computed lung shape model is a probabilistic model in which each pixel intensity is the probability of the pixel being part of the lung field. (Section II-B.2 describes the incorporation of the lung shape model into the graph structure.)
E(f ) = Ed (f ) + Es (f ) + Em (f ),
(2)
where Ed , Es and Em represent the data, smoothness and lung model terms of the objective function respectively. In
32
represent the ground truth and the segmentation results respectively. The quantitative results of all segmentations are shown in Figure 5. Each marker in the graph represents the dsc score of an x-ray image in the set. It can be seen that, almost all scores (98.7% of all cases) are higher than dsc = 0.80, which is for example sufficient to detect Pneumoconiosis [2]. The average dsc of the set is 0.91 ± 0.037.
order to confine the segmentation labels to be close to the image intensities, we formulate the edge weights between terminal and pixels as follows X Ed (f ) = (E{p,S} + E{p,T } ), (3) p∈P
E{p,S} = |Ip − IT |/Imax ,
(4)
E{p,T } = |Ip − IS |/Imax ,
(5)
where Ip denotes the intensity of pixel p, IS and IT are the virtual intensities of object and background terminals, and Imax is the maximum intensity value of the observed image. We model the terminal intensities using our training masks. E{p,S} and E{p,T } measure how well the assigned labels fit to the image intensities. To ensure nearby pixels have similar labels, we assign a high weight to neighborhood pixels that have similar intensities. The boundary penalties between pixel p and q are formulated as follows X Es (f ) = E{p,q} = exp(−(Ip − Iq )2 ). (6) p,q∈N
We incorporated the shape information into the edge weights between terminals and pixel p. Our lung shape model is formed as a 2D array with the same size as the observed image and contains the probabilities of the pixels being part of the lung field. Let P rp indicate the probability of being part of the lung for pixel p. The lung model energy can be formulated as follows X Em (f ) = P rp . (7)
Fig. 5. The dice similarity of each image in the JSRT set which contains 247 chest x-rays. Each marker in the graph represents the dsc score of an x-ray image in the set.
The segmentation of an x-ray image with a resolution of 1024x1024 takes about 8 seconds on a 2.27 GHz Intel Core 2 Duo CPU and 3 GB memory. Min-cut/max-flow is implemented in C++, and all other parts of our system are implemented in Matlab.
p∈P
After formulating the objective function, the next step is to compute the global minimum (min-cut) corresponding to the optimal labeling configuration satisfying the formulated constraints. We used a fast implementation of min-cut/maxflow [13]. The global minimum separates the graph into two subgraphs in which some pixels are connected to the fg terminal and the other pixels are connected to the bg terminal.
IV. C ONCLUSIONS AND F UTURE W ORK We have presented a robust lung boundary detection method that is based on a simple lung model calculation and a graph cut segmentation algorithm. For our experiments, we used a publicly available chest x-ray data set. We measured around 91% segmentation accuracy for this set which is comparable to the performance of state-of-the-art algorithms (95%) [4] and human-observer scores (94%). The proposed system calculates the lung models in a simple and an effective way. However, x-ray chest images contain variable lung shapes. Therefore, a static shape model is not sufficient to describe the lung regions. The next step of our work is to incorporate a dynamic shape model calculation stage into the system. We are planning to employ an imagebased registration algorithm for this step. A dynamic shape model will improve the boundary detection performance of the system. We will also evaluate the method on other x-ray data sets to test its robustness on varying imaging parameters and under the challenges identified earlier.
III. E XPERIMENTAL R ESULTS The system is evaluated on a data set of frontal chest x-rays compiled by the Japanese Society of Radiological Technology (JSRT) [9]. The set contains 247 chest x-rays, among which 154 x-rays are abnormal and 93 x-rays are normal. All x-ray images have a size of 2048x2048 pixels and a gray-scale color depth of 12 bit. The JSRT set is publicly available and has ground truth masks [4] for performance evaluation of lung segmentation. As an evaluation metric, we use Dice’s coefficient [14] which is the overlap between the ground truth (GT) and the calculated segmentation mask (S) (Eq.8). dsc =
2|S ∩ GT | |S| + |GT |
(8)
Figure 4 shows the visual quality of our segmentation results for some sample x-rays. The green and red contours
33
Fig. 4.
Segmentation results on JSRT x-rays. The green and red contours indicate ground truth and system segmentation results respectively.
ACKNOWLEDGMENT
[6] S. Jaeger, A. Karargyris, S. Antani, and G. Thoma, “Detecting tuberculosis in radiographs using combined lung masks,” Proc. of the IEEE Engineering in Medicine and Biology Society, 2012. [7] Y. Boykov and G. Funka-Lea, “Graph cuts and efficient n-d image segmentation,” Int. J. of Computer Vision, vol. 70, pp. 109–131, 2006. [8] S. Candemir and Y.S . Akgul, “Statistical significance based graph cut regularization for medical image segmentation,” Turkish Journal of Electrical Engineering and Computer Sciences, vol. 19, no. 6, pp. 957–972, 2011. [9] J. Shiraishi, S. Katsuragawa, J. Ikezoe, T. Matsumoto, T. Kobayashi, K. Komatsu, M. Matsui, H. Fujita, Y. Kodera, and K. Doi, “Development of a digital image database for chest radiographs with and without a lung nodule: receiver operating characteristic analysis of radiologists detection of pulmonary nodules,” AJR, vol. 174, pp. 71– 74, 2000. [10] S. K. Nath and K. Palaniappan, “Fast graph partitioning active contours for image segmentation using histograms,” EURASIP Journal on Image and Video Processing, 2009. [11] F. Bunyak and K. Palaniappan, “Efficient segmentation using featurebased graph partitioning active contours,” 12th IEEE Int. Conf. Computer Vision, pp. 873–880, 2009. [12] Y. Boykov and M.P. Jolly, “Interactive graph cuts for optimal boundary and region segmentation for objects in nd images,” Proc. of the Eighth IEEE International Conf. on Computer Vision, vol. 1, pp. 105–112, 2001. [13] Y. Boykov, O. Veksler, and R. Zabih, “Fast approximate energy minimization via graph cuts,” IEEE Transactions on Pattern Analysis and Machine Intelligence, vol. 23, no. 11, pp. 1222–1239, 2001. [14] L.R. Dice, “Measures of the amount of ecologic association btween species,” Ecology, vol. 26, no. 3, 1945.
This research was supported by the intramural research program of the National Library of Medicine and the National Institutes of Health. This research was also supported in part by an appointment to the NLM Research Participation Program. This program is administrated by the Oak Ridge Institute for Science and Education through an interagency agreement between the U.S. Department of Energy and the National Library of Medicine. R EFERENCES [1] Y. Shi, F. Qi, Z. Xue, L. Chen, K. Ito, H. Matsuo, and D. Shen, “Segmenting lung fields in serial chest ratiographs using both populationbased and patient-specific shape statistics,” IEEE Transactions on Medical Imaging, vol. 27, no. 4, 2008. [2] P. Annangi, S. Thiruvenkadam, A. Raja, H. Xu, X. Sun, and L. Mao, “A region based active contour method for x-ray lung segmentation using prior shape and low level features,” Proc. of the Int. Sym. On Biomedical Imaging: From Nano to Macro, pp. 892–895, 2010. [3] B. Ginneken, B. Romeny, and M. Viergever, “Computer-aided diagnosis in chest radiography: A survey,” IEEE Transactions on Medical Imaging, vol. 20, no. 12, pp. 1228–1241, 2001. [4] B. Ginneken, M. Stegmann, and M. Loog, “Segmentation of anatomical structures in chest radiographs using supervised methods: a comparative study on a public database,” Medical Image Analysis, vol. 10, no. 1, pp. 19–40, 2006. [5] A. Karargyris, S. Antani, and G. Thoma, “Segmenting anatomy in chest x-rays for tuberculosis screening,” Proc. of the IEEE Engineering in Medicine and Biology Society, 2011.
34