Jun 14, 2002 - also to my supervisors, who have been unfailingly positive, ... Ham, who pointed out long ago that I would be mad not to do .... nearest neighbour of a point in one âcornerâ of the space is almost ...... relationship between the age of the car and its odometer reading. ...... behaviour from such an instrument?
Graphical Models for High Dimensional Density Estimation
Gordon T. Deane
Thesis submitted in partial completion of the requirements for the degree of Bachelor of Science with Honours in the Department of Mathematics at the Australian National University
14 June 2002
Supervisors Dr. Markus Hegland Dr. Stephen Roberts
Acknowledgements In memory of the late Dr. David Paget, who truly taught me to love mathematics. Particular thanks to my parents, and to God, for ongoing love and support. Special thanks also to my supervisors, who have been unfailingly positive, interested and helpful. I acknowledge the assistance of Minos Garofalakis, who kindly sent me a copy of a Bell Labs report that expanded upon their published papers. Life in the basement has been much richer because of my comrades-in-arms Stephen Leslie, Patrick Costello, and Cathy Menon: for friendship, encouragement, and many long discussions about just about every topic under the sun. Also past comrade David Ham, who pointed out long ago that I would be mad not to do honours (on the dubious assumption that I wasn’t mad to start with). Markus Hegland, Stephen Roberts and my parents have both done significant quantities of proofreading, and errors are entirely my own fault. Many thanks to my house-mates David and Geoff, for relieving me of having to cook during the last few weeks, and numerous other instances of practical support and encouragement over the year. Last but not least, for their ongoing encouragement and prayers, in alphabetical order: Alistair, Ben J, the Cards group in general, several Davids, Emma (in defiance of probability!), Liz (for email full of sunshine), Lu, Gubba, Matt G, Nathan, Owen, Ruth, Steve J, and many other. No doubt I have missed somebody important. Anyway, thanks very much to all!
i
Contents Acknowledgements
i
List of Figures
v
Notation
vii
Chapter 1. Introduction 1.1. Motivation 1.2. Summary of research 1.3. Outline of this thesis 1.4. Originality 1.5. Non-parametric models
1 1 2 2 3 4
Chapter 2. Density Estimation 2.1. Probability in discrete and continuous spaces 2.2. The density estimation problem 2.3. The curse of dimensionality 2.4. Standard estimation techniques 2.5. Measuring the distance between density estimates 2.6. Non-parametric models
7 8 14 17 19 24 28
Chapter 3. Graph Theory 3.1. Chordal Graphs 3.2. Trees 3.3. The Clique Intersection Graph and the Clique Graph 3.4. Junction trees and chordality 3.5. Identifying junction trees 3.6. Implementation Notes
31 33 34 35 36 38 42
Chapter 4. Graphical Models 4.1. Markov networks 4.2. Relationships between the Markov properties 4.3. Chordal graphs 4.4. Zero density 4.5. Mixed discrete and continuous variable models
43 44 47 49 51 51
Chapter 5. The Forward Selection Algorithm 5.1. Preliminary results 5.2. Data structures 5.3. The algorithm 5.4. An example 5.5. Entropy methods 5.6. A turning point 5.7. Stopping criteria
55 56 61 62 64 65 69 71
iii
iv
CONTENTS
5.8. Choosing the edge to add 5.9. Modification to include constant functions 5.10. Algorithms for estimating marginal densities 5.11. Some efficiency considerations Chapter 6. Applications 6.1. Classification 6.2. Clustering 6.3. Query optimisation 6.4. Relationship to Bayesian networks 6.5. Relationship to sparse grids
73 76 78 80 83 83 85 87 92 93
Chapter 7. Outcomes and observations 7.1. Classification of mushrooms: a case study 7.2. Why do we need to visualise? 7.3. Interactive forward selection 7.4. GGobi
95 95 102 103 104
Chapter 8.
107
Conclusion and final remarks
Appendix A. Selected Code A.1. Addedge.py – Sun May 26 2002
109 109
Appendix. Bibliography
113
List of Figures 2.1.1
A dartboard, illustrating discrete and continuous random variables
3.0.1
A chordal graph and its connected regions
3.3.1
An example of a chordal graph with its clique intersection graph, clique graph and a junctio
3.5.1
A weighted graph with a maximum weight spanning tree
39
5.1.1
An example of the update when an edge is added
58
5.4.1
Example II, with eligible edges and connected components
66
5.4.2
Example II: Before edge addition
67
5.4.3
Example II: After edge addition
68
7.1.1
Model performance on 6 variables, starting with constants
98
7.1.2
Model performance on 6 variables, starting with 1D histograms
99
7.1.3
Model performance on 22 variables, starting with constants
100
7.1.4
Model performance on 22 variables, starting with 1D histograms
101
7.3.1
A screen capture of the interactive forward selection program in action 103
v
8 32
Notation Elementary notation assumed. f , g(· · · ) fˆ A⊂B A⊆B A\B |A| ∅ a.e.,a.s. �n
j=1
Sj
f is defined by the expression g(· · · ) An estimate of f A is strictly included in B, that is, A , B A is a subset of B possibly equal to B The set of elements of A not in B, which is not necessarily a subset of A For a finite set A: the number of elements in A The empty set Almost everywhere, almost surely: true except possibly on a set of measure zero The direct product of the sets S j , that is, {(s1 , s2 . . . , sn ) : s1 ∈ S1 · · · sn ∈ Sn }
Textual conventions and computer science notation. classify() An expression or name in the Python programming language graph.py A filename, especially Python module names O(kn2 ) The time complexity (number of operations) of an algorithm divided by kn 2 is bounded as k, n → ∞. Glossary of mathematical notation that will be defined. Pr{E} ν�µ g� f
Lp Lp ( f, g) K( f, g) x, y xA [x] fS X, Y, Z A, B, S
The probability of the “event” [set] E The measure ν is absolutely continuous with respect to µ, see definition 2.1.4. R The probability measure of a density g, ν(E) , E g dx is absolutely continuous R with respect to that of density f , µ(E) , E f dx. This means f (x) = 0 ⇒ g(x) = 0 a.s., see definition 2.1.5. R The vector space of measurable functions having finite Lebesgue integral | f |p � p1
�R
| f − g|p The Lp space norm f − g = R f The K-L divergence of f and g, f log g (see Section 2.5) Vector-valued quantities: x = (x 1 , x2 . . . , xN ) x projected onto the subspace A: eg. x {1,3,4} = (x1 , x3 , x4 ) The closest point in RN having integer coordinates The marginal (projection) of a density f on a subspace S Chapter 2 and 4: Real-valued (one-dimensional) random variables Chapter 4: collections (sets) of random variables: eg. A = {X, Y} vii
viii
A, B, S A y B|S
NOTATION
Collections of vertices eg. A = {a, b, c} A is conditionally independent of B given S, see Chapter 4.
CHAPTER 1
Introduction 1.1. Motivation The modern world is full of large data sets: census data, multimedia databases, and remote sensing data, to name a few. With the aid of computers it is possible to collect scientific data on a grand scale. These examples are not “large” merely because they have many data points. They are also high dimensional, meaning that there are many measurements taken of each person, multimedia object, or point on the ground. The “data point” representing one person is made up of their age, gender, educational level, occupation, and whatever else was recorded. Suppose there are 12 attributes recorded for each person. We can think of that person’s record as a point in 12 dimensional space. So, we have a set of data points in a high dimensional space: how can we extract useful information from this data? In one, two, or even three dimensions, we can answer our questions using established statistical tools that reliably capture what is in the data. As the number of dimensions increases, things start to go wrong, and this toolbox becomes increasingly unhelpful. The difficulties do not merely arise because specific algorithms are unable to cope well with the increasing dimension. The problems are a consequence of a much deeper philosophical problem called the “curse of dimensionality”. If our data is in (say) a 20 dimensional cube the relationship between distances and volumes defies our three dimensional intuition. Even a data set with a million points is “sparse” in such a space. For example, the nearest neighbour of a point in one “corner” of the space is almost certainly closer to a completely different corner. There are many similar intuition-defying results, and the curse of dimensionality causes problems for almost any statistical method we try. What statistics really does is make models of the data. If we can work out the model parameters that best describe the data, the model gives us a summary of the data set that we can then answer questions and make predictions with. So what we need are more sophisticated models that can describe high dimensional data and mitigate the curse of dimensionality. This is where mathematics comes in. Another problem is that we can only manage large data sets with digital computers. Therefore a statistical technique is only as useful as the best algorithm that implements it. That in turn means we have to consider each algorithm’s storage requirements and running time, which is the domain of computer science. As the number of points increases these requirements become strenuous and we are in the realm of data mining. 1
2
1. INTRODUCTION
1.2. Summary of research This honours project was the study of a data mining tool, and therefore addresses the mathematics, statistics and computing aspects. That tool consists of: • a class of models represented using graph theory • an algorithm designed to find an appropriate graph (model) for given data • a procedure that uses this model to compute a probability density estimate from the data The author implemented all the relevant algorithms from scratch in the Python programming language, including code for many other aspects of the problem. The result was an interactive program in which to experiment with graphical models. This program was successfully applied to a sample classification task: that of determining the edibility of mushrooms in a data set based on their appearance and smell. The code could easily be applied to a wide range of other problems, but there was insufficient time to fully explore its potential. The main part of this thesis is a synthesis and orderly presentation of the theory behind that tool and the algorithms that were used to implement it. In the nature of a mathematics thesis, it perhaps emphasises the former at the expense of the latter. Similarly, chapters 6 and 7 discuss many possible applications, but the actual results obtained are a fairly small part of this discussion. Appendix A contains a very tiny portion of the code, showing the core algorithm described in chapter 5. There are also remarks throughout the thesis about implementation issues. Nevertheless, very little of the coding effort shows up in this document. A mathematics thesis is not an engineering project, but in computational mathematics it is important to implement and test algorithms on real data. This is especially important for those aspects of an algorithm that are heuristic or empirically motivated and for which the available theory is limited. Therefore, the body of code that was written has been submitted in electronic form along with this thesis. 1.3. Outline of this thesis In the next chapter we briefly introduce the necessary background statistical material, beginning with probability theory and then the task of estimating a density (a description of the probability in our feature space). This includes a brief survey of existing density estimation tools and ways of measuring the performance of a density estimator. Chapter 3 introduces graph theory and presents some elegant mathematical results about a class of objects called “chordal graphs”. Chapter 4 combines chordal graphs with some assumptions called “Markov properties” to produce graphical models. We develop some important results about these models. The key feature is that the high dimensional density function is constructed out of more tractable
1.4. ORIGINALITY
3
low dimensional estimates. A graphical model is therefore specifically designed to address the curse of dimensionality. Once we have a graphical model, all we need to do is to make a few low dimensional density estimates using some standard algorithm. For these models to be useful we need an algorithm to fit them to our data. A recently published “forward selection” algorithm for chordal graphs is presented in detail in chapter 5. This rounds out the nice body of theory of chapters 3 and 4 by using it to prove this quite clever algorithm. The remainder of chapter 5 is devoted to practical issues related to this algorithm, such as how to direct it and when to stop. This is less rigorous and more heuristic due to the nature of the technique and the difficulty of the underlying problem. By the end of chapter 5 we have presented our tool: we can estimate densities by forward selection of graphical models. We then move on to look at the sort of things that this tool could be used for and has been used for. Broadly speaking, a density estimate helps us in two ways: Firstly, we can use it to explore and better understand data. Typical applications include clustering and mode hunting (looking for regions with lots of data), visualisation, and comparison with other models we might hypothesise. Analysing high dimensional data sets is difficult; but, this tool helps us investigate unknown data, identify regions of interest, and perhaps inspire the right questions to ask next. A second major use is to describe and summarise data. We can use the density estimate as a classification tool, or to assist with high dimensional regression. Because it contains summary information about our data, a density estimate can significantly speed up relational database queries and perhaps other data mining algorithms. A brief introduction to a few of these applications is given in chapter 6. Visualising high dimensional data is inherently very difficult. During this project, some effort was put into writing code to visually investigate the behaviour of the algorithm being studied. Chapter 7 introduces the “interactive forward selection” program and the “GGobi” visualisation system, and their use in debugging and performance characterisation. We present visual results of an investigation into the algorithm’s success at mushroom classification. 1.4. Originality The primary original contribution of this thesis is the code I wrote during the research. Although the algorithms are not novel, this is a completely new implementation. I am not aware of any previous application of this particular density estimation algorithm to classification, although the idea of classification using densities is well established. None of the results in chapters 2, 3 or 4 are original, although they have been assembled from different sources. As one would expect, I have rewritten or entirely re-invented some of the proofs to blend with others or to avoid introducing different lemmas. In particular, I have relied heavily upon “junction trees” and avoided proofs using “elimination orders”
4
1. INTRODUCTION
as much as possible. I have avoided mentioning “running intersection orders” at all (they turn out to be elimination orders of a junction tree). While popular in older papers, I felt that these constructions led to obscure and difficult proofs, and junction tree arguments were easily substituted instead. All proofs that I invented use standard graph theoretic techniques and are unlikely to be novel. The algorithm in chapter 5 is taken from a cited paper, as are all the results. Many were not proved in that paper, or the proofs were condensed and hard to follow. Some of these results have been expressed in quite different ways, especially lemma 5.1.6 (which was strengthened, to omit a redundant condition) and lemma 5.1.7 which was completely reworked to do both directions properly. Most of the proofs in chapter 5 are therefore my own, using the machinery established in previous chapters. Having said that, I am grateful to the authors of that paper for a bibliography that led me to most of the sources for material in chapters 3 and 4. The modification of the forward selection algorithm to include constant functions (section 5.9) is an original contribution. Since the original algorithm only applied entropy methods, the greedy algorithm using classification score could be considered novel as well. (Both of these techniques were implemented in the code, and are evaluated in chapter 7). Chapter 6 is mostly a summary and synthesis of applications suggested by others, although I have noted some interesting possibilities that occurred to me during the course of a year’s research. The experimental results presented in chapter 7 are original. That chapter also mentions a small “plug-in” that I wrote for the GGobi visualisation software, which was also original work, and quite useful at the time.
1.5. Non-parametric models The density estimates discussed in this work are considered non-parametric models, and it is worth saying a few words about their general nature and philosophy. A precise definition of “non-parametric” is a matter of some debate and will be discussed further in section 2.6. The archetypal parametric model is the normal distribution, which is completely specified by two parameters, the mean and variance. Suppose we have some data that we know are normally distributed. Using traditional statistical methods we can obtain optimal estimates of these parameters. This gives us an extremely good density and distribution estimate, superior to just about any non-parametric estimate. Parametric models typically come with an impressive body of theory supporting their use, and describing their properties (error, bias, variance, convergence, and many others). A histogram is a typical non-parametric model, where the density is approximated by finitely many piecewise constant intervals. This has many more parameters — one for
1.5. NON-PARAMETRIC MODELS
5
each interval — and can be fitted to a wide range of possible distributions even when no parametric model is known. Why would we bother with non-parametric models? The first justification is that, when we first encounter a data set, we don’t know what the distribution is like at all. If we fit a normal distribution to data that did not come from such a distribution, the resulting model may not be at all useful. A non-parametric model typically makes few assumptions about the data, and can allow us to investigate and visualise the data without much knowledge. This gives us a powerful tool for “exploratory data analysis”, where we try to understand what is happening in the data before we pose detailed specific statistical hypotheses. After we have done this we might find that the non-parametric model helps us identify a parametric model to use. Then again, it might not. Real data sets are often very complex. For example, there may be many spread out clusters of points with complicated shapes. In many real problems there may be no parametric model available, even more so in a high dimensional space. This may be because we can’t identify a model, or it may be because the behaviour is so complex that any model would have about as many parameters as a non-parametric model anyway. To summarise the argument: non-parametric models are not only a useful tool in understanding and exploring our data, for many real data sets they may be the only tool we have. The study of higher dimensional statistics has traditionally suffered from a shortage of tools, which makes the graphical models presented in this thesis very promising. This thesis can at best be an introduction to the considerable body of theory about this topic. At the same time, many statistical and algorithmic aspects of graphical models are developing rapidly, and many of the algorithms and techniques that will be mentioned are “cutting edge” and extremely current. A wide range of possible applications and modest computational demands all combine to motivate further research into this technique. Overall, the research presented in this thesis leads to the conclusion that graphical models are a very powerful tool for modelling high dimensional data.
CHAPTER 2
Density Estimation
In the introduction we proposed that our data could be described as points in a high dimensional space. More than that, we will think of them as independent, identically distributed samples from some probability distribution over that space. This chapter will explain what that means, and how we are going to represent that distribution using a density. Another word for “description” or “representation” would be summary: the density gives us a condensed record of the way our data is spread out in space. In some cases this density could reflect some underlying physical probability. That is a scientific question about the particular problem area, and beyond our scope. We will use a “probability density” merely as a convenient interpretation of a data set that helps describe where the data is. The “independent samples” assumption is a bit stronger. Our data sets are unordered, that is, there is no information contained in the order that they are recorded electronically. Mathematically, we take the data as a set rather than a sequence, although we will give them indices for convenience. This is a reasonable assumption about many kinds of data that are in some way sampled, such as census or spatial data. It is even true of observations including “time” as one of the dimensions, but “time series” are likely to be better investigated using other techniques. (The darts example in the next section is a time series) Some probability theory is essential to understanding the problem of density estimation. In this chapter we will survey some of this theory, a few techniques for estimating densities, and discuss problems that occur in high dimensional spaces. Since we would like to be able to have both discrete and continuous-valued quantities within a single model, it will simplify our notation to slightly extend the usual definition of density. Nevertheless, the issues surrounding continuous and discrete variables will recur throughout the chapter. It is not possible to give more than a sketch or brief survey of the voluminous theory or practical detail surrounding density estimation. Some of the results presented will be needed in later chapters, especially the histograms and entropy methods. Others topics (such as the L1 norm) are presented for completeness of treatment and because of the insight they give into the density estimation problem. Still other topics are mentioned because of interesting connections or possible future work (kernel and spline estimators). 7
8
2. DENSITY ESTIMATION
z
Z
Y
1
y
Xt =1
F 2.1.1. A dartboard, illustrating discrete and continuous random variables 2.1. Probability in discrete and continuous spaces There is always a tension when presenting probability between informal notions of chance and randomness, versus the intimidating machinery of measure theory that is used to properly codify them. The former come with some subtle dangers, while the latter can obscure what is going on even when the machinery is familiar. This section will proceed by example, rather than trying to rigorously define all the terms. It is intended more as a refresher for the reader than a complete coverage. The reader is referred to texts such as Feller [Fel57] for a thorough explanation. Random variables. Suppose we are playing darts on a conventional dartboard, which is a circular board marked with 82 scoring regions as shown in figure 2.1.1. For each dart that hits a particular region 0 ≤ i ≤ 82 we score s(i) points (where we let region 0 represent missing the dartboard, and region 1 the center bullseye). Let X t be the region we hit with dart number t (for example, if our second dart hits region 5 then X 2 = 5). Then Xt is called a random variable and the sequence {X t } is called a random process. Suppose we threw many darts aimed at the center of the board, and assume that our throwing skill remained consistent. We might notice that the proportion of throws landing in region i was converging to some number independent of t that we think of as the probability Pr{X t = i}. Alternatively, we might think of a (possibly infinite) set of “throwing motions we might make”, and making a throw as selecting one at random. This set might change as we improve our aim during the game, or get worse as we drink our beer. Even so, we have a notion of the probability (“chance”) of an event such as scoring a bullseye on a particular shot, written Pr{Xt = 1}. This probability ranges from 0, meaning ”impossible” to 1,
2.1. PROBABILITY IN DISCRETE AND CONTINUOUS SPACES
9
meaning “certain”. The probability of scoring a bullseye on both shot t and on shot t + 1 is denoted Pr{Xt = 1, Xt+1 = 1} . If we have already hit the bullseye on shot t, the probability of hitting it again is the conditional probability Pr{Xt+1 = 1 | Xt = 1} ,
Pr{Xt = 1, Xt+1 = 1} Pr{Xt = 1}
(2.1.1)
Two events P, Q are independent if Pr{P, Q} = Pr{P} Pr{Q}. For example, if P is the event Xt = 1 and Q is the event that the person at the next dartboard got a bullseye at the same time. We say the random variables Xt and Xt+1 are independent if Pr{Xt = a, Xt+1 = b} = Pr{Xt = a} Pr{Xt+1 = b} for all possible outcomes 0 ≤ a, b ≤ 82. We might be able to repeat a shot better than we can correct a miss, so the conditional probability above might be higher than Pr{Xt+1 = 1}, and then the two successive shots are not independent. D 2.1.1. Informally, a random variable X is a number that takes on a randomly chosen value from R with some probability distribution: for any x ∈ R, F(x) = Pr{X ≤ x}. A distribution must be a monotonic non-decreasing function with infimum 0 and supremum 1. It is conventional to use capital letters for random variables and lower case for fixed numbers. D. The term distribution is also used more broadly for the probabilistic behaviour represented by F, as well as for the function itself. If X is the result of an experiment such as throwing dice, then as we repeat the experiment a large number of times, the proportion of times that X takes a value less than or equal to x should converge to F(x). This is an informal statement of the law of large numbers, for which it is sufficient although not necessary that the different samples of X are independent and have identical distribution. If we have multiple variables, say X, Y and Z, we need a joint distribution FXYZ (x, y, z) = Pr{X ≤ x, Y ≤ y, Z ≤ z}
(2.1.2)
In the darts example, FX1 X2 (0, 1) is the probability of missing on the first throw and on the second throw either missing (Xt = 0) or scoring a bullseye (Xt = 1). This can all be defined in a much more rigorous way. We aren’t going to use the following definition much, but it introduces the useful idea that a random variable is actually a function rather than a slippery random quantity. D 2.1.2. Formally: Let Ω be a sample space whose elements ω are called sample points, and P a measure (the probability) defined on a σ-algebra F of subsets of Ω. The elements of F are called events. A random variable X is a function from Ω to R with distribution Pr{a < X ≤ b} , P({ω : a < X(ω) ≤ b}) (2.1.3) and we require the condition {ω : X(ω) < x} ∈ F for all real x, that is, X is measurable by P.
10
2. DENSITY ESTIMATION
If we have variables X1 , X2 . . . , XN , each a function from Ω to R, the joint distribution is given by the intersection: F{Xi } (x1 , x2 . . . , xN ) = Pr{Xi ≤ xi : i = 1..N} = P(∩N i=1 {ω : Xi (ω) ≤ xi })
(2.1.4)
That is, Pr{X ∈ E} is a measure on the Borel sets E ⊆ R defined by the function X and by the measure P(·) via Pr{E} = P(X −1 (E)). (We will not need to encounter sets that are not Borel measurable, so the reader unfamiliar with them should not be concerned.) Continuous random variables. Our variable X t had finitely many possible values. Now let (Y, Z) be the coordinates of the point our dart hits, as on the right hand side of figure 2.1.1, where the scoring region is the unit circle in the y, z plane. Assume we always hit somewhere on the plane. Y and Z are continuous random variables taking values in R. We still have a distribution as before: for example, we might have an equal likelihood of hitting any x-coordinate between −1 and 1, giving F X (x) = x+1 2 . The “probability” of any single x-coordinate x ∈ R can only be found by taking limits: Pr{X = x} = F(x) − lim F(a) = 0 a→x−
as the distribution is continuous everywhere. All distributions are right continuous. If F were not left continuous at x we would have a positive probability called an atom, of which there can be at most countably many. For instance, consider the daily quantity recorded by a rain gauge as a random variable. This is a non-negative real with an atom at zero equal to the probability that there was no rain. Instead of struggling with points we turn to intervals: for example Pr{ 14 < R ≤ 31 } is easily found to be F( 31 ) − F( 14 ). d Densities. Because FX has a derivative, f (x) , dx FX (x) = 12 , we could instead find this probability by integrating f : � � Z 1/3 1 1 Pr = f (x) dx (2.1.5) 0 we define bins (y + mh − 12 , y + mh + 21 ] for positive and negative integers m. The histogram is defined by 1 fˆ(x) = (number of x[j] in the same bin as x) p
(2.4.2)
We take the bins to be half open so that they are disjoint and cover the space. Since we are assuming the data to be in a bounded region R we will only need finitely many bins. To construct a histogram we need to choose a bin width and origin. The bin width is the most important since it controls the amount of smoothing. The multivariate histogram uses the product bins, which are multi-dimensional “rectangles” N � 1 1 (yi + mi hi − , yi + mi hi + ] 2 2 i=1
where y is an origin point in RN , hi is the bin width along dimension i, and (m 1 , m2 . . . , mN ) are integers identifying the bin. Again, for fixed h i in a bounded space we only need finitely many bins. The estimate fˆ(x) is still given by equation (2.4.2).
2.4. STANDARD ESTIMATION TECHNIQUES
21
A histogram is therefore a piecewise constant function on the bins. The advantages of a histogram are: • They are extremely simple to compute. Take an array in memory with one cell per bin, initialised to zero. Loop once through the data (j = 1 . . . p) incrementing the count in the cell x[j] is in. Then divide the entire array by p. • Once estimated, they can be evaluated extremely simply and quickly. To find fˆ(x) merely round off to find the bin (for each i ≤ N calculate m i = [(xi − yi )/hi ]). Then perform an array lookup to find fˆ. • Histograms are straightforward to understand and well studied. There is a wealth of theoretical and practical results about their behaviour, including ways to choose good bin widths. • In the limit as the number of data points p goes to infinity and the optimal bin size goes to zero, a histogram converges to the true density. More surprisingly, they have an optimal convergence rate with respect to p, although this is of little practical use to us. • Integrals involving fˆ, such as expectations or entropies (discussed later), reduce to sums. Usually these can be expressed using matrix and vector operations and therefore computed extremely efficiently using numerical libraries. Some of the disadvantages are: • The storage requirements expand with order h −N and simple histograms become very expensive above about two or three dimensions. • The piecewise constant nature can lead to quite large point-wise errors, especially at the bin boundaries of highly populated bins. • Histograms are also not very accurate in the “tail” of a distribution, where there are only a few points in each bin. In more than two dimensions there are likely to be many empty boxes or boxes containing few points (as mentioned in the “curse of dimensionality” discussion). It is generally considered impractical to use histograms for more than three continuous dimensions. • fˆis discontinuous and where it is differentiable it has zero derivative. It is therefore not possible to perform hill climbing or related algorithms. (A crude estimate of the derivative could be obtained by interpolating between bins in some way)
Discrete variable histograms. In the discrete case (with a finite space) we take one bin for each possible outcome and the histogram is the empirical density. That is to say, counting the frequency with which an event E happens is normally the most sensible way to estimate Pr{E}. This was the only kind of estimator actually implemented in the code written during this thesis. Continuous variables can be estimated by such an estimator if they are binned beforehand, that is, if the bins are chosen in advance.
22
2. DENSITY ESTIMATION
Discrete variable histograms may be useful in more than three dimensions. If we have N binary valued variables then we need 2 N bins and this might be tenable to, say, 10 dimensions depending on p and how well spread the data is through that space. Implementation note: Discrete histograms were implemented in the module histogram.py.
Adaptive histograms, and variations. One dimensional adaptive histograms use varying bin widths. This allows them to use wider bins in the tail and narrow bins where the density is high. This needs to be balanced against the extra complexity of the estimator. By storing the bin boundaries in a balanced tree structure the cost to make an estimate can still be quite low. An adaptive multi-dimensional estimator can be implemented by taking the product bins of N one-dimensional estimators. A more radical approach is to recursively divide the space along a chosen dimension, so that some of the “hyper-rectangles” can be refined without necessarily refining others near them. Various rules can be used to choose how to subdivide. A survey of such methods, including an algorithm called M-HIST, was given by Poosala and Ioannidis [PI97]. We will come back to this method in section 5.10.
Frequency polygons. Interpolating between the centers of histogram bins gives a piecewise linear function that agrees with the histogram at those centers. This is called a frequency polygon. It is non-negative and integrates to one so it is a density, and slightly improves on the histogram in some respects. In two dimensions the interpolation can either be done by dividing the histogram into triangles (there are several ways of doing this) or by “blending” the corners of quadrilateral elements. The latter gives functions that are not piecewise linear but are still densities. In three dimensions it is be necessary to blend on some kind of polyhedral tiling of the space. Frequency polygons were not used but might be interesting for future work. They have many of the same advantages and disadvantages as histograms.
Miscellaneous techniques. Historically, a number of other ad-hoc or heuristic techniques have been used to estimate one dimensional densities. This includes “nearestneighbour” methods and local linear or polynomial regression. Silverman’s book gives a survey of such methods. Many turn out to be special cases of a kernel estimator or generalised kernel estimator. Some have interesting computational shortcuts, but there is little theoretical reason to use them. The multivariate generalisations of such methods are even less useful and will not be considered. (For example, the concept of a “nearest neighbour” data point is nearly meaningless in high dimensional spaces due to the curse of dimensionality — see Aggarwal et. al [AHK01])
2.4. STANDARD ESTIMATION TECHNIQUES
23
Generalised kernels, penalised maximum likelihood and spline methods. There are a number of techniques based on minimising a functional of fˆ based on both the likelihood R 00 and some penalty term, such as the second derivative α fˆ . The parameter α controls the smoothing. A variant of this was developed in an honours thesis by Hooker [Hoo99], fitting spline densities to minimise a linear functional using a finite-element method. This has many computational advantages, during both estimation and evaluation, and can enforce quite strong smoothness conditions on the density. Its performance in more than two dimensions has not yet been investigated. It turns out that these methods, along with histograms and just about every other density estimator, are instances of a generalised kernel method. This leads to some important theoretical results, including optimal convergence rates as p → ∞. Even a brief introduction to this topic is well beyond our scope. Estimation techniques for higher dimensional problems. So, if we have a higher dimensional problem and no parametric model in sight, what can we do? This is an area of active research, and it is really too early to speak of “standard” methods. If we assume that the important interactions are in some sense “low dimensional”, perhaps at most about 5 dimensions, there are a number of ways of reducing the effective dimension of our estimate. Some interesting techniques that have been developed for such problems are listed below. 1. Sparse grids combine a number of estimates on relatively coarse meshes (grids) into a single estimate with much smaller error. These meshes may only include a subset of the variables, or have a large mesh size h i in some directions. These coarser mesh estimates require vastly less memory than the full grid, and have proved quite adept at overcoming the curse of dimensionality. The estimate on each mesh can, for example, be a projection onto the space of piecewise linear functions ([NR01], and a related paper [HNS00]). We will very briefly mention a connection between graphical models and sparse grids in section ??. Although sparse grids have been developed as a continuous variable method they could straightforwardly be extended to discrete variables. 2. Density trees are the application of “classification and regression tree” techniques to density estimation. Hong Ooi’s PhD research has shown promising results from this technique. The space R is recursively partitioned to minimise some error criterion (for example, mean integrated squared error — see the next section). This gives a piecewise constant density on a tree of partitions very similar to an adaptive histogram, which will in general over fit the data. The next phase reduces the number of boxes either by pruning the tree or by combining boxes into clusters. A paper [Hon02] is to be published soon. 3. Graphical models have excited considerable interest in the statistical and artificial intelligence communities because of their potential to address high dimensional problems.
24
2. DENSITY ESTIMATION
One approach leads to “Bayesian networks”, which have proved useful in areas such as machine learning and medical diagnosis. These will be discussed briefly in section 6.4. 4. Markov networks are a different kind of graphical model. They are the subject of the rest of this thesis (specifically, chapters 4 and 5, but we will need to introduce graph theory in chapter 3 first). 2.5. Measuring the distance between density estimates D 2.5.1. For any fixed p > 1, the L p distance between two densities f and g is !1/p Z p (2.5.1) Lp ( f, g) , | f − g| dx This is always a norm on f − g, and has the usual properties of norms: • It is zero iff f = g, otherwise it is strictly positive • It is symmetric: Lp ( f, g) = Lp (g, f ) • It satisfies the triangle inequality Unfortunately it is often impossible to calculate L p ( f, fˆ) distances empirically because f is unknown. If we have a sequence of estimates fˆn we can calculate Lp ( fˆn+1 , fˆn ); the triangle inequality tells us when we have something like Cauchy sequence convergence. Whether the sequence converges to f is another question. The L1 norm. L1 ( f, g) =
Z
| f − g| dx
(2.5.2)
The range of L1 is between 0 and 2 from the triangle inequality. It has a number of unique properties; Devroye considers it the “natural space for all densities” [Dev87, sec 1.2] and provides a large body of theoretical results. Let us define some terms (from that work): D 2.5.2. The total variation between two probability measures µ and ν on the Borel sets of RN is (2.5.3) v , sup µ(E) − ν(E) E
T 2.5.3. (Scheffe) For any densities f, g Z Z Z g = 2 × (total variation) L1 ( f, g) = 2 ( f − g) = 2 sup f − D
E
E
(2.5.4)
E
where D = {x : f (x) > g(x)}
A proof may be found in Devroye, theorem 1.1. The total variation has a very simple interpretation: the probability of any event [set] E according to f differs from that according to g by at most v. So v = L1 ( f, fˆ)/2 bounds the error in an estimate fˆ. Even better, it tells us something about Bayesian classification, which will be discussed in section 6.1. When we try to classify an observation x according to which of two distributions f and g is
2.5. MEASURING THE DISTANCE BETWEEN DENSITY ESTIMATES
25
most likely to have produced it, the probability of misclassifying a point turns out to be 1 1 ˆ 2 − 4 L1 ( f, g). So minimising the distance L 1 ( f, f ) is equivalent to maximising the confusion — the difficulty of classification — between the density and its estimate (from Scott [Sco92, section 2.3]). D 2.5.4. T : RN → RN is called a rich transformation if {T −1 B | B ∈ B} = B where B denotes the Borel sets of RN . It will be sufficient to note that T must be one-to-one, and transforming each coordinate separately via a strictly increasing mapping will do. It happens that the L1 distance is invariant under rich transformations, which is not true for other Lp norms (ibid, section 1.1). For example, applying x → x/(1 + |x|) is a rich transformation of the whole real line to [−1, 1], so that the tail of an infinite distribution can be plotted or reduced to this compact set without affecting L 1 norms. This is related to the fact that the units of a density are length −1 so L1 is dimensionless, whereas L2 still has those units. The L2 norm. One interesting quantity is the Mean Squared Error (MSE) at a point x, MSE{ fˆ(x)} , E[ fˆ(x) − f (x)]2 = Variance{ fˆ(x)} + Bias2 { fˆ(x)}
(2.5.5)
where Bias{ fˆ(x)} , E[ fˆ(x)] − f (x). So the square of the pointwise error is the sum of a variance term and an estimator bias term. All non-parametric estimators have a trade-off between bias and variance, but this is not as clear when we work with the L 1 norm. Moving from pointwise to global estimates, the Mean Integrated Squared Error is Z 2 ˆ MISE , E[L2 ( f, f ) ] = MSE{ fˆ(x)} dx Note that the L2 norm pays less attention than L1 to the tails of the distribution (where f is small). This may or may not be desirable, although the tails are often difficult to fit properly with any technique. Despite the numerous theoretical advantages of the L 1 norm, it can be difficult to use in practical analysis. If we aim instead to minimise the MISE (a “least squares fit”) we can obtain a wide range of useful theorems about the L 2 error. We will not discuss this further, and the reader is referred to Scott [Sco92] for more information. To give an example: optimal histogram bin widths and the corresponding errors in the L 2 norm are much more straightforward to investigate than the corresponding L 1 results. Other Lp criteria. Many of the algebraic tricks that make L 2 so convenient also work for larger even p, such as L4 or L6 . For instance, it is possible to derive the optimal histogram widths and convergence rates in these spaces, and the answers are similar but slightly different from the L2 results — see Scott, section 3.6.2. They would pay even less attention to the tails of a distribution. These norms do not seem to have been used much in practice.
26
2. DENSITY ESTIMATION
The norm L∞ = ess sup | f − g| is seldom mentioned. Perhaps this is because, unlike a R regression fit, a density estimate is globally constrained to have fˆ = 1. As a consequence, the point-wise error is a difficult measurement to optimise against. Entropy and the Kullback-Leibler number. Another interesting and quite useful way to measure how “close” two densities are is related to distribution testing (did some data come from a given distribution?) It is also related to the amount of “information” that the densities capture. Unfortunately it is not a norm like the L p distance, but that isn’t really a problem here. A major bonus is its computational advantages for the kind of models we will construct in chapter 4. Because of this, we will take a slight digression to build a foundation that will be needed in those later chapters. Throughout this section we casually take the logarithm of functions that might be zero. Sometimes there are extra conditions given, but the general principle is that we replace this with zero when taking this integral. Basically, because lim x→0+ x log x = 0, and because f (x) = 0 implies that all projections f S (x) are zero, everything works fine. Attending to the zero conditions at every step would make the treatment unnecessarily cumbersome. D 2.5.5. The Kullback-Leibler (K-L) number of two densities f and g, also called the “information divergence”, “discrimination information” or “cross-entropy” is R f f log g dx f � g K( f, g) , (2.5.6) ∞ otherwise
The function x log x is convex for x ≥ 0 (since f and fˆare non-negative) and limx→0+ x log x = 0, so there is no problem in deciding to interpret 0 log 0 as 0 in this integral. If f � g and g(x) = 0 then f (x) = 0 a.s. and we consider the integrand to be zero. Another way of looking at this is Z Z K( f, g) =
log f dF −
log g dF
(2.5.7)
where dF = f dx denotes the probability measure that f is the density of. It is therefore reasonable to ignore regions of measure zero, where f = 0, and this includes regions where g = 0 because of the absolute continuity. Since
R
f = 1 Jensen’s inequality gives ! Z Z g g f dx = 0 −K( f, g) = f log dx ≤ log f f
so K is non-negative, vanishing if and only if f = g. The K-L number is dimensionless and invariant under rich transforms just like the L 1 distance (see Devroye). Unfortunately K is not symmetric in f and g, nor does it satisfy the triangle inequality; it can also be infinite even when f � g. We now give a neat result that uses this number to bound the L 1 norm, and thus partially justifies the use of this number in measuring the “closeness” of distributions.
2.5. MEASURING THE DISTANCE BETWEEN DENSITY ESTIMATES
T 2.5.6. Let K = K( f, g) and L1 = L1 ( f, g). Then √ L1 ≤ 2K
27
(2.5.8)
(Kullback (1967) Csiszar (1967) and Kemperman (1969)) and also √ L1 ≤ 2 1 − e−K ≤ 2 − e−K
(2.5.9)
(Bretagnolle and Huber, 1979) A proof may be found in Devroye, [Dev87, chapter 1]. The latter bound is slightly sharper for small values of L1 , but the implication is the same: if we can make K( f, g) small, then the L1 distance will also become small. D 2.5.7. The entropy of a density f is Z H( f ) , − f log f dx
(2.5.10)
The domain of integration is the whole domain of f , so for a set S (as above) we have the marginal entropy Z H( fS ) = −
fS (xS ) log fS (xS ) dxS
(2.5.11)
Implementation note: Entropies of discrete histogram estimates were implemented in histogram.py using Numeric Python vectorised operations. It was necessary to use “masked arrays” to avoid taking the logarithm of zero array elements. D 2.5.8. Let g1 , g2 . . . gm be non-negative functions and b1 , b2 . . . , bm non-zero real constants. Then the log-linear combination is the non-negative function Q bk m k=1 gk (x) g(x) , 0
if all gk > 0 otherwise
(2.5.12)
taking the positive real root for non-integer powers. The name arises because where g , 0, the logarithm of g is a linear combination of the logarithms of the g k . log g(x) =
m X
bk log gk (x)
(2.5.13)
k=1
T 2.5.9. Let f be a density on R, and S 1 , S2 . . . , Sm some marginals (collections of dimensions). Let g be a log-linear combination of the projections of f , taking g k (x) = fSk (xSk ). Then K( f, g) = −
Z
f (x) log g(x) dx − H( f ) =
m X k=1
� � bk H fSk − H( f )
(2.5.14)
This means that if we use a log-linear combination of marginals to estimate f , the K-L number is a simple combination of the marginal entropies.
28
2. DENSITY ESTIMATION
P. (Based on the discrete variable proof given by Malvestuto, [Mal91]) Let S⊥ , {1, 2 . . . , N} \ S represent the variables not in S. −
Z
f (x) log g(x) dx = − =− =−
Z m X
k=1 m X k=1
f (x)
m X
bk log gk (x) dx
k=1
bk bk
" Z
f (x) log fSk (xSk ) dxS⊥ dxSk k
fSk (x) log fSk (xSk ) dxSk
(2.5.15)
(the projection of f )
�
If we estimate some density f with log-linear combinations of lower dimensional marginP als, H( f ) will be constant and we can minimise K purely by minimising bk H(gk ). E 2.5.10. If wherever f is non-zero, and hence f S (x) , 0 for all S, we let Y . Y fe(x) = fS (xS ) fS0 (xS0 ) S∈M
for some sets M, N of marginals, then X X K( f, fe) = H( fS ) − H( fS0 ) − H( f ) S∈M
(2.5.16)
S0 ∈N
(2.5.17)
S0 ∈N
We will get densities of the form 2.5.16 in chapter 4, and now we can determine the entropy from the entropy of the marginals. These are particularly easy to calculate for a discrete marginal histogram fS , where it is a sum of fS log fS over all the boxes. Assessing conditional independence. This is a large topic that is well beyond our scope. An interesting result is presented here without proof: see Christensen, [Chr90, chapter VI]. F 2.5.11. The K-L number is related to the chi-squared distribution by the following approximation: 1 K( f, g) ≈ χ2 ( f, g) 2
(2.5.18)
and if fˆ1 , fˆ2 are two estimates of f with d1 , d2 “degrees of freedom” then 2(K( f, fˆ1 )−K( f, fˆ2 )) follows a χ2 distribution with d2 − d1 degrees of freedom. (d1 and d2 are the ranks of some matrices that define the respective models, and are roughly equal to the number of parameters in each model) 2.6. Non-parametric models Section 1.5 in the introduction chapter gave a rationale for the use of non-parametric models but deferred the question of what, precisely, “non-parametric” means. Recall that some archetypal examples were given. A normal distribution with estimated mean and variance is considered parametric, and a histogram is considered non-parametric, as are all the methods discussed in this chapter. A precise definition is more difficult and a
2.6. NON-PARAMETRIC MODELS
29
matter of some debate. Because there are models with various blends of “parametric” and “non-parametric” features it seems that the classification is in the end somewhat arbitrary. Some heuristic observations may help to clarify the differences, even though none of these as a “definition” completely captures the accepted uses of the term. (The first two are based on Scott [Sco92, chapters 1–2]) (1) Some authors observe that the number of parameters in a non-parametric model is roughly related to the size of the space. Suppose we have n dimensions and a mesh size or histogram bin width of h. Many non-parametric models have on the order of h−n parameters, whereas multi-variate normal density has an order of n2 parameters. The central point of this thesis is to explore some non-parametric models that don’t become exponentially, intractably more complex as the number of dimensions increases, so this is not a very helpful distinction for us. (2) The parameters of a non-parametric model tend to have a local effect or mostly local effect, that is, confined to some ball within the space. In a parametric model they tend to have a global effect, for example the variance of a normal distribution. This seems like a good rule of thumb but there are difficulties. A normal kernel density estimator gives each data point some global influence and is only “mostly” local. This is generally thought to be non-parametric, but is really quite similar to a “parametric” multi-modal normal distribution. (3) Many models can be refined, say to a finer and finer mesh or smaller histogram intervals. As this happens the estimate can converge to the empirical distribution. The ability to converge this way is sometimes considered a key distinction between parametric and non-parametric models. To avoid this convergence and the resulting over-fitting, a non-parametric model needs some form of smoothing, usually including a choice about how far to refine the model. (4) Parametric models tend to make some assumptions about the data, either based on specific knowledge about the problem, or based on experience with the data. The quality of estimate obtained can can be very sensitive to how well the assumed model actually corresponds to the data distribution. Non-parametric models make fewer assumptions, apart from an expectation of some degree of continuity or smoothness. Broadly speaking, parametric models are superior if we can identify them, but in real problems we often cannot. Normal and Poisson distributions in particular seem to arise very commonly in low dimensional problems, perhaps because the basic assumptions are often applicable. That is, many processes are a sum of many similar independent events. This is less true in higher dimensional problems, where well studied parametric distributions are a very small subset of the possible distributions. Another way of saying this is that in real data mining problems (with many dimensions) the actual distribution can be a complex mixture of different effects and we might not be able to find a parametric model at all.
CHAPTER 3
Graph Theory Now that we have introduced the high dimensional density estimation problem, chapter 4 will introduce “graphical models” as a solution. First, we need to introduce some standard definitions and some interesting results that will prove useful. It is not possible to give a full introduction to the subject of graph theory here, but texts such as Bollobás [Bol79] provide a good introduction. D 3.0.1. A graph G is a pair of sets (V, E) where the elements of V are called vertices and the elements of E are tuples of vertices called edges. In this thesis, the graphs considered will be undirected, that is, the tuples are unordered: edges (a, b) and (b, a) are considered to be the same. Multiple edges between a given pair of vertices will not be permitted, nor ‘loop’ edges (a, a) that are of no interest. Only graphs with finite vertex sets will be considered. The graph (∅, ∅) is called the empty graph. A typical depiction of a graph is shown in figure 3.0.1. The small circles represent vertices and the lines represent edges. In this kind of figure no meaning is attached to the positions of the vertices, the exact paths taken by the edge lines, nor any edge line intersections. The only aspects that matter are the set of vertices and presence or absence of edges. � � D 3.0.2. The induced subgraph G A of a set A ⊂ V is A, E ∩ (A × A) , that is, the vertex set is A and the edges are those in G with both ends in A. It will be convenient to talk of � � �� GA ∩ GB , GA∩B = A ∩ B, E ∩ (A ∩ B) × (A ∩ B) D 3.0.3. Two vertices a and b are adjacent, or neighbours, denoted a ∼ b iff (a, b) ∈ E or equivalently (b, a) ∈ E. Two vertices are connected iff there is a path between a and b, that is, a sequence of vertices {vi } such that a ∼ v1 ∼ · · · ∼ v k ∼ b
(3.0.1)
A path will be written like this: [a, v1 , . . . , vk , b] D 3.0.4. The boundary of a set A ⊆ V, bd(A) is the set of vertices adjacent to any element of A in V \ A, and the closure is the disjoint union cl(A) = A ∪ bd(A). If x ∈ V, the set of neighbours bd({x}) may be written bd(x) where this is unambiguous. D 3.0.5. “Being connected” is an equivalence relation among the vertices, and its equivalence classes are called connected subgraphs. If there is only one of these, that is, 31
32
3. GRAPH THEORY
a
d
A chordal graph G
�
�
� �
i�
�
� �
�
�
�
� �
�
�
b
�
h� � �
e
Connected regions: �� � � a b �� �� �� (i) � c d�
c
� �
�f �
��
� e
(ii)
�
g
� �
(iii)
� j i�
�
�
�
� h� � �
�
� f� � �
�
g
�� �
�
j
Note that (i) and (ii) are maximal cliques and (iii) is an example of a tree F 3.0.1. A chordal graph and its connected regions every vertex is connected to every other, then G is said to be connected. Vertices a and b are said to be separated by a set S ⊆ V if a is disconnected from b in G V\S , and S is called an a, b-separator. If no proper subset of S separates a and b then S is a minimal a, b-separator. This does not mean that there are no separators of smaller size, or that S is unique, but only that S itself cannot be further reduced. If two vertices a and b are not adjacent in G, then they are disconnected in G{a,b} . They therefore have a separator: the rest of the graph. So any two non-adjacent vertices have a minimal a, b-separator. D 3.0.6. A graph or subgraph containing all possible edges is complete, and is also called a clique. (The analogy is to vertices as “people”, and edges as “friendship”, so that in a clique everyone knows everyone else). Of special interest are maximal cliques, that is, maximal with respect to vertex set inclusion: a clique subgraph G A is maximal iff no other vertex in G is adjacent to every element of A. Note that the induced graph of any single vertex, where no edges are possible, is always a clique. Any subset of a clique is also a clique so the intersection of a clique with any other subgraph is still a clique. D 3.0.7. A vertex a whose neighbours bd(a) form a complete subgraph is called simplicial. That is, for any vertices b and c each adjacent to a the edge (b, c) is also in the graph. D 3.0.8. A perfect elimination order (PEO) is an ordering of all the vertices v 1 , v2 , . . . vn such that for all j = 1..n − 1, v j is simplicial in G{v j ,v j+1 ,...vn } . Suppose we wished to delete the vertices of the graph one by one, including their incident edges, such that at each stage the neighbours of the vertex to be deleted are all adjacent; such an order of deletion is a PEO.
3.1. CHORDAL GRAPHS
33
The terminology is motivated by a nice connection to Gaussian elimination on symmetric matrices that is beyond the scope of this thesis. E 3.0.9. In figure 3.0.1, one possible PEO is j, i, h, g, f, e, d, c, b, a whereas f, h, i, . . . cannot start one. The non-chordal “square” graph below has no PEO because it has no simplicial vertices to start one from. W�
�Y
X�
�Z
3.1. Chordal Graphs A particular class of graphs will prove to be useful: D 3.1.1. A graph is chordal or triangulated iff every simple cycle of length at least four has a chord. That is, for any sequence of k ≥ 4 distinct vertices [a 1 , . . . ak , a1 ] where a1 ∼ a 2 ∼ · · · ∼ a k ∼ a 1
(3.1.1)
then there are i, j with 1 < i + 1 < j ≤ k such that a i ∼ a j (a chord). A cycle is just a path whose end is adjacent to its beginning as above, and will be called simple if its vertices are all distinct. Chordal graphs have many elegant properties and more equivalent characterisations than can possibly be listed here. The following theorem will hopefully give a flavour for them; it is due to Fulkerton and Gross [1965] and Dirac [1961], with this compact proof taken from a nice book by Golumbic [Gol80, thm 4.1]. T 3.1.2. Let G be an undirected graph. The following statements are equivalent: (i) G is chordal (ii) G has a perfect vertex elimination order, and any simplicial vertex can start a perfect elimination order. (iii) Every minimal vertex separator induces a complete subgraph of G
By “minimal vertex separator” is meant any vertex subset that is a minimal separator for some pair of vertices. P. (iii)⇒(i) Let [a, x, b, y1 , y2 , . . . , yk , a] be a simple cycle of G, k ≥ 1. Any minimal a, b-separator must contain x and yi for some i, so x ∼ yi is a chord of the cycle. (i)⇒(iii) Suppose S is a minimal a, b-separator with G A and GB being the connected components of GV\S containing a and b respectively. Since S is minimal, each x ∈ S is adjacent to some vertex in A and some vertex in B. Therefore, for any pair x, y ∈ S there exist paths [x, a1 , . . . , ar , y] and [y, b1 , . . . , bt , x] where each ai ∈ A and b j ∈ B and these paths are chosen to be of smallest possible length. This comes from the definition of connectedness.
34
3. GRAPH THEORY
Then we have the following simple cycle of length at least 4, which has a chord by the assumption (i): [x, a1 , . . . , ar , y, b1 , . . . , bt , x] But ai / b j as S disconnects them; and ai ∼ a j or bi ∼ b j for j > i + 1 would contradict the minimality of the path lengths. So the only possible chord is (x, y) ∈ E. Before continuing the proof, a lemma needs to be established. L 3.1.3. (Dirac [1961]) Every chordal graph G has a simplicial vertex. If G is not a clique, then it has two non-adjacent simplicial vertices. P. When G is complete the result is trivial. Assume G has two non-adjacent vertices a, b and that the lemma is true for all graphs with fewer vertices than G. Let S be a minimal a, b-separator with a ∈ GA and b ∈ GB the relevant connected components of GV\S . If GA∪S is complete (a clique) then any vertex of A is simplicial. Otherwise, by the induction hypothesis GA∪S has two non-adjacent simplicial vertices, one of which must be in A because S induces a complete subgraph. Any vertex in A can only be adjacent to vertices in A or S, so a member of A that is simplicial in G A∪S has to be simplicial in G. Similarly B contains a simplicial vertex of G. This completes the induction and proves the lemma. � (proof of theorem 3.1.2 continued) (i)⇒(ii) This is true for the empty graph, so proceed by induction on the number of vertices. According to the lemma, if G is triangulated, then it has a simplicial vertex, say x. Since GV\{x} is triangulated and smaller than G, it has, by induction, a perfect elimination order. Inserting x at the beginning of this order forms a PEO for G. (ii)⇒(i) Let C be a simple cycle of G and let x be the vertex of C with the smallest index in some perfect elimination order. Now x is adjacent to at least two distinct vertices of C, and x is simplicial in an eliminated graph that must include those vertices, guaranteeing a chord between them. � 3.2. Trees We pause at this point to introduce a subset of the chordal graphs: D 3.2.1. A tree is a connected graph with no cycles, as in figure 3.0.1(iii). Equivalently, a graph where there is exactly one path between any two different vertices. A forest is a union of trees with disjoint vertex sets; that is, one or more unconnected trees. Between any two vertices of a forest there is either no path or exactly one. A subtree is a connected subgraph of a tree. F 3.2.2. The intersection of two subtrees is again a subtree.
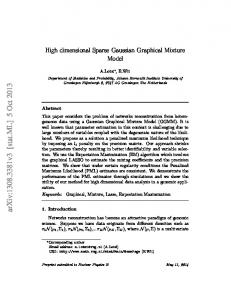
3.3. THE CLIQUE INTERSECTION GRAPH AND THE CLIQUE GRAPH
35
P. Suppose I = (VI , EI ) and J = (V J , E J ) are subtrees of a tree T = (V, E). If V I ∩ V J is empty or a single vertex it is a tree by definition. Otherwise take any two vertices a, b ∈ VI ∩ V J . All vertices in the unique path [a, v 1 , . . . vk , b] between a and b in T must also lie in both VI and V J , and so this path is in their intersection. So the intersection is connected. � 3.3. The Clique Intersection Graph and the Clique Graph Take a given graph G = (V, E), whose clique structure we would like to study. Let Γ G be its set of maximal cliques; it is sufficient to think of it as a set of subsets of V, and set notions like intersection have their natural meaning. Since a vertex set can be anything we like, we will take ΓG as the vertex set of a new graph. Its elements will be denoted A, B etc. to emphasise their set nature, but are still just “dots” in the graph. The simplest way of defining edges might be this: D 3.3.1. The clique intersection graph 1 or clique hypergraph is I(G) = (ΓG , EI(G) ) where (A, B) ∈ EI(G) iff A ∩ B is non-empty, for all pairs A , B in Γ G . This is a useful construction for some purposes, and papers like Jensen and Jensen [JJ94] prove more results about it than can be covered here. It is easy to see that the union of sets in the connected regions of I(G) are exactly the connected regions of G. Recall definition 3.0.5: a set of vertices S separates two other vertices a and b if they are disconnected when that set is removed from the graph. Another way of saying this is that every path between a and b (if any) contains a vertex in S. Every vertex of a clique is adjacent to every other vertex, so for any two cliques A and B either every vertex in A is connected to every vertex in B, or no vertex in A is connected to any vertex in B. So, we can speak of whether two cliques are connected, and say that they are separated by a set S if their restrictions to GV\S are disconnected in that graph. D 3.3.2. The clique graph C(G) of a graph G is (Γ G , EC(G) ) where (A, B) ∈ EC(G) iff A ∩ B separates A and B, for all pairs A , B in Γ G . Since no maximal clique is a subset of another, A ∩ (V \ B) and B ∩ (V \ A) are non-empty and it is sensible to talk about their connectedness in GV\S . If (A, B) is any edge in C(G), by definition A ∩ B separates A and B; but A ∩ B must be contained in any A, B-separator. So each edge of C(G) can be associated with a unique minimal A, B-separator, SAB , A ∩ B (3.3.1) See figure 3.3.1 for a comparison of G, I(G) and C(G). For clarity, all the maximal cliques are triangles. The edge weights and junction trees will be discussed in the next two sections. For any pair of different maximal cliques A and B, one of three conditions holds: 1Some authors use the term clique graph for what is here called the clique intersection graph.
36
3. GRAPH THEORY
(1) A and B are disconnected in G, so their intersection is the empty set, which also separates them according to the definition. Then (A, B) is not an edge in I(G) but is an edge in C(G). These edges are shown in grey in the figure. (2) A ∩ B = ∅ but A and B are connected in G. Then (A, B) is not an edge in either I(G) or C(G). (3) A ∩ B , ∅, so (A, B) is an edge in I(G). It may or may not be an edge in C(G). Certainly any A, B-separator must contain A ∩ B, but there may be paths between A and B not passing through the intersection. Such edges are shown in black in the figure. Both I(G) and C(G) have the same vertices. If the former is connected, C(G) has a subset of its edges. If I(G) is disconnected, C(G) has a subset of its edges, plus all edges between pairs of cliques that are disconnected in I(G). This i 3.4. Junction trees and chordality A third kind of graph on the maximal cliques, called a junction tree, will be extremely helpful. It turns out that only chordal graphs have junction trees. Really, they are the main reason chordal graphs enter into this thesis at all. Here are two equivalent characterisations: D 3.4.1. A junction tree J = (Γ G , EJ ) is a tree on the whole vertex set ΓG where for any x in the original vertex set V, the set of maximal cliques containing x induces a subtree (connected subgraph) of J. P 3.4.2. A tree T = (ΓG , ET ) on the maximal cliques of G is a junction tree if and only if it has the following property: for any two maximal cliques A and B, A ∩ B is a subset of every maximal clique on the path between A and B. P. Given a junction tree J and two maximal cliques A and B, consider the intersection of the subtrees induced by the elements of A ∩ B. By fact 3.2.2 this is itself a subtree, and the unique path between A and B in J must lie in it. So every element of A ∩ B lies in every maximal clique on this path. Conversely, suppose T has the desired property, and take any vertex x in G. For every pair A, B of maximal cliques containing x, A ∩ B containing x lies in every clique on the path between A and B in T. So x induces a connected subtree. � T 3.4.3. (Walter [1972], Gavril [1974a], and Buneman [1974]) A graph G has a junction tree if and only if it is chordal. P. Only the “if” direction will be proved here — the converse is also a standard result, and can be found in Golumbic [Gol80, thm 4.8] where this proof is taken from. We induct on the size of our chordal graph G, since it is trivially true for one and even zero vertex graphs. Assume that all chordal graphs with fewer vertices than G have junction trees. If G is complete then the junction tree is a single vertex and there is nothing to prove.
3.4. JUNCTION TREES AND CHORDALITY
Graph G
g
37
f
c
k
b
a
l j
d h
e
i
Clique Graph C(G)
Clique Intersection Graph I(G) {a,c,g}
{b,c,f} 2
{a,c,d} 2
2
{a,c,g}
{b,c,f}
2
2
{b,c,d}
{a,c,d}
2 {b,c,d}
2
2
2 2
{b,d,h} {a,d,e}
{b,d,h} {a,d,e}
2
2
{d,e,i}
{d,e,i} {j,k,l}
{j,k,l}
2
edge weight |S| weight 0 weight 1 junction tree
F 3.3.1. An example of a chordal graph with its clique intersection graph, clique graph and a junction tree
38
3. GRAPH THEORY
If G is disconnected with connected subgraphs G i then by induction there exists a tree J i for each connected subgraph, and we take the union and for each i connect a point of J i to Ji+1 to form a connected tree. Each x ∈ V induces a subtree in exactly one J i , so this is a junction tree. Finally, suppose that G is connected but not complete. Take a simplicial vertex a of G, by lemma 3.1.3, and let A = cl(a), which is a maximal clique of G. Define U , {u ∈ A : cl(u) ⊂ A}
Y,A\U
(3.4.1)
That is, U contains the vertices of A that have no “outside friends” and Y contains the rest. U, Y, V \ A are all nonempty, because G is connected but not complete. Then the induced subgraph G0 = GV\U is chordal (all subgraphs are chordal) and strictly smaller than G. By the induction assumption G0 has a junction tree J(G0 ) on the set C(G0 ), so that every element of V \ U induces a subtree. There are now two cases: (1) Y is a maximal clique of G0 . But Y ⊂ A so the maximal clique set of G is Γ G = (C(G0 ) \ {Y}) ∪ {A}. We get a junction tree J(G) from J(G 0 ) by renaming the vertex Y, A. To check this, consider whether the subgraphs of J(G) induced by arbitrary vertices y ∈ V are connected. If y ∈ U then the induced subtree is just the vertex A. Otherwise y ∈ V \ U was a vertex of G0 and induces the same connected subtree it induces in J(G0 ) except for the vertex renaming. (2) If Y is not a maximal clique of G0 then all the maximal cliques of G0 are still maximal in G, so ΓG = C(G0 ) ∪ {A}. Select a maximal clique B of G 0 that contains Y. Form J(G) by adding to J(G0 ) a vertex A and an edge (A, B). We now verify that this is a junction tree by looking at induced subtrees. V is the union of three disjoint sets U, Y, V \ A. Vertices u ∈ U induce the single vertex subtree containing A as before. A vertex x ∈ V \ A induces the same connected subtree in both J(G) and J(G 0 ). Finally, y ∈ Y induces the J(G0 ) subtree which includes B, as well as A and the (A, B) edge, and the subgraph so formed is connected. So J(G) is a junction tree. This completes the induction.
�
3.5. Identifying junction trees It is now possible to bring together the previous two sections and understand the full connection between the three graphs we have constructed. First we assign a property called weight to each edge (A, B) of I(G) and C(G), namely the number of vertices in A ∩ B. Alternatively, you can think of the weights as the values of a function from the edge set to the non-negative integers. A natural example of an edge weighted graph is an inter-city road map, where intervals of road have distances marked on them. A spanning tree of a graph H is a tree containing all the vertices and using a subset of the edges. Recall that a tree must be connected and cannot have cycles, so by a simple induction a spanning tree has exactly one edge less than the number of vertices. A maximum weight spanning tree
3.5. IDENTIFYING JUNCTION TREES
39
H 12 4
5 3 5
6
7
8
5 5
2
1
5
6
9 6
edge weight m.w.s.t. edge
F 3.5.1. A weighted graph with a maximum weight spanning tree (m.w.s.t.) is a spanning tree where the sum of the weights of the tree edges is maximal over all spanning trees (see figure 3.5.1). That is, such a tree uses a subset of the edges of H that contains as much total weight as possible while still forming a spanning tree. Algorithms for constructing such maximal trees are well studied, especially Prim’s and Kruskal’s algorithms. The former will help prove the next theorem. T 3.5.1. (Shibata [1988] and Jensen [1988]) The junction trees of a connected chordal graph are exactly the maximum weighted spanning trees of the clique intersection graph. This is also true for disconnected graphs if all the missing edges of the intersection graph are added with weight zero. P. Jensen and Jensen’s proof [JJ94] will be presented, as it is shorter than Shibata’s [Shi88]. Take a connected chordal graph G with m = |Γ G | maximal cliques and perform Prim’s algorithm on its clique intersection graph I(G): (1) Set N1 = {A1 } where A1 is an arbitrary node in ΓG (2) For k = 1, 2, . . . m − 1, choose a link (A, B) from E I(G) of largest weight such that A ∈ Nk and B < Nk , and add B to Nk to get Nk+1 . Prim’s algorithm constructs a sequence T 1 ⊂ T2 · · · ⊂ Tm of maximal spanning trees for the subgraphs induced by Nk . This always constructs a maximum weight spanning tree provided I(G) is connected, which is exactly when G is connected. It is also capable of constructing all possible maximal trees. Proofs can be found in standard algorithms texts, such as Sedgewick [Sed98]. Suppose Tm was a spanning tree of maximal weight that was not a junction� tree for � G. Theorem 3.4.3 tells us there is a junction tree, so the single vertex tree T 1 = {A1 }, ∅ can certainly be extended to one. Then there is a maximum k such that T k can be extended to form a junction tree, say J, but Tk+1 cannot. Let (A, B) be the edge added at this stage, which cannot be an edge in J. The is a path between A and B in J must contain a link (U, V) such that U ∈ Tk and V < Tk . By corollary 3.4.2, S = A ∩ B must be a subset of U ∩ V, but Prim’s algorithm chose (A, B) so |S| ≥ |U ∩ V|. So S = U ∩ V.
40
3. GRAPH THEORY
Remove the link (U, V) from J to form two subtrees J A˜ containing A and JB˜ containing B. Then insert (A, B) to form J 0 , a spanning tree extending Tk+1 . Any vertex in V \ S induces a subtree of J entirely in one of the two subtrees, and hence induces a subtree of J 0 . But x ∈ S also induces a subtree of J that contains both A and B. If it is disconnected by removing (U, V) it will be reconnected by adding (A, B). So J 0 is a junction tree, in contradiction to the assumption, and T m must be a junction tree after all. Conversely, suppose we have already chosen the starting vertex A 1 , and there was a spanning tree T 0 that could not be constructed by Prim’s algorithm with an appropriate choice of edges. Construct trees T1 ⊂ T2 · · · as before, choosing a link from T 0 wherever possible in step 2 above. Let Tk ⊂ Tk+1 be the first step where this is not possible and let (A, B) be the link actually chosen at this step. In T 0 there is a unique path between A and B, and as before it must contain a link (U, V) with U in T k but V < Tk . Since we couldn’t choose this edge, |U ∩ V| < |A ∩ B|, so there is some x in A ∩ B that is not in U ∩ V. But then T0 cannot be a junction tree. If G is disconnected then Prim’s algorithm runs out of edges after spanning the connected region it starts in. When this happens, starting it again in a new region and taking the union of connected subgraph trees eventually gives a maximal weight spanning forest. By adding all missing edges with weight zero, it is able to jump to a new connected region without needing special treatment in the algorithm, and automatically join the forest into a tree. The weight zero edges will never be chosen while there is any other choice, so they do not affect maximality. � Actually, you only need to add zero-weight edges between pairs of disconnected vertices in I(G). Recall that the clique graph C(G) has these edges anyway, and their weight is zero. That is, the clique graph naturally bridges disconnected components of G. On the other hand, the clique graph of a connected graph or subgraph G has no edges of weight zero since the empty set is never a separator. T 3.5.2. (Galinier et al. 1995 [GHP95]) If J is any junction tree of a chordal graph G, not necessarily connected, then every edge of J is an edge of the clique graph C(G). So J is a junction tree if and only if it is a maximum weight spanning tree of the clique graph C(G). P. Take any edge (A, B) of J. It is necessary to prove that S = A ∩ B separates the non-empty sets A \ B and B \ A. Take a and b from these respectively. Let J A˜ and JB˜ be the two subtrees of J containing A and B respectively after the edge (A, B) is removed. If S was not an a, b-separator, there would be a path from a to b in G not passing through S. A vertex not in S induces a subtree of J that cannot include both A and B, so it is either a subset of JA˜ or JB˜ . Consider the first edge of this path connecting an A-tree vertex with a B-tree vertex. Every edge lies in at least one maximal clique; without loss of generality, suppose it lies in a vertex of JA˜ . But then the subtree of cliques containing its B-tree vertex also contains this vertex, which is impossible in a junction tree. So any junction tree uses only edges from C(G) and is therefore a spanning tree of the clique graph.
3.5. IDENTIFYING JUNCTION TREES
41
Consider a connected graph G. The edges of C(G) are a subset of the edges of I(G), and for those that remain the weights are the same. So any spanning tree of C(G) is a spanning tree of I(G) with the same total weight. Thus the total weight of a m.w.s.t. of I(G) is at least as large as any possible m.w.s.t. of C(G). The argument just made shows that all of the former are also spanning trees of the latter, so they are maximum weight spanning trees and that maximum weight is the same. Conversely, if there was a m.w.s.t. of C(G) it must also be a spanning tree of I(G) with maximum possible weight there, so it is a junction tree by theorem 3.5.1. If G is disconnected, apply the previous paragraph to each of the connected components I1 , I2 , . . . Ik of I(G) and note that the C(G) edges between different I j have empty clique intersection and therefore zero weight. So the C(G) spanning trees and the ways of joining the I(G) spanning forest with zero weight edges all form m.w.s. trees of the same weight. Any x ∈ V induces a subtree of exactly one of the I j so any way of joining them up produces a junction tree. � C 3.5.3. The clique graph of a chordal graph is connected. L 3.5.4. (Galinier et al. 1995) Given a chordal graph G and its clique graph C(G), every edge of C(G) forms part of at least one junction tree. P. We know G has a junction tree. Let (C 1 , Ck ) be an edge in C(G) and suppose there were a junction tree J not containing (A, B). Let [C 1 , C2 , . . . Ck ] be the path between A and B in J. By proposition 3.4.2 S = C1 ∩ Ck is contained in every Ci . If none of the edge separators equal S we can choose xi from the non-empty set Ci ∩ Ci+1 \ S for i = 1.. k − 1. Then [x1 , . . . xk−1 ] is a path connecting C1 and Ck without going through their intersection. But this violates the condition for (C 1 , Ck ) to be an edge in C(G) in the first place. So Ci ∩ Ci+1 = S for some 1 ≤ i < k, and we can remove (C i , Ci+1 ) from J and replace it with (A, B). This gives a spanning tree of the same weight, that is, maximal weight, and hence a junction tree2. � Conclusion. The interesting thing is that, leaving aside some fiddling in joining up connected regions, a junction tree is a spanning tree of both the clique intersection graph and clique graph. Also, any edge of a clique graph can be part of a junction tree. So, the clique graph is really the union of all possible junction trees, that is, maximum weight spanning trees of I(G), whereas the extra edges in the I(G) aren’t ever used. Also, the clique graph’s empty separator edges allow Prim’s algorithm to find a junction tree in a natural way without having to make a special case of disconnected graphs. From here on, only the clique graph and junction trees will be of interest. It is possible to derive these results for the clique graph without considering the intersection graph, as Galinier and Habib do3. One difficulty is that the connectness of the clique graph needs to 2This is based on their proof of a related result, as the original proof used lemmas not presented here. 3As this was a difficult paper to follow, I am not even sure whether the connectedness of C(G) is proved as a
side-effect or assumed along the way.
42
3. GRAPH THEORY
be proven, which must somehow bring in the chordality of G. Besides, this presentation tours the development of these theorems in roughly chronological order and has some nice results along the way. 3.6. Implementation Notes This author implemented graph operations in Python by writing Graph and Edge classes in the module gdgraph.py. Vertices do not have their own class, and can be any type that Python can use as a dictionary key, although normally they were just integers. The internal representation was a list per vertex of the edges containing that vertex. Weights were added to edges by setting the property edge.weight before calling the implementation of Prim’s algorithm. An array of objects of class CliqueInfo, defined in forwsel.py, stored details of cliques and labelled them with integers. Elementary set operations were implemented in the utility module setops.py, which requires Python version 2.0 or higher. The interesting, free kjbuckets extension was not used, but it provides an efficient and fast “set” type via a C language extension. The performance improvement might be beneficial if large graphs were to be used. Their sets can also be used as dictionary keys, unlike Python’s built-in lists, so in theory one really could use the clique vertex sets as hypergraph vertices.
CHAPTER 4
Graphical Models We are interested in probability distributions of N interrelated random variables, because we would like one that accurately models our data. If we considered the complete range of N dimensional joint distributions we would quickly despair, as described in previous chapters. There can never be enough data to choose from such a large space of models, and we also need some sort of smoothing. Fortunately, experience in a wide class of problems indicates that variables seldom interact in an arbitrary way with all other variables. Instead, a variable might closely interact with just a few others, and affect with the rest indirectly if at all. The use of graph theory to describe models of relationships leads to the term “graphical models”. The models here are more precisely called Markov networks. The concept of “conditional independence” is the key tool here. Suppose X, Y and Z are random variables, with probability densities fXYZ (x, y, z) fZ (z) = fXZ (x, z) fYZ (y, z)
(4.0.1)
for all x, y, z. (This notation for the marginal densities was defined in 2.2.2) Then we say that X and Y are conditionally independent given Z, and we write this as X y Y | Z. If Z = z has non-zero density, and recalling that f XY|Z (x, y | z) ≡ fXYZ (x, y, z)/ fZ (z), this condition becomes fXY|Z (x, y | z) = fX|Z (x | z) fY|Z (y | z) (4.0.2) That is, if we know the value z taken by Z, then the conditional distributions of X and Y are independent. This can be defined in a more generally with sets of random variables instead: D 4.0.1. Let A = {A1 , . . . Ak }, B = {B1 , . . . Bl } and C = {C1 , . . . Cn } be sets of random variables. Then A and B are conditionally independent given C, denoted A y B|C
(4.0.3)
if and only if, for all tuples (xA , xB , xC ) , (a1 . . . , ak , b1 , . . . , bl , c1 , . . . , cn ), fA S B S C (xA , xB , xC ) fC (xC ) = fA S C (xA , xC ) fB S C (xB , xC )
(4.0.4)
fA S B | C = f A | C fB | C
(4.0.5)
or equivalently
If we know the value of all the variables in C, the elements of A are independent of any of the elements of B. 43
44
4. GRAPHICAL MODELS
Conditional independence is useful because it expresses a density on a higher dimensional space A ∪ B ∪ C in terms of densities on lower dimensional spaces. The following sections will consider how the conditional independence structure of a model may be described using graphs, and turned into a combination of low-dimensional marginal densities. The notation and many of the results are from a book on Graphical Models by Lauritzen [Lau96]. A philosophical comment. Like the usual probabilistic notion of “independence” mentioned in section 2.1, conditional independence is an assumption we make about the distribution. If we use an estimate fˆ instead of f we will never have exact equality in (4.0.4) due to the presence of noise. It is possible to perform statistical tests to check whether any given conditional independence is a reasonable hypothesis about the data. The theory of such testing is beyond our scope, but is discussed in the context of graphical models Whittaker [Whi90]. Instead we will adopt a pragmatic approach. If the assumption of conditional independence gives a density estimate that “works well”, in whatever application we have at hand, then it is a useful assumption. How to choose a model (a collection of such assumptions) will be the subject of the next chapter. For now, let us consider how graph theory can help us describe conditional independence models. 4.1. Markov networks Let V = {Xi } be a collection of random variables with some distribution, and G = (V, E) a graph with those variables as vertices. N 4.1.1. In chapter 3 vertices of G were written in lower case (eg. a, b . . .) and sets of vertices as A, B, C. As they are now random variables they will be written in the notation of chapter 2, with capital letters (eg. X 1 , X2 , Y, Z). Sets of such variables are written in bold as A, B. For example, where the previous chapter denoted a clique as C = {a, b, e} we now write C = {A, B, E}. Conditional independence properties. Recall definition 3.0.4: the boundary of a set A ⊆ V, bd(A) is the set of vertices adjacent to any element of A in V \ A, and the closure is the disjoint union cl(A) , A ∪ bd(A). Lauritzen [Lau96, ch 3] lists three Markov properties on undirected graphical models: (P)
(L)
The pairwise Markov property holds if for every pair of vertices (X, Y) ∈ V not adjacent in G, X y Y | V \ {X, Y} (4.1.1) The local Markov property holds if whenever X ∈ V , X y V \ cl(X) | bd(X)
(4.1.2)
4.1. MARKOV NETWORKS
(G)
45
The global Markov property holds if for any triple (A, B, S) of disjoint subsets of V such that S separates A from B in G A y B|S
D 4.1.2. A Markov network is an undirected graph G = (V, E) and a probability distribution F(x1 , . . . xd ) whose vertex set consists of random variables such that V = {X1 , X2 , . . . XN }
(4.1.3)
Pr{X1 ≤ x1 , . . . Xd ≤ xd } = F(x1 , x2 , . . . xN )
(4.1.4)
and F satisfies property (P) with respect to G. There are two ways of looking at this. Firstly, we can think of the graph as a property of the distribution, where the presence or absence of edges codifies the conditional independences. For example, only a distribution where all the variables are independent can have a graph without edges. The graph is not unique; if nothing else, the complete graph trivially satisfies (P) for any distribution. The second perspective starts with the graph and sees it as defining a class of distributions for which (P) is true. The empty graph has the most restricted class, and the complete graph imposes no restriction. Adding an edge to a graph generally expands the set of possible distributions modelled. Given some data, we assume there is a distribution F with a density f , so we could certainly talk about graphs G that satisfy a particular Markov property, and the first view makes more sense. We don’t normally know f but we could check the properties by statistical testing. This is much easier for (P) than for (L) or (G) since only pairwise tests are required. In the next chapter we will take a different approach and construct a sequence of graphs by adding one edge at a time. These graphs will not necessarily have property (P) with respect to f , but we will choose an estimate fˆ from the class of distributions that do. That is, the edge set specifies a form of smoothing for the estimate fˆ. We could regard G as a descriptive property of fˆ, but the converse seems more natural in this case. The random variables in the vertex set can each be either continuous or discrete, as previously described in section .2.1. Usually a tractable discrete variable set is “small”, for example less than 20 elements, although larger sets could be dealt with. Technically the space of numbers representable using machine floating-point or fixed bit-width machine integers is also finite, but this does not qualify. Discrete variables are also called categorical, since the value set is often qualitative differences like {male, female} or {green, brown, yellow}. They can also arise from binning of numerical variables with more underlying values, like “age” into bins {0–10, 10–20, . . . 80–}. As a convenience, from here on the vertices will be represented in diagrams by the symbols: � �
‘Circle’ for continuous variables ‘Dot’ for discrete variables
46
4. GRAPHICAL MODELS
T 1. Which edges in the car example have the Markov property? Variables
Conditionally independent?
(A, K) given M = m, C = c No, an older car is likely to have driven further, even if they have the same model and colour. (A, C) given K = k, M = m No, some colours were once more fashionable (A, M) given K = k, C = c No, certain models were only built in certain years (M, K) given C = c, A = a No, as larger cars might take longer journeys (M, C) given K = k, A = a No, as certain models only come in some colours (C, K) given M = m, A = a Yes, C y K | M, A E 4.1.3. An imaginary example will serve. Suppose we observe a police roadworthiness blockade on a particular afternoon, and record the following properties: � A Age of car � M Make and model � K Kilometers on odometer � C Colour of car We could certainly estimate a density for each of these variables separately, and assuming that we have a sufficiently good sample, answer questions like “what is the probability that the next car will be a Ford?”. The four vertex graph without edges represents a model where these variables are independent. Then the answer to “if the next car is pink, what is the probability it is a Cadillac?”, Pr{Cadillac|pink} is the same as Pr{Cadillac}, and ignores any possible relationship. More obviously, we would expect there to be a strong statistical relationship between the age of the car and its odometer reading. Which edges must the graph have to satisfy property (P)? To answer this, we take the vertices in pairs (X, Y) and ask whether they are conditionally independent given the rest of the graph. Typically the statistical evaluation of independence precedes explanations, but this is a thought experiment, and the results are shown in Table 1. An interesting question is: do owners of red cars drive further than owners of blue cars, all other things being equal? “All other things” being M, the type of car, and A, its age. In other words, if I tell you the model and age, does knowing the colour tell you anything about the odometer reading K, or vice versa? Suppose we take the answer to be yes. Then a graph with Markov property (P) for this problem is
� � K =kms ��
=model � M �� � � � � C =colour � �� � � A =age
Because of the table, we cannot have fewer edges than this. (P) applies only between K and C, which are conditionally independent. This has been quite a small example but it shows that, for the Markov properties to hold, variables that are closely related need to have edges joining them. Variables that have some conditional independence are apparent because of the absence of an edge joining them.
4.2. RELATIONSHIPS BETWEEN THE MARKOV PROPERTIES
47
4.2. Relationships between the Markov properties It is slightly surprising that the three properties just defined, and a fourth we will see in a moment, are not necessarily equivalent. It is worth exploring this further as it exposes some things that could go wrong with our models. Firstly, we observe that the properties are increasing in strength, then that they are equivalent for strictly positive densities, and finally that everything is much nicer for chordal graphs. P 4.2.1. For any undirected graph G and any probability distribution F it holds that (G) =⇒ (L) =⇒ (P)
(4.2.1)
P. (G) implies (L) because bd(X) separates X from V \ cl(X). Now, without taking time to define formal rules for manipulating y constructs, this will involve some handwaving. Assume (L), and take any X Y ∈ V not adjacent in G, so Y < cl(X). We can safely “add information” to the right hand side: if E ⊂ V A y B|C ⇒ A y B|C ∪E and
bd(X) = cl(X) \ {X} ⊂ V \ {X, Y}
so X y V \ cl(X) | V \ {X, Y} and (P) follows from Y ∈ V \ cl(X).
�
To see that the converse is not necessarily true, consider these two examples: E 4.2.2. Let U, W, X, Y, Z be binary random variables with Pr(U = 1) = Pr(Z = 1) = Pr(U = 0) = Pr(Z = 0) = 1/2 as well as W = U, Y = Z and X = WY. The joint distribution satisfies (L) but not (G) for the graph below, as given X, U and Z are not independent. � U
� W
� X
� Y
� Z
E 4.2.3. Now take three binary random variables X = Y = Z with Pr(X = 0) = Pr(X = 1) = 1/2. This satisfies (P) but not (L) for this graph: � X
� Y
� Z
A common feature of these counter-examples is that there is a non-trivial logical relationship between variables, such as Y = Z. Another way of saying this is that the probability (density) of Y , Z is zero. This matters if we build our models by edge testing for property (P), as in the car example above. In general, if we have zeroes in our densities we cannot rely on (G), which we will need to build the actual models.
48
4. GRAPHICAL MODELS
The factorisation property. What we would like to do is make density functions out of lower dimensional densities. D 4.2.4. Consider a graph G with probability density function f : V → [0, inf). The probability measure producing f is said to factorise with respect to G if for all complete subsets of A of V (all cliques) there exist non-negative functions ψ A : V → [0, inf) depending only on the variables in A, and such that
f (x) =
(F)
Y
ψA (x)
(4.2.2)
A complete
Call this property (F). It is sufficient to assume the A are maximal cliques, although this may not be a very practical simplification. F 4.2.5. A y B | S ⇔ fA∪B∪S (a, b, s) = h(a, s)k(b, s) for some non-negative functions h, k and all possible values a of A, b of B, and s of S. P. If we have conditional independence, let h = f A∪S and k(b, s) = fB∪S (b, s)/ fS (s) with k(·, s) = 0 if fS (s) = 0. This follows from the definition in equation (4.0.4). Conversely, suppose we have R h and k satisfying Rthe equality. Let f = f A∪B∪S for clarity. ¯ ¯ = k(a, s) da. Then the projections of f are Take the projections h(s) = h(a, s) da and k(s) just Z ¯ fA∪S (a, s) = f (a, b, s) db = h(a, s)k(s) (4.2.3) Z ¯ fB∪S (b, s) = f (a, b, s) da = h(s)k(b, s) (4.2.4) " ¯ k(s) ¯ fS (s) = f (a, b, s) da db = h(s) (4.2.5) �
so f (a, b, s) fS (s) = fA∪S (a, s) fB∪S (b, s) as required. P 4.2.6. For any undirected graph G and any probability distribution F it holds that (F) =⇒ (G) =⇒ (L) =⇒ (P)
(4.2.6)
P. We only need to show (F) implies (G) because of the earlier result. Let A, B and ˜ be the connected region S be disjoint subsets of V such that S separates A and B. Let A ˜ ∪ S or V \ A. ˜ Then (F) containing A in GV\S , so any clique is a subset of at least one of A gives Y Y Y f (x) = ψA (x) = ψA (x) ψA (x) = h(xA∪S )k(xV\A˜ ) ˜ A∈C(G)
A∈C(GA∪S ) ˜
B∈C(GV\A˜ )
˜ y V \ (A ˜ ∪ S) | S. Dropping some variables on the left gives From the fact above, A A y B | S. �
4.3. CHORDAL GRAPHS
49
There is a construction due to Moussouris (1974) on the “square” graph below of a probability distribution having the global Markov property (G) that does not factorise (F). See Lauritzen, example 3.10. W�
�Y
X�
�Z
This is an important point: we would like to be able to factorise, but a general Markov network has probability distributions that cannot be factorised, even if we assume the global Markov property. These tend to arise from strong logical connections between variables like W = XY, as illustrated by the two counterexamples in the previous section. In fact, if the density f is continuous and strictly positive, (P) implies (F) and all four properties are equivalent. Lauritzen suggests that the continuity condition can probably be relaxed somewhat but does not elaborate. There is also a practical problem: on a nonchordal graph like the square, there is no easy algorithm for estimating f . The Iterated Proportional Fitting algorithm does deal with this case, but will not be discussed here. 4.3. Chordal graphs Fortunately, the situation with chordal graphs is much more tractable. First a lemma, then the important result: the distribution on a chordal graph always factorises! L 4.3.1. Let (A, B, S) be a partition of the vertices of a graph G such that S separates A and B, and � � � � f (x) fS (x) = fA∪S xA∪S fB∪S xB∪S (4.3.1) that is, the two pieces are conditionally independent: A y B | S. Then the probability distribution F factorises with respect to the graph G if and only if both its marginal distributions F A∪S and FB∪S factorise with respect to GA∪S and GB∪S respectively. P. Only the “if” direction will be proved, but the converse just requires noting that all cliques are subsets of either A ∪ S or B ∪ S, using the definition of (F) in equation (4.2.2), and integrating out the variables that are not required. 1 fS (xS ) Let ψS (xS ) , 0
if fS (xS ) , 0 otherwise
(4.3.2)
Since fS can be found from the non-negative function f by integrating out all the variables not in S, f must be zero almost everywhere that f S is. So � � � � � � f˜(x) = fA∪S xA∪S fB∪S xB∪S ψS xS (4.3.3) is equal to f almost everywhere, and hence F factorises.
�
50
4. GRAPHICAL MODELS
At this point we will depart from Lauritzen’s proofs and instead use some of the machinery from the previous chapter to prove the main result. T 4.3.2. Let G be a chordal graph, and F a distribution on its vertex set V with the global Markov property. Let J = (ΓG , EJ ) be a junction tree for G, and let γG = {A ∩ B : (A, B) ∈ EJ } be the list of edge separators (they can appear multiple times, that is, γ G is a set with multiplicity). Then F factorises in terms of the marginal densities on the junction tree vertices and edge separators: f (x) × or using the functions from (4.3.2), f (x) =
Y
� � Y � � fS xS = fC xC
(4.3.4)
Y � � � � ψS xS fC xCC ×
(4.3.5)
S∈γG
Y
C∈ΓG
C∈ΓG
S∈γG
(This is a log-linear combination of the type described in section 2.5) Moreover, this factorisation is independent of the junction tree chosen, hence the notation γ G rather than γJ . P. Induct on the number of cliques in G. The result is trivial for a single clique, that is, a complete graph. Assume it is true for graphs with fewer than M maximal cliques, and take G with M maximal cliques. Pick a “leaf vertex” A from J with a single incident edge (A, B), which every tree has. Let S = A ∩ B. This is also an edge of the clique graph by theorem 3.5.2 so S separates A and B, and the global Markov property means that equation (4.3.1) applies. Now A ∪ S = A is a single clique so f A∪S is already factorised. The junction tree property, theorem 3.4.3, means that elements of A \ S can only lie in the clique A. But GB∪S = GV\(A\SS) , that is, it just has the simplicial vertices deleted from a single maximal clique A. So if we just delete A from the junction tree, J C(G)\{A} is a junction tree for GB∪S . Since this has M − 1 maximal cliques, by assumption f B∪S factorises and has the maximal cliques and separators we expect. Combining (4.3.3) with (4.3.5) shows that F factorises over G. Suppose that we took a different junction tree J 0 , with a list of separators γ0 . It has the same maximal cliques ΓG so the right hand side of (4.3.4) must be the same. Consider any set U ⊆ V of vertices of G. Each element of U induces a subtree in J and a subtree in J 0 . Let T ⊆ J be the intersection of the former, and T 0 ⊆ J 0 the intersection of the latter, each a (possibly empty) subtree. The vertices of such a tree are exactly the maximal cliques containing U, so both T and T 0 have the same vertices, and hence the same number of edges. The edges (A, B) ∈ J with U ⊆ A ∩ B are exactly the edges of T, so the number of such edges is the number of separators containing U in γ G , and must equal the number of separators containing U in γ0 . Since this is true for every set U, we must have the same separators with the same multiplicities in γ G and γ0 (suppose the existence of a largest set U that has different multiplicity, and get a contradiction). �
4.5. MIXED DISCRETE AND CONTINUOUS VARIABLE MODELS
51
4.4. Zero density We see that if the marginal densities in the denominator of this model are strictly positive, everything works well; and if they are zero, all densities on larger variable sets are zero almost everywhere, and things still work. If no purple cars were seen, the fact that Pr{purple} = 0 doesn’t matter because Pr{purple|Cadillac} = Pr{purple|Ford} = 0 as well. The practical difficulty is that our data is limited, and if a purple Ford were to turn up in the test data but not the training data it would prove that its probability was small but positive. It is important not to divide by zero in this case, hence (4.3.2), which will just keep telling us that we saw an event of probability zero. Another problem occurs when fˆC = 0 somewhere that fC > 0, for some maximal clique C. This means f 3 fˆ: the real density will not be absolutely continuous with respect to the estimate. This will give us an infinite K-L number, related to the fact that any integral against the measure Fˆ does not tell us everything about F. To put it another way, until we see a purple car, we cannot really say anything about them. If purple cars are possible, then in some sense an estimate that gives them probability zero is qualitatively missing information, rather than merely having a relative error in the probability estimate. To put it a third way, it is difficult in a non-parametric model to tell the difference between a structural zero, that is, an impossible event, and something we just haven’t seen yet. A model-T Ford manufactured in 2002 is a structural zero of our car model, whereas a purple model-T merely has extremely small probability. Unfortunately, there is a great theoretical difference between the two kinds of zeroes. 4.5. Mixed discrete and continuous variable models Graphical models for discrete and continuous variables have developed from two opposite directions. Models for just discrete variables alone have been based upon the estimation of contingency tables in Bayesian networks. The presentation so far is largely inspired by this approach. Continuous variables have been studied using parametric statistics combined with log-linear or additive models. The two disciplines use different terminology, different estimators and have different goals. This makes the task of modelling mixed types a bit tricky. Lauritzen (1994) combines the two approaches to present a unified theory of graphical models for both continuous and discrete variables 1. The extra conditions required of the graph in this case are briefly discussed in the following subsections. In this approach continuous variables are modelled parametrically using covariance selection models, estimating a multivariate normal distribution N(ξ, K). Here ξ is a mean vector and K is a concentration matrix where row j and column j correspond to X j . Its diagonal 1His treatment unfortunately requires the assimilation of three different terminologies and modelling
strategies. This can make it difficult to understand how the different techniques relate to one another.
52
4. GRAPHICAL MODELS
describes the variances of variables and non-diagonal elements describe the pairwise interactions between variables. The maximum likelihood estimate of this matrix is estimated using more matrix algebra than we have space for, and the resulting parametric model can be applied to quite high dimensional spaces. Continuous variable maximal cliques correspond to the block structure of K. This framework makes possible rigorous statistical tests for conditional independence and the Markov property (P). This motivates a backward selection algorithm where one starts with a complete graph and successively remove edges that are not required. There is an impressive body of theory accompanying this fitting, as is common when dealing with parametric models, but it is not really the kind of approach we are interested in. Strong Decomposability. Lauritzen describes two properties of graphical models called strong and weak decomposability. Weak decomposability allows us to break the model down into products of cliques as in theorem 4.3.2, and turns out to be equivalent to having a chordal graph. (Only the chordal =⇒ (F) direction was proven). We have already investigated this property. A strongly decomposable graphical model has the additional restriction that there can be no path between two non-adjacent discrete vertices consisting only of continuous vertices:
�
...... .... ..... ...... .... ..... ....
�
Like chordality, strong decomposability has several elegant equivalent formulations that cannot all be treated in this space. Perhaps the most helpful is the starred graph formulation. D 4.5.1. Let G = ( ∪ � , E) be a graph whose vertices are partitioned into discrete variables � and continuous variables . The starred graph G ? is obtained by adding a vertex ? and joining it to all the discrete variables. T 4.5.2. (Leimer [1989]) A graphical model with graph G is strongly decomposable if and only if G? is chordal. P. Take any two non-adjacent vertices W, X ∈ � . If G ? is chordal then G is certainly chordal. Also, the minimal W, X-separator S is complete according to theorem 3.1.2 and must contain ?. So S ⊂ � and any path between W and X contains a discrete vertex. Conversely, if G is chordal and strongly decomposable, a chordless cycle of length greater than 3 in G? would have to contain ? and the rest of the cycle would be a forbidden path as above. � Now take a strongly decomposable model’s graph G. Theorem 3.1.2 showed that chordal graphs are those that have a perfect elimination order (PEO). In fact, for any vertex Y, a chordal graph has a PEO that eliminates Y last. (This is a simple consequence of the maximum cardinality search algorithm for finding PEOs, and may be found in Golumbic [Gol80]). Take a PEO for G? that eliminates ? last. Then the remainder is a PEO for G
4.5. MIXED DISCRETE AND CONTINUOUS VARIABLE MODELS
53
that deletes all the discrete vertices after all the continuous vertices. The existence of such a PEO is equivalent to strong decomposability. Also notice that the maximal cliques of G ? containing ? are entirely discrete, and induce a connected subtree of J ? . It is easy to show that the discrete variables � are entirely contained in the graph closure of this “core”, which is then surrounded by purely continuous subtrees. The PEO result just says we can pick these off around the outside before we eliminate � . Here is an example of a strongly decomposable graph:
�
� �
Conditioning on discrete variables. Consider the strongly decomposable model
�
Y1
X
Y2
where X is discrete and Y1 , Y2 are continuous. For each of the finitely many possible values of X we could condition on X and obtain a continuous density estimate of each Y i . fˆ(y1 , x, y2 ) = fˆ(x) fˆ(y1 |x) fˆ(y2 |x)
(4.5.1)
That is, by conditioning on the discrete “core”, we can simplify the problem of mixed discrete and continuous marginals. It may not be necessary to use all the discrete variables — only those in the relevant maximal cliques of mixed type. This techniques works for all strongly decomposable models. Now consider the model
�
�
X1
Y
X2
where X1 , X2 are discrete and Y is continuous. This is only a weakly decomposable model, � and we cannot condition on a core in this case. To condition on the joint space X 1 X2 would implicitly add an edge (X1 , X2 ) and give us strong decomposability. Instead, we would need an estimate of the marginal f X1 Y on the � edge, of fYX2 on �, and of fY by itself. A problem arises when trying to make optimal parametric estimates using factorisations based on graph separator (see proposition 4.3.1). When the graph is strongly decomposable everything works nicely and we get expressions like (4.5.1) over the junction tree cliques and separators. In the weak case we have a junction tree, but the marginal estimates may not be the maximum likelihood models you might expect 2. 2What exactly goes wrong without strong decomposability is not clear to me, and would require further
research. The idea of a “core” of discrete variables based on the junction tree is my own synthesis of what appears to be happening, and is not the way it is presented by Lauritzen. All the other characterisations are taken from his book.
54
4. GRAPHICAL MODELS
Application to non-parametric models. All of the above begs the question: if we use a non-parametric estimator for mixed variable marginals, do we need to ensure strong decomposability? After all, we don’t really have any maximum likelihood optimality results to preserve. The answer to that question has proved to be beyond the scope of this thesis. We will see in the next chapter that the graph fitting algorithm can easily be modified to produce strongly decomposable graphs, if that is required.
CHAPTER 5
The Forward Selection Algorithm The trick with graphical models, of course, is to select a model that simplifies the problem enough and provides enough smoothing so that the resulting estimate is useful. How are we to determine such a model, that is, determine a graph? The number of chordal graphs with n vertices is enormous even for 6 or 7 vertex graphs, let alone 20 or 100 vertices. We cannot just enumerate them all and evaluate them against our data. One common way of producing graphs is by backward selection, where we start with a complete graph and successively remove edges. Here we are interested in the opposite approach, forward selection, where we will start with no edges in our graph and add them one by one. In the previous chapter, we found that chordal graphs gave models that decompose into convenient expressions in terms of marginal densities, and so we will restrict ourselves to the choosing a chordal graph. It will be easier to evaluate our progress if at every step the graph remains chordal. Also, graphs with fewer edges are easier to estimate densities for than graphs with many edges. Broadly speaking, adding edges reduces the smoothing, and with many dimensions we want to stop before we throw away too much smoothing. This is essentially why we are choosing to go forwards. Actually, the density estimation method used here in conjunction with forward selection breaks down if the clique sizes are too large and could not be used with backward selection at all. It is possible to perform forward selection by “brute force”: at each stage, enumerate the edges that could be added to the graph. Use one of the standard but computationally expensive techniques to test whether the new graph is chordal. Then, determine the junction tree using another standard and time-consuming algorithm. This is feasible, especially when the graph has very few edges, but is inefficient and not as easy as it sounds. In a paper published in 2001, Deshpande, Garofalakis and Jordan [DGJ01] describe an elegant way to update both the clique graph and the list of eligible edges along with the graph itself. This keeps all three data structures synchronised, and is quite efficient. This chapter will work through both a proof and an implementation of that algorithm. The proof is based on theirs, but the implementation was written for this fourth year project solely from the published paper, as Bell Labs policy did not permit the release of code. The central code written for this algorithm is listed in an appendix. We will begin by describing 55
56
5. THE FORWARD SELECTION ALGORITHM
the original algorithm as implemented from the paper, and then present the changes made to include constant functions. N 5.0.3. In this chapter the graph structure will be more important than the statistical interpretation. Therefore we will revert to the notation of chapter 3, where G has vertex set V = {a, b . . . } and sets of vertices are written as A, B. It is understood that the vertices are random variables, but it is more important here to think of them as vertices. The Python code stores the vertices a, b as integers standing in for random variables X a , Xb and sampled by columns a and b of the sample data. The reader may find this a useful interpretation as well. 5.1. Preliminary results Let us start with a proof that forward selecting edges can produce any chordal graph, and doesn’t limit our options. T 5.1.1. Any chordal graph G = (V, E) can be reached by a sequence of m = |E| chordal graphs on the same vertices, G(0) = (V, ∅) = (V, E0 ), G(1) = (V, E1 ), . . . G(k) = (V, Ek ) . . . G(m) = (V, Em ) = G Ek = Ek−1 ∪ {(ak , bk )}
for all k>0
(5.1.1) (5.1.2)
starting with a graph without edges and at each step adding an edge (a k , bk ) not in Ek−1 . P. The following algorithm does exactly what the theorem describes.
�
A 5.1.2. To construct a chordal graph, one edge at a time: Let n be the number of vertices in G and v 1 , v2 , . . . vn be a perfect elimination order for G as in definition 3.0.8. That is, for all j, v j is simplicial (its neighbours form a clique) in G{v j ,v j+1 ,...vn } . This defines an order on the vertices, say v j ≺ vk iff j < k in that ordering. Such an order can be found using an algorithm such as maximum cardinality search [Gol80, chapter 4]. If we deleted the edges attached to each vertex, taking the vertices in that order, each would be simplicial at the time it was reached. Instead we are going to run that in reverse, adding all the edges “upward” from a vertex before processing the next-lower vertex. Let (ai , bi ), i = 1..m be a sorted list of the edges where we take a i ≺ bi for all i, and put (ai , bi ) before (a j , b j ) iff a j ≺ ai or (a j = ai ) ∧ (b j ≺ bi ). Adding the edges in this order produces a chordal graph at each step. For suppose G (k) had a simple cycle of length at least 4 that did not have a chord. Let vc = ak be the smaller vertex of the edge just added. All edges (a, b) with ak ≺ a ≺ b have already been added, so {vc+1 , vc+2 , . . . vn } induces identical subgraphs in G and G(k) . This subgraph is chordal, so any cycle lacking a chord must include v c , like this: [x, vc , y . . . ]. No edges with a ≺ vc are present yet, and the higher-numbered neighbours of vc form a clique in G. So (x, y) is an edge already in G (k) and thus a chord.
5.1. PRELIMINARY RESULTS
57
This would be fine if we knew a graph G before we started. Normally we don’t, and we are going to “feel our way forwards” by greedily picking the “best” edge at each step. This means we don’t have an elimination order to work from, but we can’t just add the edges in any order if we want to ensure chordality. What this theorem does tell us is that going forwards this way could in principle give us any chordal graph. Here is the key insight that shows us which edges we can add. It also justifies the attention given to the clique graph C(G) in chapter 3. L 5.1.3. Let a and b be non-adjacent vertices of a chordal graph G = (V, E), and let G 0 = (V, E + (a, b)) be the graph formed by adding the edge (a, b). Then G 0 is chordal if and only if there exist cliques Ca and Cb of G such that a ∈ Ca , b ∈ Cb and Ca ∩ Cb separates a and b, that is, (Ca , Cb ) is an edge in C(G). P. (Note: Figure 5.1.1 on page 58 illustrates this condition) Let T = bd(a) ∩ bd(b), the common neighbours of a and b, and S a minimal a, b-separator (which exists as a / b). Clearly T ⊆ S. Now S is a clique by theorem 3.1.2, so {a} ∪ T and {b} ∪ T are both cliques. Take any maximal cliques C a and Cb containing these respectively. Any element of Ca ∩ Cb is adjacent to both a and b, so Ca ∩ Cb = T. On the other hand, if A 3 a and B 3 b are cliques then A ∩ B ⊆ T. So we have only to prove that G 0 is chordal iff T is an a, b-separator, that is, S = T. First suppose S , T, so there exists a path between a and b not passing through T. Let [a, x1 , . . . xp , b] be such a path of shortest possible length. It must have p ≥ 2 as x 1 < T. There cannot be any chords (a, xi ), (xi , x j ), or (xi , b) or there would be a shorter path. But then [a, x1 , . . . , b, a] is a cycle of length at least four in G 0 that has no chord. Conversely, suppose S = T, and take any simple cycle [x 1 , . . . xp , x1 ] with p ≥ 4 in G0 . If (a, b) is not a link then this was a cycle in G and still has a chord. Otherwise, a simple cycle cannot use the link (a, b) twice, so it must have another path from b back to a. This must contain an element t ∈ T, but p ≥ 4 means either (t, a) or (t, b) is a chord of the cycle. So G 0 is chordal. Note that T is the unique minimal a, b-separator 1. � The remaining results in this section are technical conditions for the graph update. C 5.1.4. Under the conditions of the previous lemma, if (a, b) is eligible for addition, then Cab , {a, b} ∪ (Ca ∩ Cb ) is the only new maximal clique of G0 . P. Let S = Ca ∩ Cb be the minimal separator. It was observed in the previous proof that {a} ∪ S and {b} ∪ S were cliques in G, so {a, b} ∪ S is a clique in G 0 . Now consider any new clique containing the edge (a, b). There cannot be a simple path [a, x, b] from a to b not passing through S, so the clique must be a subset of {a, b} ∪ S. Any clique of G0 not containing (a, b) must also have been a clique of G, and cannot suddenly become maximal. � 1This is not the proof from [DGJ01], but one developed from standard techniques
58
5. THE FORWARD SELECTION ALGORITHM
Ca
Cb
g
c
S
h
f
b
a
e d i
Clique Graph: Ca
Cb
{a,e,f,g,h,i}
{b,c,d,e,f}
(a) Before edge addition
g c h
Cab
f
b
a
e d i
Clique Graph: Ca
Cab
Cb
{a,e,f,g,h,i}
{a,b,e,f}
{b,c,d,e,f}
(b) After edge addition
F 5.1.1. An example of the update when an edge is added
5.1. PRELIMINARY RESULTS
59
C 5.1.5. The maximal cliques of G 0 are
n o ΓG0 = {Cab } ∪ ΓG \ {a} ∪ S, {b} ∪ S
(5.1.3)
so that one vertex is added to C(G) and at most two vertices deleted to give the vertex set of C(G 0 ). P. We have shown that the only new maximal clique is C ab . Any maximal clique of G is still a clique, and ceases to be maximal iff it is a subset of C ab . No clique of G contains both a and b and {a} ∪ S and {b} ∪ S are both cliques in G, so they are the only candidates — if they were maximal in G, they are not in G 0 . � L 5.1.6. Let G0 be a chordal graph obtained from another chordal graph G by adding an edge (a, b). Let C(G) and C(G0 ) be their clique graphs and Sab the unique minimal a, b-separator in G. Consider any edge (C, D) of C(G) with minimal separator S CD = C ∩ D, where C and D are also maximal cliques of G0 . Take some representatives c ∈ C \ D and d ∈ D \ C. Let P a 3 a and Pb 3 b be connected regions of GV\Sab (There may be other disjoint connected parts.) Then (C, D) is an edge of C(G0 ) unless either c ∈ Pa , d ∈ Pb or d ∈ Pa , c ∈ Pa , when it is NOT an edge. In the latter case, SCD = Sab . P. (based on DGJ) Let PC 3 c and PD 3 d be the connected parts of GV\SCD . (C, D) ceases to be an edge exactly if PC and PD are connected in G0V\S , which happens exactly CD if a ∈ PC and b ∈ PD or vice versa. First suppose a ∈ PC and b ∈ PD , so SCD separates a and b in G, hence Sab ⊆ SCD . Then two vertices that are connected in GV\SCD are also connected in GV\Sab , so c ∈ Pa , d ∈ Pb . Those sets are separated by Sab , which must contain the minimal c, d-separator S CD . So Sab = SCD . The same argument applies for b ∈ PC and a ∈ PD , except that we conclude d ∈ Pa , c ∈ Pb . We have established that if (C, D) is NOT in C(G 0 ) then Sab = SCD and one of c, d is in each of Pa , Pb . Now suppose c ∈ Pa , d ∈ Pb so Sab separates c, d, hence SCD ⊆ Sab . Two vertices that are connected in GV\Sab must be connected in GV\SCD , so a ∈ PC and b ∈ PD , thus (C, D) cannot be an edge in C(G0 ). Likewise d ∈ Pa , c ∈ Pb ⇒ b ∈ PD , a ∈ PC and (C, D) cannot be an edge in C(G0 ). � We now know when an edge from C(G) needs to be in C(G 0 ). The next lemma sets out the exact conditions for adding edges incident to our single new vertex C ab . If two vertices of C(G) were not separated by their intersection in G, they certainly won’t be in G 0 , so these are the only new edges in C(G0 ). After this lemma we have all the results we need about the update C(G) → C(G0 ). The actual algorithm will be presented in section 5.3. L 5.1.7. Let Sab , Ca ∩ Cb and Cab , {a, b} ∪ Sab , the new maximal clique in C(G0 ). Then for any vertex C0 of C(G0 ), (Cab , C0 ) is an edge of C(G0 ) iff at least one of the following is true of the separator S0 , C0 ∩ Cab :
60
(i) (ii) (iii) (iv)
5. THE FORWARD SELECTION ALGORITHM
S0 S0 S0 S0
= Sab ∪ {a} = Sab ∪ {b} = C0 ∩ Ca ⊂ Sab ∪ {a} and (C0 , Ca ) ∈ C(G0 ) = C0 ∩ Cb ⊂ Sab ∪ {b} and (C0 , Cb ) ∈ C(G0 )
P. Assume that (C0 , Cab ) is an edge of C(G0 ). Since C0 , Cab , C0 cannot contain both a and b (see 5.1.4), so either S0 ⊆ Sab ∪ {a} or S0 ⊆ Sab ∪ {b}. Equality gives (i) or (ii). Suppose S0 ⊂ Sab ∪ {a}, to prove (iii), and result (iv) will be analogous. Take some x ∈ (S ab ∪ {a}) \ S0 . Note S0 ⊆ Ca so S0 ⊆ C0 ∩ Ca . In G0V\S0 x is disconnected from C0 \ S0 , but x ∼ y for any y ∈ Ca \ S0 . So Ca and C0 are separated by their intersection which must be S 0 , that is, (C0 , Ca ) is in C(G0 ). This completes one direction of the proof.
Suppose (i), and it is sufficient to show C 0 is separated from b by S0 = Sab ∪ {a}. For any c ∈ C0 \ S0 (non-empty since C0 * Cab ), c ∼ a so Sab separates c, b in G and so S0 separates them in G0 , and (Cab , C0 ) is an edge. The same logic works for (ii).
Now suppose (iii), so we have some x ∈ (S ab ∪ {a}) \ S0 ⊆ Ca . Take c ∈ C0 \ S0 as before. Any path from c to x must pass through S 0 = C0 ∩ Ca because (C0 , Ca ) ∈ C(G0 ), so (C0 , Cab ) ∈ C(G0 ). � Junction tree updates. Recall that a junction tree is a maximum weighted spanning tree of C(G) where the weight of an edge is the number of vertices in the minimal separator. Also recall that the maximal cliques Γ G , ΓG0 and the separators γG , γG0 are independent of the junction trees chosen. The weights of existing edges do not change so the only new weights to compute are for the edges (C 0 , Cab ) described by the previous lemma. In case (i) the weight is |Sab + {a}| and Sab must have separated C0 from Cb in the original graph G. In case (iv) (C0 , Cb ) was already an edge of C(G) and the new edge has the same weight. Similarly in case (ii) and (iv) (C0 , Ca ) must have been an edge of C(G).
What all this says is that any new C(G 0 ) edge (C0 , Cab ) corresponds to a previous C(G) edge (C0 , Ca ) or (C0 , Cb ) or both, and in cases (iii) and (iv) the old and new edge have the same weight. Now if Ca ⊂ Cab , every edge (C0 , Ca ) will satisfy condition (iii) and we definitely add (C0 , Cab ), and similarly for Cb ⊂ Cab . L 5.1.8. Let J = (ΓG , E) be a junction tree for G containing (C a , Cb ). (Every C(G) edge is in at least one junction tree by lemma 3.5.4) Construct J 0 from J by the following operation: replace (Ca , Cb ) with (Ca , Cab ), (Cab , Cb ). (see "equation" 5.3.1) If Ca ⊂ Cab , delete the vertex Ca and replace all J edges (C0 , Ca ), C0 , Cab with (C0 , Cab ). Do likewise if Cb ⊂ Cab .
Then J 0 is a junction tree for G0 and there are four possible outcomes for Γ G0 and γG0 :
(1) Ca 1 Cab and Cb 1 Cab , so the maximal cliques become ΓG0 = ΓG + Cab and the separators are now γG0 = γG + Cb ∩ Cab + Ca ∩ Cab − Ca ∩ Cb (2) Ca ⊂ Cab and Cb 1 Cab , so we get ΓG0 = ΓG +Cab −Ca and γG0 = γG +Cb ∩Cab −Cb ∩Cb (3) Ca 1 Cab and Cb ⊂ Cab , likewise ΓG0 = ΓG + Cab − Cb and γG0 = γG + Ca ∩ Cab − Ca ∩ Cb (4) Ca ⊂ Cab and Cb ⊂ Cab , so both are absorbed in Cab and ΓG0 = ΓG + Cab − Cb − Ca , γ G0 = γ G − C a ∩ C b
5.2. DATA STRUCTURES
61
P. Consider any vertex x of G, and the subtree of J it induces. It is apparent that it also induces a subtree of J 0 which is thus a junction tree. (There are four cases: x can be in Ca , Cb , both, or neither. In each case we get an induced subtree whether or not C a or Cb ceases to be maximal) � Actually, Prim’s algorithm is so fast that the implementation written just computes a new junction tree directly for each C(G 0 ) and doesn’t try to update it in step. Amongst other things, such an update is not always possible because the junction tree that was computed for C(G) at the previous step might not contain (C a , Cb ). The reason for going through this was instead to prove theorem 5.5.2 which will make entropy based optimisation very straightforward.
5.2. Data structures The following data structures are all updated in place during the algorithm. We assume they are correct when we call the function add_edge and show that they are again correct when we finish. Their types and initial values are as follows: (1) The graph G of class Graph, holding G. It begins with no edges, and always has the same vertices, representing the random variables in our model. These will be labelled {1, 2 . . . , n}, and referred to using lower case letters a, b etc. (2) The clique graph CG, also of class Graph, holding C(G). It begins with vertices {{1}, {2} . . . , {n}} (actually the clique labels [1, 2 . . . , n], see (4) below). It also begins with a complete set of edges, since every vertex is a maximal clique and all are disconnected by their empty intersection. The edges also have a property sep_clique, the clique label of the minimal separator. f (3) An n × n array EfM of objects of class EdgeInfo. (This follows the notation E M used by DGJ). For any a , b, EfM[a][b]=EfM[b][a] are references to the same object that record whether (a, b) is eligible for addition, and if so, one edge (C a , Cb ) that satisfies lemma 5.1.3. For efficiency, it also records the separator S = C a ∩ Cb . Initially every edge is eligible due to the C(G) edge ({a}, {b}) and S = ∅. (4) An extensible list cliques of objects of class CliqueInfo recording cliques of G that we have seen. The indices into this list, clique labels, are used to represent cliques. Every clique has a unique label so two cliques have the same vertex set iff they have the same label. The empty clique has label zero, and labels 1 ≤ j ≤ n refer to the single vertex cliques {j}. If C is a CliqueInfo object, C.chain(x) returns the label of C ∪ {x}, creating a new cliques entry if necessary. This proves to be the only operation needed to look up cliques, and is easily optimised. This class is also used for a few other purposes, such as caching the marginal density estimate associated with this clique. Finally, each CliqueInfo object contains a list sep_for_edges recording those CG edges having this unique minimal separator.
62
5. THE FORWARD SELECTION ALGORITHM
5.3. The algorithm We will consider the addition of a given edge through the algorithm, as implemented in ForwardSelector.add_edge in the module forwsel.py. An edited version of the code is in Appendix A, and is intended to be readable; it should help resolve any ambiguities or details omitted here. The steps as numbered in [DGJ01] are: 1. 2a. 2b. 3. 4. 5. 6. 7.
Computing connected sets Pa and Pb Adding the new CG vertex Deleting CG edges Adding new CG edges Deleting CG vertices Updating G Updating the eligible edge matrix Obtaining the new junction tree and joint density
We will now go through these in order. Preliminaries. We assume we have selected an eligible edge (a, b), deferring discussion of how to go about this to section 5.8. We look up Ca,Cb and the separator S in the EdgeInfo object EfMa][b], and can find Sa= S ∪ {a}, Sb= S ∪ {b} and Cab= S ∪ {a, b} using the S.chain method. A simple example is shown in figure 5.1.1. 1. Computing connected sets. Find the sets of vertices connected to a and b respectively in GV\S , conn_a= Pa and conn_b= Pb respectively. The Graph class contains methods for deleting vertices and finding connected regions by breadth-first search. Now we begin updating CG. 2a. Adding the new CG vertex. There is precisely one new maximal clique Cab, from corollary 5.1.4. It is clear that (Ca , Cb ) ceases to be an edge, and can be replaced by (C a , Cab ) and (Cb , Cab ):
� �
C(G)
� � �
� �
C(G0 )
� �
� � Cb �
Ca
� �
� � �
Ca
� �
� �
� �
�
� �
Cab
Cb
�
(5.3.1)
� �
We will defer deleting vertices until later. Nothing we do to their edges in the interim matters since they will eventually vanish.
5.3. THE ALGORITHM
63
2b. Deleting CG edges. For each edge (C, D) in CG, take representatives c ∈ C \ D, d ∈ D\C. We use lemma 5.1.6 and the sets from step (1): keep the edge unless its separator was S and either c ∈ Pa ∧ d ∈ Pb or d ∈ Pa ∧ c ∈ Pb . The separator test is not actually necessary (this is was not realised in the DGJ paper), but since we keep a record sep_for_edges of CG edges separated by S it is kept as an optimisation. Actually, without that test there is no need for sep_for_edges, so it could be removed entirely. That list is kept up-to-date when edges are deleted, and also in the next step when they are created. 3. New CG edges. Any new edges must be incident to C ab , because if A ∩ B did not separate cliques A and B in G, it certainly will not do so in G 0 . The conditions for having an edge are listed in lemma 5.1.7, and are checked this way: 3.1a. 3.1b. 3.2.
For every edge (C0 , Ca ) in CG, add (C0 , Cab ) if Repeat 3.1a. for Cb and Sb For every maximal clique C0 , Cab we check whether S ⊂ C0 . If it also contains either a or b, we satisfy condition (i) or (ii) of the lemma and we add (C 0 , Cab ).
4. Removing CG vertices. From 5.1.5, the only CG vertices we delete are Sa or Sb, if they were maximal. But these lie inside Ca and Cb respectively, so we only have to check whether Ca=Sa and if so delete it, with all its incident edges. We likewise check whether Cb=Sb. This can be thought of as “merging” into Cab. CG is now completely updated. 5. Updating G. All that has to be done to G is to add the edge (a, b). 6. Updating the eligible edge matrix. Some possible edges (x, y) of G may now be ineligible due to our chordality criterion, because there are no C(G) edges corresponding to them. This will happen exactly if x ∈ P a , y ∈ Pb or vice-versa, see lemma 5.1.6. We loop through all pairs x ∈ Pa and y ∈ Pb , marking (x, y) ineligible. Note that this also rules out the edge (a, b) that we just added. Some other edges may have become eligible, or be eligible because of an edge like (C a , C0 ) that no longer exists. For each edge (C ab , C0 ) that we added to CG, we explicitly set the CG_edge in EfM[x][y] for all x ∈ C0 \ Cab , y ∈ Cab \ C0 . We also mark eligible the following edges: • If a < C0 , all edges (a, x) where x ∈ C0 , with CG edge (Cab , C0 ) • If b < C0 , all edges (b, x) where x ∈ C0 , with CG edge (Cab , C0 ) It is clear that these edges are eligible from lemma 5.1.3. There are no more associated with the CG edge (Cab , C0 ), since any such edge would be of the form (s, x) where s ∈ S, s < C 0 and x ∈ C0 . But then C0 ∩ S cannot be all of S, so (Cab , C0 ) must have been of type (iii) or (iv) in lemma 5.1.7’s classification of these new edges. So in the old C(G) we must have had either the edge (Ca , C0 ) or (Cb , C0 ), hence s was separated from x by the relevant intersection
64
5. THE FORWARD SELECTION ALGORITHM
in G. The addition of (a, b) only affects separation if the separator was S, so (s, x) must already have been eligible. 7. Obtaining the new junction tree and joint density. Run Prim’s algorithm to determine a maximum weight spanning tree of CG (see 3.5.1). Form the model given by 4.3.5, and compute the necessary marginal densities. Actually, many of these are probably cached from the previous time we did this, since they depend only on the specified vertices and not on the graph. Strong decomposability. It was not found necessary to impose strong decomposability in this project. However, DGJ observe that the forward selection algorithm can easily be modified to maintain strong decomposability at each stage. We simply start with G (0)? (see definition 4.5.1), that is, including a ? vertex and all edges (?, d) to discrete variables d. Theorem 4.5.2 means that we can just evolve the graph G ? rather than G without changing the algorithm. It was observed after that theorem that G ? has a perfect elimination order ending in ?, so the analogue of theorem 5.1.1 will follow from the same proof. That is, any strongly decomposable graph can in principle be constructed by forward selection. 5.4. An example It seems appropriate to present a short example. The graph shown in figure 5.4.1 is to have the edge (a, b) added. This figure includes the eligible edges as dashed lines and is essentially a screen capture from the forward selection program. The following figure, 5.4.2 shows the same graph with its clique graph and the clique structure marked. One possible junction tree is highlighted with dash-dot lines, although these are otherwise normal clique graph edges. The clique graph separators have also been annotated on the edges. There is only a single possible choice for Cb , but one of several possible Ca has been selected. The separator is S = {c} We will now work through the algorithm step by step. 1. Connected sets. The connected regions in G V\{c} are Pa = {a, f, g, h, i}, Pb = {b, e} and {d}, which is in neither. 2a. New CG vertex. The new clique, Cab = {a, c, b} is marked in figure 5.4.3, and we add (Cab , Ca ) and (Cab , Cb ). 2b. Deleted edges. The only deleted edges will be (C b, Ca ), (Cb , {a, c, g, h}) and (Cb , {a, c, f, g}). Since Cb will shortly cease to exist, these would have been deleted anyway. 3. New edges. The new edges are marked with heavy lines in figure 5.4.3. (Cb , {a, c, g, h}) and (Cb , {a, c, f, g}) come from condition (i) of lemma 5.1.7, while (Cb , {b, e}) and (Cb , {c, d}) satisfy condition (iv). 4. Removing vertices. We now delete C b as it is subsumed into Cab .
5.5. ENTROPY METHODS
65
5. Update G. The new edge is shown in bold in the final figure. 6. Update eligible edges. All the edges from b to {a, f, g, h, i} are marked ineligible. The only previously eligible edge to e was {c, e} which remains so. We now mark as newly eligible (a, e) against (Cab , {b, e}) and re-mark (a, d) against (C ab , {c, d}). We mark (b, f ) and (b, g) against (Cab , {a, c, f, g}), and (b, h) and (b, i) against (C ab , Ca ), although the choice of CG edges here is not unique. Observe that since Cb ceased to exist, any eligible edge to b or c that counted on a CG_edge record using Cb was invalid, but by clearing and re-marking them this record has been updated correctly. The edge (e, c) is left eligible but has its CG edge updated to (C ab , {b, e}). 7. Obtain the new junction tree. The previous junction tree happens to be valid again, as marked with dash-dot lines. Its weight has increased by one because the (C a , Cab ) edge now has weight two rather than weight one. Whereas the old model was fˆacgh fˆac f g fˆcd fˆbe fˆbc fˆachi fˆold = × fˆc fˆac2 fˆc fˆb The new model changes only the first term: fˆacgh fˆac f g fˆcd fˆbe fˆabc fˆachi × fˆnew = fˆac fˆ2 fˆc fˆb
(5.4.1)
(5.4.2)
ac
5.5. Entropy methods We now have a way of building chordal graphs. Before we go on to consider how to choose edges, and how to decide when to stop, we need to think about what we mean by a “good” model. The tool that DGJ used, based on earlier work by Malvestuto [Mal91] and others, was the K-L divergence. Revision of definitions. It will be worth revising the results from chapter 2 in the context of our new estimate. N 5.5.1. Let hS (xS ) be the histogram estimate of fS (xS ), for any marginal subspace S. The K-L information divergence defined in 2.5.5 is R f ˆ f log fˆ dx f (x) = 0 ⇒ f (x) = 0 ∀ x ˆ K( f, f ) , ∞ otherwise We will be using this to compare how “close” the estimate fˆ is to f .
(5.5.1)
66
5. THE FORWARD SELECTION ALGORITHM
G
i
d c
h e b a
g
eligible
f
GV\S
d
i
Pa Pb
h
e b a
g
f
F 5.4.1. Example II, with eligible edges and connected components The marginal entropy of a clique S is defined in 2.5.7 as
H( fS ) , −
Z
fS log fS dxS
(5.5.2)
The original definition preceded our notion of cliques, but the effect of the notation is the same: “project onto the subspace of variables in S”. We are going to estimate f S with a histogram on the space RS we get an estimate hS ≈ fS . In a finite space the entropy is given by the computationally straightforward expression X H(hS ) = − hS (x) log hS (x) (5.5.3) x∈RS
where we sum over the equal-volume boxes x of the histogram. Now given a junction tree J = (ΓG , EJ ) we have a set of maximal cliques ΓG and a set of separators corresponding to the junction tree edges γG = {A ∩ B : (A, B) ∈ EJ }
5.5. ENTROPY METHODS
67
Graph G i d
h
c e
b
dd
to a
a
g
maximal cliques junction tree
f
Clique Graph CG {c,d}
Ca={a,c,h,i}
S={
c}
{a,c}
{c}
{a,c,g,h}
{b} Cb={b,c}
{a,c}
{b,e}
{a,c,f,g}
F 5.4.2. Example II: Before edge addition Our graphical model is given by equation (4.3.4): Q � � Q � � h x / h xS C C S C∈C(G) S∈γ G fˆ(x) , 0 From theorem 2.5.9 we know that
H( fˆ) =
Y
C∈C(G)
H(hC ) −
Y
when all hS (x) , 0 otherwise
H(hS )
(5.5.4)
(5.5.5)
S∈γG
Equation (67) looks much like something we studied in section 2.5, namely Q � � Q � � f x / f xS when all fS (x) = 0 C C S C∈C(G) S∈γ G fe(x) , 0 otherwise
(5.5.6)
The difference is that feis defined by a log-linear combination of the true marginals (which we do not know) whereas fˆ is the same combination of the relevant marginal estimates.
68
5. THE FORWARD SELECTION ALGORITHM
Graph G i d
h
c e
b
a
g
new edges junction tree new maximal clique
f
Clique Graph CG {c,d}
Ca={a,c,h,i}
{a,c,g,h} Cab={a,b,c} {b,e} {a,c,f,g}
F 5.4.3. Example II: After edge addition
Example 2.5.10 showed that X X K( f, fe) = H( fC ) − H( fS ) − H( f ) = H( fe) − H( f ) C∈C(G)
(5.5.7)
S∈γG
If the graph G has the global Markov property (G) with respect to the true density then fe= f which would give K( f, fe) = 0. If hS estimates fS well enough, we would expect fˆ ≈ fe and that H(hS ) ≈ H( fS ), and therefore the measurement we want, the K-L number of fˆ with respect to f , is K( f, fˆ) ≈ K( f, fe) = H( fe) − H( f ) (5.5.8) or to look at it another way, K( f, fˆ) ≈ H( fˆ) − H( f )
(5.5.9)
5.6. A TURNING POINT
69
The approximate equalities here are due to the potentially complicated nature of the error in a marginal estimate and to be more precise about the errors would require considerably more work. Minimising the entropy. The K-L divergence K( f, g) is related to the likelihood that the distribution f generated a distribution that looks like g. Speaking informally, minimising this number helps minimise the information content of f − g. Like most density performance measures it is difficult to calculate this without knowing f . Now H( f ) does not depend on any of the estimates, so it is possible to minimise the K-L divergence H( fe) − H( f ) between f and the feby minimising H( fe). This in turn would help us choose a graph G that best captures any Markov independence structure of f . What happens then is that we cross our fingers and put in an empirical estimate h S in place of fS in the hope that the resulting estimate fˆ will be useful. From (5.5.9) we decide to minimise H( fˆ) which is a linear combination of the low dimensional entropies (5.5.5). These only require a simple sum (5.5.3) over an array. Even better, we have a simple formula for the effect of adding a given eligible edge. T 5.5.2. (DGJ) Under the conditions of lemma 5.1.3 (G0 = G∪{(a, b)}, with Ca , Cb ∈ C(G), letting S = Ca ∩ Cb ), if fˆ, fˆ 0 are estimates of the true density f based on G and G 0 respectively, then the improvement in the K-L divergence is given be ∆H(a, b) , K( f, fˆ 0 ) − K( f, fˆ) = −H(hS∪{a} ) − H(hS∪{b} ) + H(hS∪{a,b} ) + H(hS )
(5.5.10)
P. Substitution of each junction tree update case of lemma 5.1.8 into equation (5.5.7). � H(hS ) depends only on S and our data, so we can cache these entropies. Then after we add (a, b) we recalculate ∆H for those edges of G 0 whose CG_edge has changes. Only a few new entropies need to be calculated — (DGJ) prove a bound of 4n − 2| bd(a)| − 2| bd(b)| new subspaces but at most steps we expect there will be far fewer. Before the first step, if we are not using constant functions, we need to compute all one and two dimensional subspace entropies. There are n of the former and n(n−1)/2 of the latter, but one and two dimensional histograms are not too expensive and this is quite manageable. Using constant functions reduces the number of two dimensional spaces that need to be considered initially. 5.6. A turning point This is a turning point in the nature of this thesis. Up to this point we have been concerned to present a rigorous, coherent and thorough body of theory about graphical models. This has included some elegant theorems and the clockwork precision of the forward selection graph update. From now on comprehensive theorems will be rare. Our difficulty in evaluating the K-L divergence of density estimates is a symptom of the underlying messiness of the density estimation problem.
70
5. THE FORWARD SELECTION ALGORITHM
The remainder of this chapter is devoted to the practical questions of making forward selection work: how can we choose the edge to add, when do we stop, and how efficient this anyway? Most of the answers are heuristic, based on experiment and intuition rather than rigorous statistical methods. Almost all of these answers represent research questions of current interest, and we can expect significant further development of these techniques over the next few years. Consider the question of maximum likelihood. It would be very encouraging if we knew how to find the maximum likelihood estimator from our class of models (the chordal graphs). In the case of a finite space, or if we were using parametric estimators (like Lauritzen), it is possible to get some conditions that make fˆ a maximum likelihood estimate of f . For example, histograms hS over a finite space are maximum likelihood estimators, and we may be able to extend this property to the combination fˆ. In general, though, the casual use of estimates h S is pragmatically rather than rigorously motivated. In traditional statistical methodology this would be a good place to go back to the drawing board. We have a grab bag of heuristics for graph construction (to be discussed in a moment), and an unproven decision to plug in the product of some estimates that may or may not resemble the real marginals f S . How can we guarantee any kind of useful behaviour from such an instrument? We are motivated to go on by three arguments. Firstly, there are often no other applicable tools that are rigorously understood in the traditional sense. The difficulties with parametric models have been mentioned several times. One of the reasons we have spent so much time talking about minimising the entropy rather than the integrated squared error (the L 2 error) is that the former is computationally manageable and the latter is difficult. Secondly, we have an intuition that the interactions in real data are of quite low dimension, perhaps at most around 5 dimensions. To put it another way, a Markov network with clique sizes up to around 5 should be enough to model a very wide class of real data. This “folklore” comes out of the experience of a number of data mining researchers. By nature it cannot be “proven”, but if it is true then we are on the right track. A cautionary note. There are many dangers in assuming things we cannot prove about statistics and probability. A widely discussed example is Simpson’s paradox, where the two dimensional marginals of a three dimensional table would lead us to a completely wrong conclusion. Even a less confusing distribution that did not have Simpson-like effects might have high dimensional interactions that are difficult to capture and might lead us astray. Nevertheless. . . Our final motivation is that, if a graphical model estimate proves to be good enough for a given application, then its lack of statistical optimality becomes largely irrelevant. Many of the applications we will discuss have their own performance measurements that are easier to check than the error in the density. A good example is classification. Our theory will say that the closer we get to the real density, the better
5.7. STOPPING CRITERIA
71
our classification will become. Despite that, the real test is not how well it estimates the density, but how well the algorithm succeeds at classification. The effort of the last few chapters will be vindicated if maximising the quality of our density estimate also results in the outcomes we want in our applications. For example, in the experiment detailed in chapter 7, minimising the entropy ultimately brought about a perfect classification. In some cases it even out-performed an optimisation criterion that directly measured classification success. 5.7. Stopping criteria We first show that we can always keep adding edges up until we find ourselves with the complete graph on n vertices. The algorithm never hits a dead end by itself and we need some way of deciding when to stop adding edges. L 5.7.1. Any non-complete chordal graph G has an eligible edge, that is, an edge (a, b) not in G such that G + (a, b) is chordal. P. As G is not the complete graph there are at least two maximal cliques. Since the clique graph C(G) is connected (corollary 3.5.3) it has at least one edge, say (A, B). Take a ∈ A \ B and b ∈ B \ A, which exist as A and B are distinct maximal cliques. A and B are separated by their intersection so (a, b) cannot already be in the graph. Then (a, b) is eligible for addition by lemma 5.1.3. � Suppose we are using histograms on a finite space. In an ideal world, where we had the memory for marginal estimates in arbitrarily many dimensions, the graphical model’s estimate would converge to the empirical distribution function f V . That is, the histogram on all the variables. If we use some other non-parametric estimator for the continuous variables, this convergence would depend on the smoothing used. Nevertheless, we can see that by continually expanding the space of functions we expect that we will over-fit to our data and obtain a poor density estimate. Earlier, it was observed that a graphical model imposes a form of smoothing on the density estimate. Then the stopping criterion represents the choice of how much to smooth, which is generally a difficult decision in all density methods. Although this was not a central issue in our research we will suggest a few methods that might be useful. Limiting clique size. Usually the algorithm we use to find our marginal densities performs poorly as the number of dimensions increases. The dimension of subspaces we ask it to look at are determined by the size of the maximal cliques. When we think about adding an edge, we can easily determine the size of the sole new maximal clique C ab , and perhaps decide that this edge is not eligible after all. In this way we can limit the size of the maximal cliques formed. DGJ report initially limiting their estimator to cliques of size at most 3, but later reducing that to 2(!) as this improved their results. It is a matter for
72
5. THE FORWARD SELECTION ALGORITHM
conjecture whether this is because the data lacked strong 3 dimensional interactions, or just because their adaptive histograms were performing poorly on 3 dimensional subspaces. Alternatively, if our marginal density algorithm has some sort of sanity check, we could start by estimating fCab before we decide to add (a, b). For a histogram, this might take the form of a minimum ratio of data points to number of boxes. If it fails we need never consider (a, b) again, nor any other edge having C ab as a separator. As we continue to add edges, eventually we will reach a stage where we cannot add edges without violating a clique size condition, and this is perhaps the simplest stopping rule available. Test versus training data. A common way to control over-fitting in data mining applications is to have separate test and training data sets. The model is estimated from the training data, then applied to the test data to see how it performs. Although the model will converge to fit the training data better and better, we expect it to initially improve and then start to get worse when applied to the test data. The turning point is a useful place to stop. “How it performs” can be application dependent. For example, in the mushroom classification described in the next chapter, the performance was a weighted sum of the number of mushrooms misclassified with greater penalty for thinking poisonous mushrooms were edible. Entropy methods. Malvestuto defines the “elementary” graphs of rank k as those where all maximal cliques are of size k. He proves a theoretically interesting result that, of the graphs with no cliques having more than k vertices, a graph with minimum entropy can be found among the elementary graphs of rank k. Another way of saying this is that, given a clique size limit, we may as well make all the maximal cliques that size. This suggests an algorithm: add edges using a simple greedy algorithm to minimise entropy and stop when we cannot add any edges without forming a clique of size k + 1. The value of k would depend on the marginal estimator as described above. Chi-squared tests. In the Bell labs (DGR) application of graphical models to database query optimisation the idea is to fit the data actually present, so there is no such thing as over-fitting. That is, the density estimate is intended as a summary of the data present rather than the data that could be present. Some database density estimation algorithms do subsample the data and in that case there would need to be some sort of test data control. They did have a clique size cap due to the limitations of the histograms used. They also had a fixed quantity of storage to share between the marginal histograms, and because of this Malvestuto’s result about “elementary” graphs does not apply. Besides all of these, they would like to gain from the graph some idea of the relationships between variables
5.8. CHOOSING THE EDGE TO ADD
73
(database fields), and therefore ask for some level of statistical significance when adding an edge. Let fˆG be the estimate from the old graph and fˆG0 the estimate when�we add the chosen� edge. Their stopping criteria, besides the clique size cap, is a test of K( f, fˆG ) − K( f, fˆG0 ) against a χ2 distribution with d0 − d degrees of freedom. (see fact 2.5.11). The edge is added only if this test succeeds at a significance level of five percent. 5.8. Choosing the edge to add Scalability to large problems. To be useful in real data mining problems we need an algorithm whose complexity is linear in the size of the training data set. We can make one or more passes through our training data, but we may not even be able to hold all of it in memory at one time, and the number of passes must not depend on the number of data points. For example, the forward selection algorithm requires one pass for each marginal that is to be computed, although it may be faster to estimate several on one pass. Counting points for a histogram certainly qualifies but sorting the data does not. Although no data set this large was considered in this project it is important to consider algorithms that will scale to large problems. Given that even large data sets become sparse in high dimensional spaces, it may be that a density estimate is of most use where there is an enormous quantity of data. The greedy entropy-minimising algorithm. As discussed in section 5.5 how the task of finding an optimal density estimate can be reduced to finding a graphical model that minimises the entropy of the estimate H( fˆ). We also have a simple formula (5.5.10) for the improvement ∆H(a, b) we would get by adding any edge (a, b). The greedy algorithm chooses the eligible edge with most negative ∆H. Look-ahead with the greedy algorithm. The difficulty the greedy algorithm might have difficulty identifying three dimensional interactions that do not have clear two dimensional correlations. It is easy to construct synthetic “chessboard” type examples, but less clear how often this will be an issue in real data sets. One way around this is to look ahead two or more steps before making a decision. This quickly becomes combinatorially expensive. When there are few edges, very few edge entropies will need to be recalculated and this might not be too difficult. We will see in a moment that the basic greedy algorithm should do quite well in the case anyway. Another approach would be to make a partial or comprehensive multi-step lookahead when the one-step gets stuck. (By “partial lookahead” I mean some sort of tree pruning heuristics on the search space) The greedy algorithm with other criteria. The mushroom classification application described in the next chapter highlighted a problem with the entropy method described. It chose a large number of edges between highly correlated attributes. While this may have improved the information content of the joint distribution it did usually did little to improve the classification.
74
5. THE FORWARD SELECTION ALGORITHM
Instead, the approach taken was to add the edge that most improved the classification, giving extra weight to poisonous mushrooms that were misclassified as edible. Unlike the entropy methods where we have a shortcut calculation of ∆H it was necessary to compute C(G0 ) and then J 0 for each eligible edge at each stage, which proved to be much more expensive. One major optimisation that has been omitted in the appendix listing was to skip steps 5 and 6 (updating G and the eligible edge listing). Only an updated copy of CG was produced for each possible edge. Two stage look-ahead would have required saving all the data structures onto some kind of stack and was not implemented. This sort of greedy approach could be used with any criterion that depended on the updated model fˆ0 and is quite flexible. Dependence trees. Malvestuto notes that graphical models subsume an earlier idea, called “dependence trees” — see Chow and Liu, [CL68] (1968). These turn out to be graphical models with a maximum clique size of two, so the graph cannot have cycles, and must be a forest or at most a spanning tree. The interesting thing is that a greedy search to minimise the entropy reduces to Kruskal’s well known maximum weight spanning tree algorithm (below, algorithm 5.8.3). The behaviour of this algorithm is well understood, and if run long enough is guaranteed to find a minimal value of H( fˆ). When the random variables are all discrete, this spanning tree also turns out to be the maximum likelihood dependence tree. Chow and Liu used them in an optical character recognition task where there were 96 binary variables representing scanned, handwritten digits. The dependence trees roughly halved the error rate relative to a model with independent one dimensional marginals. Although it might seem like a very restricted case, it is interesting for several reason: • Kruskal’s is an example of an algorithm where greedy behaviour is guaranteed to lead to an optimal solution. This contrasts with the greedy algorithm in the higher dimensional case, whose behaviour can be difficult to foresee. • Until the first clique of size 3 is formed the greedy entropy-minimisation algorithm is taking the same steps. This Kruskal behaviour therefore gives us some intuition as to the initial behaviour of that algorithm. • Only two dimensional histograms are required and there are good adaptive or optimal bin-width algorithms available. They are also easy to store. • The computational demands of Kruskal’s algorithm and the weight function described below are even more modest than the forward selection algorithm and could easily be applied to enormous numbers of variables. • Although Bayesian nets are not discussed in detail here, an undirected tree of discrete variables can always be turned into a directed Bayesian version with arrows pointing away from any selected root vertex. There is no need to add edges in this case and the marginal densities are easily turned into the required contingency tables or vice versa. (The original paper used directed trees)
5.8. CHOOSING THE EDGE TO ADD
75
• If two dimensional interactions really are sufficient to model the data at hand this could be an effective technique. Consider the joint information function, and its estimate, defined for all pairs of distinct vertices:
I(a, b) ,H( fa ) + H( fb ) − H( fab ) Z fab = fab log dx fa fb b I(a, b) ,H( fˆa ) + H( fˆb ) − H( fˆab )
(5.8.1) (5.8.2) (5.8.3)
P 5.8.1. If a graphical model G = (V, E) is a forest (a union of trees on disjoint subgraphs) with a density estimate fethat factorises according to G, then X X H( fe) = − I(a, b) + H( fv ) (5.8.4) (a,b)∈E
v∈V
P. The result is trivially true when there are no edges, and we can induct on the number of edges using theorem 5.5.2 as a recurrence relation. � If we gave each possible edge (a, b) of G the weight I(a, b), then −H( fe) is just the total weight of the edges minus the constant sum of individual vertex entropies. In general we expect I(a, b) to be positive for “good” edges and we maximise the weight to minimise H( fe). You might object that we can’t compute I since it depends on the true one and two dimensional marginals fv and fab . The natural thing to do is to use an estimate h v and hab instead to get an estimate b I, and in the discrete case this is actually the right thing to do.
P 5.8.2. (Chow and Liu 1968) Given a vertex set of discrete random variables and some data, the maximum likelihood dependence tree is the maximum weight spanning tree obtained using the weight estimate b I.
The proof will not be reproduced here. Unfortunately, it relies upon the marginal histograms gS also being the empirical densities and hence the maximum likelihood marginal estimates. The empirical distribution is a headache in the continuous case and we need to also specify some sort of smoothing condition. Extending this result to continuous variables would require a marginal estimator that is known to find the maximum likelihood estimate within some class of functions. The greedy algorithm with a clique size limit of two therefore reduces to this: A 5.8.3. (Kruskal) Start with a graph having no edges, and at each stage add the edge of greatest weight b I that does not create a cycle.
This is may be found in any standard algorithms text, usually next to Prim’s algorithm; see for example Sedgewick [Sed98]. After j steps, it is guaranteed to find a forest of j
76
5. THE FORWARD SELECTION ALGORITHM
edges of maximum weight, so that after |V| − 1 steps it is guaranteed to find a maximum weight � spanning tree. �If we limit ourselves to only adding edges of positive weight, or I(a, b) against some χ2 distribution, we might stop with a partial test K( f, fˆG ) − K( f, fˆG0 ) = b forest. 5.9. Modification to include constant functions This section describes an original addition to the forward selection algorithm by the author, motivated by sparse grid methods. The algorithm described above starts with the assumption that all variables are independent, and the initial model is a product of one dimensional densities: n Y f (x1 . . . , xn ) = fXi (xi ) (5.9.1) i=1
We can take a step backward and ask whether we even need all the variables. For each random variable Xi , we assume ai ≤ Xi ≤ bi are bounds on its value. For discrete variables, we will need to extend those bounds by 12 as below, because the extended density of definition 2.1.12 spreads this far around each point. Define the constant density 1 bi −ai 1 cXi (xi ) , bi −ai +1 0
Xi continuous and ai ≤ xi ≤ bi
Xi discrete and ai −
1 2
≤ xi ≤ bi +
1 2
(5.9.2)
otherwise
An unbounded variable would need some non-negative L 1 function with norm 1 instead; although an empirical maximum and minimum from our finite data might be sufficient. Both of these functions are valid densities (non-negative and with total probability of one). Our aim is to have a positive density wherever we think the real density might be positive, without actually going through our data and storing an estimate. Note that any f is absolutely continuous with respect to c provided we have correct bounds. Constant densities were implemented in the Python module density.py. We start the algorithm with empty graphs G and C(G), and we have a set � of “withheld vertices” containing the random variables that would be the vertices of G. EfM should still be initialised n × n although there are initially no eligible edges. This gives us our starting model, with completely constant joint density: f (x1 . . . , xn ) =
n Y
cXi (xi )
(5.9.3)
i=1
One way of looking at this is as a log-linear model like equation (2.5.16), with the coefficients bk in {−1, 0, 1} instead of just {−1, 1}, although zero powers were explicitly prohibited there to make calculation less of a fiddle. The revised algorithm is this:
5.9. MODIFICATION TO INCLUDE CONSTANT FUNCTIONS
77
(1) Choose either an eligible edge (a, b) where a, b ∈ G, (a, b) < G and G + (a, b) is chordal; or choose some vertex w ∈ W, whichever improves the model the most. (2) If we chose an edge, add it using the previous algorithm. (3) If we chose a vertex, remove w from W and add it to G as a vertex with no edges. Add the maximal clique {w} as a vertex of C(G), and add all possible edges (C 0 , {w}), since {w} is disconnected from every other clique. All edges (v, w) where v ∈ G and v , w are now eligible for addition based on the C(G) edge ({w}, C v ) where Cv is any maximal clique containing v. (4) Find the junction tree model fV (xV ) where V is the vertex set of G. The new model is Y cw (xw ) (5.9.4) f (x) = fV (xV ) × w∈W
(5) Decide whether to stop, otherwise repeat from (1) This amounts to including variable reduction in the algorithm itself, rather than doing this as a separate step beforehand. The advantage is that we now have a wider class of models, and we might learn some interesting things about which variables are actually important to the density. We may also end up with a more computationally efficient f because we no longer need irrelevant variables. This modification was fully implemented as an optional starting behaviour in the code written. It performed quite well on the mushroom data set (see next chapter) where many single vertices, especially “odor”, were a excellent predictors just by themselves. The algorithm easily identified these and left many other vertices constant. In order to decide what variables we are going to add, we really need to estimate all the one dimensional densities fw (xw ) at the start anyway, so we don’t escape doing that. On the other hand, previously we started by considering all the possible edges as eligible, n(n−1) giving us 2 two dimensional marginals to estimate at the first step, where now we start with only n and will have a reduced number of options to consider for at least the first few steps. This might allow us to attack problems of higher dimensionality. The big disadvantage is that the edge selection methods proposed here are all greedy algorithms, and asking them to look an extra step ahead to find k-dimensional interactions may make the algorithm less effective. Certainly the current implementation would struggle with a “chessboard” data set having two-dimensional correlations that are not evident in one dimension. Whether this is an issue in real data sets would be an interesting question for further research. The application to mushroom classification described in the next chapter found that when starting with constant functions, the algorithm failed to identify two-dimensional interactions that it needed. This was a very naive greedy algorithm without lookahead. Another approach would be to start with one-dimensional densities as in the original algorithm, perform some forward selection of edges, then have a variable elimination step at the end to see whether some variables are not contributing to the model. This would
78
5. THE FORWARD SELECTION ALGORITHM
not be very different from the original algorithm except that it could produce a model that was slightly faster to evaluate and used a little less storage.
5.10. Algorithms for estimating marginal densities A graphical model is a way of combining lower dimensional estimates from some other algorithm into a full joint density. This algorithm does not depend on the particular method used to estimate marginal densities, although if they do not return a density, that is, a non-negative function integrating to one, the result will not be a density either. Histograms with previously defined bins are the simplest method, and the only estimator used in this project. They are the only option for categorical variables, such as “gender” or “colour”, although it might be advantageous to combine bins of very low frequency in some applications. They are also suitable for numerical data that has been binned beforehand. If a variable is continuous there are other possible strategies. The Bell labs work (Deshpande at al) used a form of adaptive multi-dimensional histogram, “MHIST-2”, as proposed by Poosala and Ioannidis [PI97]. This works by recursively subdividing space into bins of different sizes depending on the data. At each stage a bin, dimension and threshold are chosen according to some optimality criterion such as having the largest variance. That bin is divided in two along that dimension at the threshold chosen. This has the advantage of working well with a wide range of different data types and distributions, and is designed to use minimal storage and allow incremental addition of data. The approach certainly seems promising. Unfortunately, the evidence from the Bell labs paper might be taken to indicate that the histogram did not perform very well in more than two dimensions. There are presently no real theoretical results about the performance of M-HIST, perhaps reflecting its origin in database research rather than statistics.
Parametric models for some variables. If we have reason to believe that a particular marginal is distributed according to some parametric model then we can certainly fit it using standard techniques. For example, Lauritzen [Lau96] assumes all marginals of continuous variables follow a multi-variate normal distribution and estimates the mean and covariance. If we are right, then we need to estimate many fewer parameters; we will probably get much better estimates; and we can estimate marginals of much higher dimension. Unfortunately, this is of limited value when using graphical models for initial exploration of complex data or where no model is known — which is precisely when we most want to use them. Depending on the model, it may be necessary to impose a condition like strong decomposability, as discussed in section 4.5.
5.10. ALGORITHMS FOR ESTIMATING MARGINAL DENSITIES
79
Kernel estimators. A kernel estimator would seem to be a particularly good choice for continuous variables. They have good theoretical properties even in the multivariate case and produce much “nicer” functions than histograms. For example, choosing a differentiable kernel produces a differentiable estimate, which would allow a hill-climbing produce for finding modes. There are no discontinuities and no bin edge to choose. Issues regarding the choice of kernel and bandwidth (smoothing parameter) are relatively well studied, see for example Scott [Sco92, chapter 6]. The biggest difficulties are computational, especially when we need to evaluate each marginal density many times. For example, mushroom classification requires over 8000 evaluations of each marginal for every eligible edge that is tested for addition at each step. R Entropy methods require an integral of f log f which for general kernels would require a numerical quadrature (perhaps a Monte Carlo method) and these also require many function evaluations. A kernel with infinite support would technically require a complete pass through the data for each evaluation which would be prohibitive. The data could be sub-sampled at the risk of significant errors where the density is small. We should be reluctant to throw away data since even a large data set becomes sparse in more than two or three dimensions — this is part of the curse of dimensionality. Hinneburg and Keim2 [HK98] use this approach for high dimensional clustering and their application will be discussed in the next chapter. For now we just note that they make a fairly conventional kernel estimate using a Gaussian kernel of variance σ, although perhaps because of the computer science context they call it an “influence function”. They partition the space into a mesh of cells with side length 2σ and assign the data to cells. The density estimate ignores the contribution of points in all but the target cell and immediately adjacent cells. Let p be the number of data points, n the number of dimensions and c the number of non-empty cells. Suppose the maximum number of points relevant to a cell is m. By storing non-empty cells in a B-tree structure they can evaluate the density at a point in O(m log c) time. Although this is inferior to a histogram’s O(1) lookup it could be acceptable for many applications. Building this tree structure requires O(c log c + p) ≤ O(p log p) time but the authors report typical values of c ≈ log p so the algorithm was in practice O(p). The dimension doesn’t affect this algorithm’s theoretical complexity because in high dimensional problems p is much smaller than the number of cells (2σ)−n . Its actual performance would appear to depend on how “clumped” the data points were. The example given in that paper seemed to be very highly clumped with many points very near to each cluster center. This approach is interesting but would need further thought for use with graphical models. Firstly, we cannot afford a tree data structure for each marginal that would be proportional in size to the whole dataset. A clever quad-tree type approach might allow some trees to 2This happens to be the paper I presented in the 1998 third year data mining course
80
5. THE FORWARD SELECTION ALGORITHM
estimate some of their marginals. Alternatively, we could take the cells of the full dimensional space as vertices and keep multiple sets of edges (graph topologies) corresponding to various projections. That is, the “cell” in a marginal estimate would be represented by a path through the higher dimensional cells that project onto it. This might reduce the storage to O(c) per marginal, but the evaluation time could in principle blow out to O(mc log c). A second problem is the difficulty of calculating or estimating the entropy. Some kind of Monte-Carlo approach that randomly picked cells then points in cells might be effective, but this would need to be investigated. Frequency polygons and spline estimators. A different approach is to use piecewise polygonal functions (splines) given by some matrix of parameters. This retains the rapid evaluation advantages of a histogram and straightforward entropy calculation while finding a continuous or even differentiable density. The simplest such idea is the frequency polygon discussed in chapter 2: piecewise linear interpolating between the centers of the histogram bins. If the underlying density is continuous they have better error bounds than the histograms and are nearly as simple to evaluate. Although they are not differentiable on polygon boundaries, it may still be possible to hill-climb after a fashion. Frequency polygons require the same storage as a histogram of the same size and suffer the same problems as the dimension increases. Higher order splines present interesting possibilities as marginal density estimators, particularly with a finite-element type procedure to fit them, see Hooker [Hoo99]. It is possible to control the smoothness quite directly, although the resulting smoothed estimate may not be non-negative.3. 5.11. Some efficiency considerations Efficiency of the algorithm. Although the proof is not repeated here, by careful use of the extra data structures mentioned the complexity of the algorithm is O(n 2 ) where n is the number of vertices of G, that is, the dimension of the problem. Adding k edges therefore takes O(kn2 ) plus whatever time is taken to determine which edge to add. Even the relatively unoptimised Python implementation of the algorithm was extremely fast and would scale to very large n if required. The number of vertices in the clique graph is at most n (this is a straightforward induction on the size of the graph, using the existence of a simplicial vertex that is in only a single maximal clique). The number of edges in the junction tree is one less than the number of vertices. So the number of marginal densities that need to be estimated for the final model is at most 2n − 1, although more will be required along the way. If the marginal density estimator is O(p) in the number of data 3The author has suggested in private communication that the projection onto the space of splines on a finite
mesh is the dominant smoothing effect for realistic mesh sizes, and that the derivative smoothing term being minimised might have negligible effect. If this is true one could use a simpler form that is guaranteed to be non-negative. That would leave the mesh size as the only smoothing parameter.
5.11. SOME EFFICIENCY CONSIDERATIONS
81
points p, we have at most O(np); less if we can project the maximal clique marginals to obtain the smaller marginals in the denominator. This also means that a point evaluation is O(n) times the cost of a point evaluation of a marginal density. Quickly estimating arbitrary marginals. In many applications, the full joint density will not be required. We may only want the marginal projection onto S ⊂ V, say two or three variables out of many. If those variables are part of the same clique we can project an existing marginal estimate. When they are not, we would like to project fˆ, that is, estimate fS from our model rather than from the data. The use of graphical models in query optimisation as described in the next chapter depends on the ability to make very rapid evaluations this way. In their paper [DGR01] the authors propose an algorithm that propagates such an evaluation request through a junction tree, starting at some root clique and initially sending it in all directions. Only those variables found in a given branch need to be propagated down that branch, and a request might not need to propagate all the way along a branch before it can be answered. The partial answers from different branches are then combined. This is an interesting optimisation but does not add anything that could not be found from the full joint density function.
CHAPTER 6
Applications The point of all of the preceding theory about graphical models was to be able to use them with real data sets to solve real problems. This chapter will discuss some results obtained using the software written for this project. It will also cover some other possible uses of this technique. 6.1. Classification Suppose we have training data from multiple distributions, say {x i } and {y j } (each a point in d dimensional space). We suppose that the former are distributed with density f and the latter with density g. Consider a new observation z, known to be a sample from either f or g, but we don’t know which. The classification problem is to determine which distribution had the greatest likelihood of generating z. The example discussed in the next chapter is mushroom classification. The {x i } are some training subset of the edible mushrooms, and the {y j } a subset of the poisonous mushrooms. Here f is the distribution we presume to exist over the space of mushroom attributes for edible mushrooms, and g for poisonous mushrooms. Then given an arbitrary mushroom found in the woods, we can observe its colour, odour, etc. and use f and g to guess whether it is poisonous or edible. An important example from medical statistics occurs where we have some observations about patients in a trial, like age, gender, weight, etc. and perhaps symptoms. We also have a classification into “infected” or “not infected”, “recovered” or “did not recover”, or whatever the outcome of interest is. Classification rules could help us better treat future patients, or clarify which factors were important in determining recovery. Probabilistic methods are potentially interesting as classifiers since they naturally assign a probability, a “strength of belief”, to their decision. In classical statistics, where the densities are estimated parametrically, this kind of classification is called discriminant analysis. The key idea is that, even though we may not know f and g, we can use estimates fˆ and gˆ instead. First, let us derive some classification results. T 6.1.1. Assume we know the densities f and g. Let Z be a random variable, and z our observation of it, to be classified. Also let X be the event that z came from the same distribution as the xi , that is, from f . It is known to come from one or the other, so the prior probabilities are 83
84
6. APPLICATIONS
Pr{X} + Pr{¬X} = 1. Let c g be the cost of misclassifying a point that was really from g, and c f likewise. A classification rule is a subset C of the range R where we classify a mushroom as edible iff z ∈ C. The expected mis-classification cost is minimised by ( ) c g 1 − Pr{X} C = z : f (z) > g(z) (6.1.1) c f Pr{X} If we have no information about Pr{X}, we can take it to be 12 . We can minimise the total probability of error by taking c f = c g = 1, and our mushroom is more likely to be edible if f (z) > g(z) This optimal classifier has 1 1 Pr{error} = − 2 4
Z
| f − g| =
(6.1.2)
1 1 − L1 ( f, g) 2 4
P. (based on [Sco92, section 2.3]) The expected cost is: Z Z g(z) dz + Pr{X} c f E[cost] = (1 − Pr{X}) c g =
Z
f (z) dz
(6.1.4)
(1 − Pr{X}) c g g(z) − Pr{X} c f f (z) dz + Pr{X}c f
(6.1.5)
C
C
(6.1.3)
R\C
The rule C that minimises this is therefore equation (6.1.1). In the case Pr{X} = 21 , c f = c g = 1, the probability of error is just the expected cost substituted into theorem 2.5.3 (Scheffe’s theorem). � N 6.1.2. Minimising a cost is generally a less important application than minimising the probability of error, but it has a natural motivation in the mushroom example. There could be severe consequences if we eat a poisonous mushroom, whereas failing to recognise an edible mushroom has at most a minor economic cost, so we could take c p = 10000 and ce = 1. In both the maximum likelihood case and the penalty minimisation case, we get a linear discriminant rule with constant k of the form f (z) > kg(z)
(6.1.6)
It is also straightforward to extend this result where we have more than two populations and densities. Boosting. One suggested way of improving classification was to “boost” the importance of misclassified mushrooms by giving them a weight and repeating the density estimate. Philosophically, an integer weight is like cloning copies of those data points. The result is no longer a density for the original data but we could use the same classification rule. This was not implemented, but is a standard technique for improving the behaviour of classifiers, and might be an interesting addition.
6.2. CLUSTERING
85
Rule identification. Consider a discrete histogram h 12 (x1 , x2 ) from the training set of f (say, the edible mushrooms), and the corresponding histogram h 012 (x1 , x2 ) from the training set of g. Suppose that h12 (a, b) = 0 and h012 (a, b) > 0. This says that no sample points from the distribution f have X1 = a and X2 = b. If we assume this to be a structural zero — that f12 (a, b) really is zero — then we can infer a rule: “X 1 = a ∧ X2 = b ⇒ (X1 , X2 . . . , Xn ) is a point from distribution g”. This suggests that we could look for zero boxes in our histograms and infer a collection of boolean (non-probabilistic) classification rules. Even if (a, b) is not a structural zero, the rule may still be true with high probability. To make an evaluation of f (x) we must have values for all variables. If we only know some of the variables (components of x), we need to project the density accordingly. A boolean rule has the great computational advantage that it only needs to be tested against the variables involved. The reverse procedure will arise in the next chapter, where we use known rules to construct a graph for the mushroom data set.
6.2. Clustering In classification we have a partition of the data into known classes, such as edible or poisonous, infected or not infected. We look for rules to place unknown points into one of these classes. If we do not know what classes there might be, we can try to identify clusters of “similar” or “close together” points. Unlike classification, it is not immediately obvious that a cluster of points found by a statistical algorithm has any real meaning. Despite this, a variety of clustering algorithms are routinely used in data analysis. Sometimes a cluster will have a domain specific interpretation, and therefore reveal useful information. For example, in an insurance database, it might find a bunch of similar anomalous claims. It would be interesting to see whether a clustering of the mushroom data could find groups that resembled a biologist’s taxonomic classification. (This information is not available in the database used). A cluster may also approximately resemble a parametric model that we can then use to improve the estimate: for example, we might find four clusters that were nearly normal, and fit a four-modal model. Metrics. It is necessary to have a metric on the domain R, say ρ(x, y). Euclidean (l 2 ) distance is usually considered a good default choice, even on mixtures of continuous variables and discrete variables that have appropriate numerical interpretations. Note, though, that Aggarwal et. al [AHK01] argue for the superiority of the l1 “Manhattan” P metric, ρ(x, y) = |xi − yi | on the grounds that lp metrics are more and more drastically afflicted by the curse of dimensionality as p increases. The problem of choosing a metric is slightly different in discrete spaces because the data is not necessarily as “sparse” as data in a high dimensional continuous space. Rather, the
86
6. APPLICATIONS
question is how “close” two discrete points are, when the different dimensions might be qualitatively quite different. Density clustering. Densities are a natural instrument to use for clustering, because a high density means that there is more data nearby than elsewhere in the space. In two dimensions we can find quite good clusters by taking a threshold p, and partitioning the space into connected sets where f (x) > p. It is normally too difficult to identify these threshold sets directly in high dimensional spaces, but many clustering algorithms based on a density resemble this idea. Hill-climbing. A well established way to use densities for clustering is called “hillclimbing”. It requires a density with some sort of derivative, which we then follow upward in a sequence of steps. A local maximum of a density function is also called a mode, and mode hunting is closely related to clustering. Starting at each data point, we determine which mode it is attracted to, and collect all such points into clusters. These clusters can be further merged, joining low density clusters to other “nearby” clusters. Hill-climbing can find clusters of nearly arbitrary shape and can be tuned to find different numbers of clusters. On the other hand, it requires a differentiable density, and would seem likely to suffer from the curse of dimensionality. Despite this, Hinneburg and Keim [HK98] reported success using hill-climbing up an estimate made with straightforward Gaussian kernel estimators. We have already made some remarks about the technicalities of this kind of estimator in section 5.10, including ways that this technique might be integrated with graphical models. Now we will briefly mention the empirical application reported in that paper, as it is an interesting example of clustering in action. A protein molecule consists of long chains of amino acids, which is normally “folded” in a geometrically stable configuration. The different folding patterns can completely change the function of the protein, and are often of considerable scientific interest. Supercomputer simulations of proteins breaking down produce enormous quantities of data, often including the angles of dozens or hundreds of molecular bonds at each time step. In this case, the the hill-climbing algorithm identified 19 clusters corresponding to the known stable states of the protein. This is reassuring, because it lends some scientific meaning to the clusters. Also, our expectation that a protein will be quite stable in those states suggests that all but a few “transition” or “noise” points will be extremely close to a cluster. This would explain Hinneburg and Keim’s reported result that the number of non-empty “cells” in their estimator was of order log p, where p was the number of data points. An approximately uniform distribution in a high dimensional space would be very likely to have p cells, each containing a single point. Protein clustering might be a potentially interesting problem to investigate using graphical models, since we might expect that the angle of a particular bond could be conditionally independent of quite large stretches of the molecule. (However, this author is not a molecular biologist).
6.3. QUERY OPTIMISATION
87
Bin-joining in discrete models. Another basic class of clustering techniques start by regarding each point as a cluster and successively joining clusters, until we feel that the clusters are somehow “distinct enough”. This has the advantage that it can help us determine a meaningful number of clusters, whereas common algorithms like “k-means clustering” require an assumption about the number of clusters beforehand. Consider a graphical model on discrete variables. The density estimate fˆ has a log-linear form X log fˆ(x) = bk log hSk (xSk ) (6.2.1) k
where the bk are constants in {−1, 1} and the hSk are histograms, that is, arrays of bins. The sequence {xSk } consists of one bin from each array with the condition that common dimensions agree. We can see that modes are likely to occur at points which project to the largest possible bins in the numerator (b k > 0) terms:
log hX2
log hX1 ,X2 X1 = 0 X2 = 0
1
1
2
4
1
1
0
7
4
2
2
1
1
3
5
0
0
log hX2 ,X3 X3 = 0
1
2
4
6 mode
mode
0
11
4
0
4
5
5
0
11
cluster in marginal
Several possible ways of mode hunting come to mind. We could choose an array and spread outward through a junction tree from its corresponding maximal clique; at each maximal clique we reached we would choose values of the new variables that gave us a partial mode. A second approach would be to identify interesting bins in several disjoint tables and try to “join them up”. A related idea is to cluster in the marginal arrays first (for example, the shaded regions above). Extend each cluster in a marginal array to the set of points in the full space that project onto that cluster. Then we can take the intersection of such clusters to give us a starting set of clusters in the full space. (We would get a large set of clusters that we could further join together.) The interesting thing about this clustering idea is that it implies a graphical model based metric: product bins are “close” if their projections are close together in many of the clique projections. This might be an interesting way to capture the idea of being “closely related” for the purpose of clustering. 6.3. Query optimisation This section will briefly introduce the application that the forward selection algorithm was developed for at Bell labs, by Deshpande et. al [DGR01].
88
6. APPLICATIONS
One of the most important tasks performed by a database management system (DBMS) is to answer queries about the data held. A query of a relational database is an expression in a relational algebra which must be carried out as a series of internal operations on data tables. Such a series is called plan. The more complex the query is, the more possible plans there are. The difference between the execution times of different plans can be as much as several orders of magnitude. Query optimisation is the problem of choosing the most efficient plan to execute. The success of the query optimiser is a major factor in the performance of the database. A great deal of research has been done in this area during the history of database systems, and we will limit ourselves to the applications of density estimation. A good survey of the discipline was given by Ioannidis [Ioa96], which is the source of much of the following summary. Terminology. A database consists of tables, consisting of some (unordered) set of records each with a fixed number and type of fields. In the terms of this paper, each table is a set of sample data where a record is one data point and its fields the random variables. Thus the schema defining the fields tells us the number and type of the vertices of our graphical model. That is to say, each database table represents exactly the kind of data set we have been looking at all along. In many real tables there are more than enough fields to consider the data set “high dimensional”. A database often has to perform many queries on tables that change relatively little. If a density estimate can speed up the queries, it could be worthwhile to put some CPU time into finding a model for that table. Uses of density estimates. There are at least three possible ways a database could use a density estimate: (1) Selectivity estimation: estimating the size of intermediate result sets in order to optimise queries. (2) Exact aggregate answers. For example, if we have a histogram of the values of a “gender” field, we can give an exact answer to the question “how many males are there?” purely from the histogram. (An aggregate query is one where the answer is a count, a sum, a maximum, or some other summary property of the set defined by the relational algebra). This requires the histogram to include all the data, and can typically only answer limited kinds of queries. (3) Approximate aggregate answers: a traditional database only returns exact answers to queries. In many emerging applications, it is more important to return an approximate answer quickly, perhaps with a refined answer to follow. An approximate density estimate can give a rapid estimate of the answer to many kinds of aggregate questions. Selectivity estimation is by far the most important and heavily researched. A simple example will demonstrate why. (This is based upon an example given by Ioannidis, although the names have been changed).
6.3. QUERY OPTIMISATION
89
An example query. Suppose we have a university enrolment database with four tables: students: enrolments: courses: departments:
W1 = name, W2 = stud. no., W3 = fees owed, W4 = international student? X1 = stud. no., X2 = course no. Y1 = course name, Y2 = course no., Y3 = dept. no. Z1 = dept. name, Z2 = dept. no.
There will be one entry for each student, course and department in the respective tables, each with a unique number. If a student with number s is enrolled in courses c 1 , c2 , c3 , there will be three records (s, c1 ), (s, c2 ) and (s, c3 ) in the “enrolments” table. This is a very common way of representing information in relational databases. To extract a list of students enrolled in course number C we perform a relational algebra operation called a join:
select [and report] name from [the tables] students, enrolments where students.stud_no=enrolments.stud_no and enrolments.course_no=C (this formulation is based on the “Standard Query Language”) In relational algebra the table resulting from a join is written students ./ enrolments. In principle, we could answer this by forming the complete cross product of tuples (W 1 , W2 , X1 , X2 ) from the tables “students” and “enrolments”. Then we would discard any where X 2 , C or W2 , X1 , and the remaining W1 values are the names we want. In practice there are several more efficient algorithms to perform joins. To get a list of the departments teaching students who owe us money, we could make the following query: (this may give us multiple results per student)
select name, course name, dept. name from students, enrolments, courses, departments where students.stud_no=enrolments.stud_no and enrolments.course_no=courses.course_no and courses.dept_no=departments.dept_no and fees owed > $500.00 and (not international_student) This asks for a selection on the fields “fees owed” and “international student” as well as three joins: students to enrolments (S ./ E), enrolments to courses (E ./ C), and courses to departments (C ./ D). Selections (filtering) can often be combined, but joins can only be performed on one pair of tables at a time.
90
6. APPLICATIONS
That suggests five possible plans, since joins are commutative 1: 1: 2: 3: 4: 5:
(S ./ (E ./ (C ./ D))) ((S ./ (E ./ C)) ./ D) ((S ./ E) ./ (C ./ D)) (S ./ ((E ./ C) ./ D)) (((S ./ E) ./ C) ./ D)
These plans have quite different resource requirements. If we first join enrolments and courses (2 or 4), the intermediate results table is going to be the same size as the enrolments table: probably several times the number of students. If we first join students and enrolments (3 or 5), we only need to include all the courses taken by students who owe money, and there might not be many records like this. Large intermediate tables not only require extra storage, they are also much slower to process. Therefore the speed with which we can answer this query depends upon picking the right plan before we look at the data. This in turn requires an accurate cost estimator that can guess how long each plan would take. In this example, if we only knew the table sizes, we might conclude that joining students to courses was the worst possible first step. But, if few students owe us money, it is probably the best possible first step. A density estimate fstudent allows us to estimate the number of students satisfying the selection predicate as (number of students)× Pr{W 3 > 500 ∧ ¬W4 }. A good density estimate can give us an accurate prediction of the size of our intermediate result set, which is the key to picking the best join order. This example was quite a straightforward query with only three joins. What if we have to join ten tables, or we select on eight different attributes in a single table? There are many other factors to take into account that we have not mentioned here, but it is clear that a density estimate can be of significant benefit in query optimisation. Current commercial databases (including leading products from IBM, Oracle, and Microsoft) maintain one dimensional histograms for this purpose and assume full independence, equivalent to a graphical model with no edges. (In our example, owing fees and being an international student are unlikely to be independent, but this assumption would calculate Pr{W3 > 500} × Pr{¬W4 }) This independence assumption is known to be almost always wrong, as many pairs of attributes in real data sets are very strongly correlated, letting alone three dimensional interactions. Incorporating higher dimensional estimates has proved to be frustratingly difficult. Even quite recent papers like [PI97] and [YF01] spend considerable effort trying to squeeze an extra bit of accuracy out of low dimensional histograms. “Wavelet” methods have attracted some interest but are still under development. (Some efficiency issues to do 1some join algorithms are not commutative in cost, even though the resulting tables are the same.
6.3. QUERY OPTIMISATION
91
with both approaches are discussed in [GKMS01]. For example, in a database context, it really does matter exactly how fast an algorithm determines its histogram bin boundaries.) Practical issues. Deshpande et. al (DGR) implemented forward selection of graphical models for query optimisation and reported good results, although further work will be required to really prove the usefulness of this technique. Overall, this seems like an excellent idea. Some of the major challenges in this application are to keep the density estimate up to date with a changing database, to minimise the space required to store the estimate, and to ensure that both estimation and evaluation use very little CPU time. All of these were addressed to some extent in their report. These are different requirements from those of a data mining application and resulted in some different design decisions. For example, they limited the quantity of storage to be shared between all the marginal density estimates. Despite some difficulties, histograms have two major advantages over other estimators: it is possible to evaluate them at particular points extremely quickly, and it is easy to update them incrementally. The latter requires that each histogram bin stores an unsigned integer count rather than a probability, and keeping a separate total of the number of points in the table. When a record is added or deleted from the database, the histogram counts can be incremented or decremented accordingly. A graphical model using histograms as marginal estimators could also keep up to date in this way. If the data changed substantially then the graph may no longer be a good model and might have to be rebuilt. Algorithm issues. It is important to note that over-fitting is not a problem in this application, but that the model can still become worse if too many edges are added. The entropy-based stopping rules used were discussed in section 5.7. Bear in mind that the accuracy of the density estimate is only important insofar as it improves query performance. Distributed computing. Parallel and distributed databases are an interesting research area that appears to be in relative infancy. Suppose a query is to be split between different machines, perhaps in widely differing locations. The size of intermediate result could translate into a very large communication cost to transmit those results, and a good selectivity estimate would therefore become far more valuable. Using queries to improve the graphs. A selection condition in a query often applies to a comparatively small subset of the variables. An optimisation discussed at the end of the previous chapter can reduce the cost of evaluating the marginal estimate by propagating the query through part of a junction tree. However, the evaluation will be even faster if the relevant variables are contained in a single maximal clique, or whose spanning tree within the junction tree is as small as possible. Particular combinations of variables are likely to appear together repeatedly in selection queries, and these could be identified by recording a number of queries and applying standard association-rule finding algorithms.
92
6. APPLICATIONS
If fields X, Y and Z are frequently in queries together it might be worth joining them up in our model graph, even if they have appear to have some conditional independence. More radically, we could use information about such query associations to completely rebuild the graph (with forward selection) in order to answer selectivity estimation queries more quickly. We probably need to rebuild the graph every so often in a changing database anyway. How to include such association information in the edge selection rule is not immediately clear. However, the process of collecting association rules and periodically rebuilding the graphical model could all happen on-line within the database. 6.4. Relationship to Bayesian networks The graphs in this thesis have been undirected: if (X, Y) is an edge then (Y, X) was considered to be the same edge. If we consider these to be different edges we obtain a directed graph, conventionally depicted by drawing (X, Y) with an arrowhead pointing to Y. Graphical models based upon directed graphs are called Bayesian networks. They have almost exclusively been used with discrete valued random variables. A typical application would be to medical diagnosis, as in the following trivial example:
sniffle �� � cough
�
fever �� � � ��� � � � �� �� � ’flu virus
Instead of having marginal densities on the cliques, each edge (X, Y) has an associated contingency table describing the possible values of Pr{Y | X}. The Bayesian interpretation of probability regards it as a measure of our belief, given what we know. If a patient comes to us with a sniffle, we can determine the probability that they have a virus or the flu. Once we can establish that they do not have a fever, we update the probability (our belief) that they have the ’flu. Should we then learn that they have a cough or that we were mistaken about the fever we would further modify the probabilities. This process is called belief updating: when we obtain new information about a random variable we recalculate the probability that we accord to events in other random variables. Information can move both along and against the direction of the arrows, but it is conventional to direct the arrows from “causes” or “observable events” to “outcomes” or “diagnoses” (where these are known). Ease of belief updating is the basic reason for many people’s use of Bayesian networks, although it is possible to use them as a general density estimation tool. Temporal and spatial connections. Directed graphical models have been very successful in modelling relationships involving time. They are good at modelling events that follow other events; “causes” and “symptoms”; or “measurements” and “diagnoses”. (“Causality” is the topic of somewhat controversial current research: can we distinguish causality from correlation using Bayesian networks? And if so, how?)
6.5. RELATIONSHIP TO SPARSE GRIDS
93
Undirected models have traditionally been more successful with — for example — spatial data, where two variables may be correlated but “directions” on edges would not be meaningful. Similarities of theory. To introduce Bayesian nets would take another few chapters. A standard book is Pearl [Pea88], which approaches the topic from its traditional roots in machine learning and artificial intelligence. Lauritzen [Lau96] also spends considerable time developing results about directed graphs. Many of these results are quite similar to the theory of chapters 3 and 4, albeit slightly more complex. For example, there are Markov properties describing conditional independence in directed graphs. Given a directed graph G = (V, E), there is an important construction which Lauritzen calls the moral graph2 . Note that a vertex X is a “parent” of a vertex Z if (X, Z) ∈ E, that is, there is an edge going from X to Z. The moral graph is an undirected graph with the same vertices as G where we “throw away the arrowheads” and turn all edges into undirected edges. Additionally, for every vertex Z, the moral graph contains all edges (X, Y) between parents of Z. While it is not possible to discuss the significance of the moral graph here, we note that the undirected graphical model it defines gives us important information about the behaviour of the Bayesian net. It is common to add edges to the moral graph until we get a chordal graph. Not all chordal graphs obtained this way are equally useful — we would like to minimise the complexity of the resulting junction tree. Finding a “triangulation” that gives us an optimal junction tree is believed to be NP-hard, and algorithms for finding nearly optimal trees are the subject of ongoing research (see Jensen and Jensen, and Becker et. al [BG96]) The moral graph has at least as many edges as the original directed graph, and quite possibly more. The extra connections are necessary to turn the directed Markov properties into undirected Markov properties. One of the justifications for the use of Bayesian nets is that by using the “richer” directed graphs it is possible to have fewer edges when modelling the same data. Anyway, we can construct the moral graph, triangulate it, and find a junction tree. This junction tree allows us to break down the problem of inference in the Bayesian net in a similar way to the decomposition of our density estimate in chapter 4. So the theory presented in this thesis has some direct bearing upon Bayesian nets also. 6.5. Relationship to sparse grids Sparse grids are a quite general technique for overcoming the curse of dimensionality, whose use as high dimensional density estimators was mentioned in chapter 2. An interesting observation is that a graphical model corresponds to a particular choice of grids in the sparse grid algorithm. Consider the three dimensional case, where the 2apparently, because it “marries parents”.
94
6. APPLICATIONS
vertices of the graph are {X1 , X2 , X3 }. The graph with no edges corresponds to a full one dimensional grid on each variable, and no other grids. The complete graph corresponds to the full joint grid. A graph with (X 1 , X2 ) and (X2 , X3 ) corresponds to a full 2D grid on X1 and X2 , a full 2D grid on X2 and X3 , and full 1D grid on X2 representing the separator. On each grid we need to estimate the logarithm of the density rather than the density itself, but the grid choices described will produce the same log-linear structure as the graphical model. It would be interesting to compare the performance of sparse grids and graphical models as density estimators on continuous and on discrete variable spaces.
CHAPTER 7
Outcomes and observations Up to this point, we have either been building a foundation of mathematical theory or surveying a range of interesting and topical problems that we expect the theory could help us with. The difficulties inherent in real high dimensional problems have motivated us to go beyond theory that we can rigorously prove. We have considered various heuristics, for example “greedy” algorithms, that do not have guaranteed behaviour. Having done so, we have two questions: how well do our algorithms work, and how can we understand them better? To answer these questions we need to perform experiments with data, and the first part of this chapter includes a detailed evaluation of different heuristics as applied to a classification problem. This evaluation includes conventional plots of performance measures like entropy, which we have been developing for several chapters. It also includes various kinds of computer generated diagrams. Performance measures are useful, but it is visualisation that is the key. Visualisation is often seen as a tool with which to explore and understand data, and that is certainly important. Our use here, though, is to better understand the behaviour of algorithms. 7.1. Classification of mushrooms: a case study The data set investigated was a tabulation of observations about 8124 different species of agaricus lepiota mushrooms. Each record consisted of 23 categorical attributes including colours, odour, physical structure and habitat. It also recorded whether mushrooms were known to be edible or were considered poisonous. The data is available from the UCI repository of machine learning data sets [UCI, mushrooms]. This data set was chosen for testing the graphical model code because: • the absence of continuous variables meant that only discrete histograms had to be implemented • the classification problem (determine edibility given other attributes) provided a clear target and performance measurement • with 23 attributes, the data is certainly “high dimensional”, but the documentation suggested that the classification could be done with at most three dimensional interactions (see below). • there were more data points than many comparable public data sets 95
96
7. OUTCOMES AND OBSERVATIONS
Classification was implemented as described in the previous chapter: the data points were divided into “edible” and “poisonous” sets that were used to estimate densities f e and fp . These estimates were based upon different graphs G e and Gp . No cost function was used, only the rule to minimise the probability of classification error. This is given by equation (6.1.2), which classifies a mushroom x as considered poisonous if f p (x) ≥ fe (x). At every step of the algorithm, we add to exactly one of G e or Gp either one edge, or one vertex (if we started with the constant functions). Edges and vertices can be added in any order to either graph as long as both graphs remain chordal. Edge addition was performed using the forward selection algorithm. The edge or vertex to add was either selected as the one with the largest ∆H or the one that most improved the classification. A “best candidate” was found for each of G e and Gp , and the two candidates were compared according to the same criterion. For example, in the entropy case, the algorithm chooses the edge or vertex whose addition gives the largest ∆H for its graph. The purpose of this section is not to comprehensively analyse the mushroom data. Instead, we would like to give a flavour for how the code performed on this data set when using different variants of the algorithm. There are four choices to make: (1) Which forward selection criterion to use: entropy minimisation or classification score maximisation. (2) Whether to apply the model to all 22 variables, or to use only the 6 variables (listed below) that are known to be sufficient for correct classification. The edibility attribute was used to partition the data into the training sets for f and g, and is not a dimension. (3) Whether to start with constant functions or with a product of independent onedimensional histograms. (4) Should the model be trained and then tested on the complete set of mushrooms, or should the program randomly partition it into test data, edible training data, and poisonous training data? Models formed using a 50/50 split of test and training data were in practice indistinguishable from models that were trained and tested on the entire set. So, point (4) has been ignored and every model to be discussed was trained and tested on the entire set. Introduction to the results. The eight remaining algorithm permutations were each run until they either chose to stop, or perfectly classified every mushroom. The entropy minimiser never stopped before finishing, while the score minimiser sometimes stopped because no single edge or vertex improved the classification score. The following four figure pages summarise the results, and comment upon interesting behaviour observed. In these plots, the thinly ruled lines represent the entropy minimiser and the heavy lines represent the score maximiser. Red lines plot the cumulative total of ∆H improvements to either model against the right side Y axis. Blue and black lines plot the proportion of edible and poisonous mushrooms (respectively) that were misclassified.
7.1. CLASSIFICATION OF MUSHROOMS: A CASE STUDY
97
These are plotted against the left Y axis, in units of “errors per thousand mushrooms”. Since at step zero this is generally well off the scale, that point has been omitted from many plots. The model graphs are shown in their final form, as exported from the forward selection program when the algorithm stopped. They have not been edited, although in some cases the dashed lines indicating eligibility have been suppressed. Prior knowledge. There are two other ways of fitting a graph: using prior knowledge of the data, and interactive trial and error. Trying the latter is instructive but is not relevant to our present discussion. By “prior knowledge”, we mean information about the data that was not obtained by the present algorithm. In this case we do have some such knowledge. The documentation accompanying the mushroom data suggests a sufficient set of nonprobabilistic classification rules. A mushroom will be correctly classified as poisonous if and only if it satisfies any of the following: (1) (2) (3) (4)
odor < {almond,anise,none} spore-print-color=green odor=none and stalk-surface-below-ring=scaly and stalk-color-above-ring,brown habitat=leaves and cap-color=white
This directly suggests the following graph for both edible and poisonous mushrooms (the vertex numbers are indices into the original 23 fields): 14:stalk−surface−below−ring
6:odor
4:cap−color 15:stalk−color−above−ring
21:spore−print−color
23:habitat
With this graph, our program correctly identifies all the poisonous mushrooms. However, it incorrectly classifies 16 edible mushrooms as poisonous, even when trained on the entire data set. (Those 16 consist of only two distinct tuples when projected to these six dimensions.) Our partial success is not too surprising, because the rules above use boolean logic, and we are using a probability estimate. The rule says that we will never see edible white mushrooms growing in leaves. Therefore we can be sure the edible mushroom histogram has he,X4 ,X23 (leaves,white) = 0 while we expect the corresponding value of h p,X4 ,X23 to be positive. (If it were zero, we would have a tie: f p = fe = 0. The program reports whether ties occur, and none did). Having cliques corresponding to the rules ensures that we correctly recognise poisonous mushrooms. On the other hand, our probabilistic method can regard mushrooms as suspicious under other circumstances, including cases where fe is not zero but fp > fe .
98
7. OUTCOMES AND OBSERVATIONS
F 7.1.1. Model performance on 6 variables, starting with constants Entropy
���
�
incorrectly edible incorrectly poisonous
� � � � �!" � !
���
� ��� � ��� � ��
��� �
�
�
���
���
���
Cumulative ∆H
Mis-classification rate ×1000
� �
���
Algorithm step Entropy minimisation Ge
Score maximisation Ge 14:stalk−surface−below−ring
14:stalk−surface−below−ring
6:odor
6:odor
15:stalk−color−above−ring 15:stalk−color−above−ring
21:spore−print−color 21:spore−print−color
4:cap−color
4:cap−color
23:habitat
23:habitat
Gp
Gp
14:stalk−surface−below−ring 14:stalk−surface−below−ring
15:stalk−color−above−ring 15:stalk−color−above−ring
4:cap−color
4:cap−color
21:spore−print−color 21:spore−print−color
6:odor
6:odor
23:habitat
23:habitat
The “open circles” here represent variables that are withheld from the graph, ie. modelled with constant functions. Dashed lines denote eligible edges; red dashed lines have beneficial ∆H < 0. The score maximiser gets stuck after four steps, but until then is doing approximately as well as the entropy method. The two ∆H curves are surprisingly similar. We can think of the score maximiser as “pushing the blue line downward” and the entropy method as “pushing the red line downward”, but the effects are often the same. The entropy method exhibits a preference for adding vertices first, then cliques of size 2, and doesn’t form any cliques of size 3.
7.1. CLASSIFICATION OF MUSHROOMS: A CASE STUDY
99
F 7.1.2. Model performance on 6 variables, starting with 1D histograms
�
incorrectly edible incorrectly poisonous
�#�
Entropy
� �
���
� �
���
� �
�
� � �
� �
Cumulative ∆H
Mis-classification rate ×1000
� �
��� "
Algorithm step Entropy minimisation Ge
Score maximisation Ge
14:stalk−surface−below−ring
6:odor
15:stalk−color−above−ring
21:spore−print−color
14:stalk−surface−below−ring
4:cap−color
6:odor
15:stalk−color−above−ring
23:habitat
21:spore−print−color
4:cap−color
23:habitat
Gp
Gp 14:stalk−surface−below−ring
15:stalk−color−above−ring
21:spore−print−color
6:odor
14:stalk−surface−below−ring
4:cap−color
23:habitat
15:stalk−color−above−ring
21:spore−print−color
6:odor
4:cap−color
23:habitat
This case is similar, although the initial model is much richer. The score minimiser gets stuck after only two steps. It takes the entropy method 7 steps to beat that same score, but it eventually reaches a perfect classification after 9 steps. Dashed lines have been omitted from the left hand graphs. The grey dashed lines are equivalent to the red lines; their entropy just hasn’t been calculated yet. It is curious that the entropy method sees benefit in fully spanning Gp and the score method adds no edges to it at all.
100
7. OUTCOMES AND OBSERVATIONS
F 7.1.3. Model performance on 22 variables, starting with constants
�#�
�
incorrectly edible incorrectly poisonous
Entropy
� � � ���
���
� �$� � ���
��� �
� �#� �
���
���
���
Algorithm step Entropy minimisation Ge
Score maximisation Ge
8:gill−spacing 9:gill−size 10:gill−color 11:stalk−shape 12:stalk−root
7:gill−attachment 6:odor 5:bruises?
8:gill−spacing 9:gill−size 10:gill−color
4:cap−color
11:stalk−shape
3:cap−surface
12:stalk−root 13:stalk−surface−above−ring 14:stalk−surface−below−ring 15:stalk−color−above−ring 16:stalk−color−below−ring 17:veil−type 18:veil−color
7:gill−attachment 6:odor 5:bruises? 4:cap−color 3:cap−surface
2:cap−shape 13:stalk−surface−above−ring
23:habitat
14:stalk−surface−below−ring
22:population 21:spore−print−color 20:ring−type 19:ring−number
15:stalk−color−above−ring 16:stalk−color−below−ring 17:veil−type 18:veil−color
2:cap−shape 23:habitat 22:population 21:spore−print−color 20:ring−type 19:ring−number
Gp
Gp 8:gill−spacing 9:gill−size 10:gill−color 11:stalk−shape 12:stalk−root
7:gill−attachment 6:odor 5:bruises? 4:cap−color 3:cap−surface
8:gill−spacing 9:gill−size 10:gill−color 11:stalk−shape 12:stalk−root
13:stalk−surface−above−ring 14:stalk−surface−below−ring 15:stalk−color−above−ring 16:stalk−color−below−ring 17:veil−type 18:veil−color
7:gill−attachment 6:odor 5:bruises? 4:cap−color 3:cap−surface
2:cap−shape 23:habitat 22:population 21:spore−print−color 20:ring−type 19:ring−number
13:stalk−surface−above−ring 14:stalk−surface−below−ring 15:stalk−color−above−ring 16:stalk−color−below−ring 17:veil−type 18:veil−color
2:cap−shape 23:habitat 22:population 21:spore−print−color 20:ring−type 19:ring−number
This case is probably the hardest challenge for the algorithm, because it has to work out which variables are important before it can add edges between them. The score minimiser initially does much better than the entropy method but soon gets stuck. The entropy method’s score hits a plateau for many steps in which it adds vertices that don’t appear to improve the classification. This approach eventually pays off, because the two dimensional interactions added in the last few steps are extremely helpful. The score maximiser cannot consider any of the edges from the left hand graphs, because it never introduced the relevant variables.
Cumulative ∆H
Mis-classification rate ×1000
� �
7.1. CLASSIFICATION OF MUSHROOMS: A CASE STUDY
101
F 7.1.4. Model performance on 22 variables, starting with 1D histograms Entropy
�
incorrectly edible incorrectly poisonous
�#�
� �
���
� �
���
�!"
�
Cumulative ∆H
Mis-classification rate ×1000
� �
�! �
�
�
��� "
���
Algorithm step Entropy minimisation Ge
Score maximisation Ge 8:gill−spacing 9:gill−size 10:gill−color 11:stalk−shape
8:gill−spacing 9:gill−size 10:gill−color 11:stalk−shape 12:stalk−root
12:stalk−root
7:gill−attachment 6:odor 5:bruises? 4:cap−color
13:stalk−surface−above−ring
3:cap−surface
14:stalk−surface−below−ring 15:stalk−color−above−ring
13:stalk−surface−above−ring 14:stalk−surface−below−ring 15:stalk−color−above−ring 16:stalk−color−below−ring 17:veil−type 18:veil−color
2:cap−shape
16:stalk−color−below−ring 17:veil−type 18:veil−color
23:habitat
7:gill−attachment 6:odor 5:bruises? 4:cap−color 3:cap−surface
2:cap−shape 23:habitat 22:population 21:spore−print−color 20:ring−type 19:ring−number
22:population 21:spore−print−color 20:ring−type 19:ring−number
Gp
Gp
8:gill−spacing 9:gill−size 10:gill−color 11:stalk−shape 8:gill−spacing 9:gill−size 10:gill−color 11:stalk−shape 12:stalk−root
7:gill−attachment 6:odor 5:bruises? 4:cap−color 3:cap−surface
12:stalk−root
13:stalk−surface−above−ring 14:stalk−surface−below−ring 15:stalk−color−above−ring
13:stalk−surface−above−ring 14:stalk−surface−below−ring 15:stalk−color−above−ring 16:stalk−color−below−ring 17:veil−type 18:veil−color
2:cap−shape 23:habitat
16:stalk−color−below−ring 17:veil−type 18:veil−color
7:gill−attachment 6:odor 5:bruises? 4:cap−color 3:cap−surface
2:cap−shape 23:habitat 22:population 21:spore−print−color 20:ring−type 19:ring−number
22:population 21:spore−print−color 20:ring−type 19:ring−number
The initial model here consists of 22 indepedent histograms, including good predictors like “odor” and “spore-print-color”. It only gets 21 edible and 3 poisonous mushrooms wrong! The entropy method goes crazy adding edges and eventually brings this down to a perfect score. The score maximiser manages this feat with a single edge addition, to give one of the simplest models in all four figures. It is interesting that this is the same edge (16, 23) that the entropy method added to G e in the previous case. However, finding this edge took around 15 minutes — longer than the entire 11 steps of the entropy algorithm, which only took about a minute of CPU time thanks largely to theorem 5.5.2.
102
7. OUTCOMES AND OBSERVATIONS
Summary comments. (1) When starting with all the vertices in the graph (1D histograms) the classification scores improved nearly monotonically. When starting with constant functions, the scores were much noisier. The entropy method coped well with the latter, pushing through setbacks to eventually succed many steps later. The rather simple-minded score maximiser just gave up. (2) It is remarkable how smoothly the ∆H total decreases over the course of execution, despite the marked preference of the entropy algorithm for smaller clique sizes, which would suggest an appreciable difference between the ∆H scores. (3) Reducing the entropy ultimately seemed to “squeeze” down the classification error. To some extent this is a visual effect of the plot scales chosen. However, our intuition that a good density estimate would classify well seems to have been vindicated. (4) The entropy methods are much, much faster than computing a new clique graph and junction tree for each of n(n − 1) possible edges — especially when n = 22. (5) The entropy methods often beat a performance measure designed to maximise score, albeit a fairly naïve one. They normally took more steps to do so and produced more complex models as a result. 7.2. Why do we need to visualise? The Ge and Gp graphs just plotted are a form visualisation. They quickly encode a complex, high dimensional model into pictorial form, and help us see the relationships that are being identified. The limitations of a paper document have restricted us to just printing the final form of each graph, but on screen it is possible to see the evolution of each model as the algorithm progresses. Time is thus used to visualise another dimension, specifically “algorithm steps”. While this program was being written, it often exhibited surprising behaviour. For instance, why should adding an edge sometimes make the classification much worse? This is a genuinely interesting question that is difficult to understand just by staring at tables of classified data1. What we saw might also might be due to a bug in the program. The more tools we have to investigate an algorithm, the easier it will be to debug, improve, and optimise it. There is no space here to discuss the difficulties of visualising data in high dimensional space or the ingenious techniques that have been devised to attempt it. A crucial question in any visualisation is: what is the actual dimension of the effect we are looking at? If an effect is primarily two or three dimensional, then how do we find a good projection? Or a good section (slice), if applicable? Projection pursuit is often done with a principal component method, which is really a kind of weak parametric model — it assumes our data is a vaguely elliptical cloud. Because graphical models identify lower dimensional 1In the author’s experience.
7.3. INTERACTIVE FORWARD SELECTION
103
F 7.3.1. A screen capture of the interactive forward selection program in action interactions in the data, it should be possible to use them to identify interesting projections and sections. A good place to start would be visualising the density estimate generated from the graph itself.
7.3. Interactive forward selection Figure 7.3.1 shows a screen capture from the Python program written by the author. This program was used to produce many of the figures in this thesis, and accounts for nearly all the code written during the project. Here is a summary of the program’s features: • Interactive forward selection: Vertices or eligible edges can be added to the model by clicking on them. (Vertices must be clicked on with the right mouse button). • Clique graph display: the clique graph of each model is also shown. When an edge is added, the chosen CG edge (Ca , Cb ) that is to be replaced is coloured purple for a short period while the forward selection algorithm executes. It is therefore possible to visually connect the development of both the model graph and the clique graph.
104
7. OUTCOMES AND OBSERVATIONS
• The junction trees used to form the models can be highlighted in orange using the “Junc Tree” button. • The log-linear model is displayed in a condensed notation below each graph. • Each model can be reset to its initial state with the “Reset” button on the left. • One step of either the entropy minimisation algorithm or the classification score maximisation algorithm can be performed by clicking a top toolbar button. • The graphs can be rearranged to improve clarity. Vertices or sets of vertices can be selected and dragged to new locations. The “Reg G” and “Reg CG” buttons move the selected vertices in the relevant graph to be the vertices of a regular polygon. The selected vertices can also be rotated and scaled using the middle mouse button. These features proved invaluable not merely for producing figures, but also for quickly clarifying a complex graph. • Colours provide additional information, for example, the most recent edges added to each the graph and clique graph are shown in green. • The number of mis-classifications in each model are shown on the left. • One button press opens the “GGobi” software on the same data and begins sending it live classification information, as will be discussed in a moment. 7.4. GGobi GGobi is a piece of software written at AT&T research labs, and both the program and its source code may be freely used and modified. 2. It is the successor to their XGobi project. GGobi is based on newer software libraries and the experience gained with XGobi, and already seems easier to learn and easier to use than its predecessor. Overview. GGobi incorporates a number of important techniques for dealing with scattered data points in many dimensions. Some of these are discussed in Scott’s book on multivariate density estimation, [Sco92]. The techniques implemented in XGobi have been enumerated by Buja et. al [BCS96]. The most interesting feature of GGobi is its overall feeling of an aggressive pursuit of high dimensional information by whatever techniques are available. It also consistently uses interactivity to add a little extra “effective dimensionality” to the display. For example, if we have a matrix of scatterplots open, the technique of “brushing” allows us to mark clusters in one scatter-plot and see where those points fall in other two dimensional marginals. The best way to describe GGobi is really to give a demonstration, and there is insufficient space here to properly describe it. For more information, see the manual [SCBL02]. 2The GGobi license must deal with complex patent licensing issues. Consequently it does not meet the Debian
GNU/Linux project’s widely accepted definition of an “open source” license. The authors clearly intend an open source model, and it does appear to be accepted as such by its user community. Unfortunately, this prevents GGobi being shipped with the main Debian distribution, and it is difficult to think of other operating systems or distributions that would ship such a specialised statistical product. In any case, given the rapid development and somewhat unfinished state of the software, the interested reader is urged to download the latest version from www.ggobi.org and attempt to build it from the source code.
7.4. GGOBI
105
Problems and limitations. GGobi versions 0.97, 0.98 and 0.99 were used as they became available. All were quite unstable, often crashing every half hour for no apparent reason. Features such as printing or the advertised Python interface were not in a usable state. GGobi seems to be undergoing rapid development within AT&T, and these aspects are sure to improve. (A personal note: I submitted over half a dozen bug or crash reports, including further investigation and sometimes C language fixes. Some of these have already been incorporated into the 0.99 version. Some interface suggestions or requests that I made have also been implemented, for example the dual columns of radio buttons in the scatter-plot configuration interface. The previous interface was confusing.) The handling of categorical variables show evidence of forward thinking but currently has limitations. For example, category labels are mapped to integers, much as described in chapter 2. The original labels are read in from the data set but never appear in the interface: it is not currently possible to use them as axis labels. GGobi has no native 3D capabilities, in the usual sense of plotting three dimensional points with some sort of hidden surface removal. The tour/projections do allow a quite effective orthographic 3D, if we take a third basis vector at 30 degrees to the usual axis. It would also be nice to have the capability of superimposing contours or boundary surfaces on the scatterplots. Overall, the author enjoyed working with this software and thinks that it has great potential. Live classification of mushrooms. The primary way that GGobi was helpful in this project was as follows. At a particular stage of the model fitting, any given mushroom in the data set is in one of four classes: edible and correctly classified, edible but incorrectly classified, or vice-versa if the mushroom is poisonous. By exporting the data with an extra attribute denoting this class, it was easy to assign each class a distinct colour and “glyph” (for example, red crosses in the scatter-plot for misclassified poisonous mushrooms). A scatter-plot matrix gave invaluable insights into where the model was making mistakes. It could also show clearly where errors could be corrected using only two dimensional marginals. For example, suppose one of the scatterplots showed some red crosses that were not coincident with any green edible mushroom symbols. That marginal can therefore distinguish those mushrooms and ought to correct their classification. Unfortunately, performing this classification and data export at every step of the algorithm was time consuming and tedious. Worse, it was necessary to set up all the plots again when loading new data. GGobi has a “plug-in” mechanism to allow users to extend its capabilities (see [LS02]). The author wrote a simple plug-in called “LiveGlyph” to solve this problem. With the aid of the plug-in, the data is only loaded once and can be plotted in any way the user desires. Every time the interactive forward selection reclassifies the data, it communicates those results to GGobi, which then updates the colours and glyphs
106
7. OUTCOMES AND OBSERVATIONS
of each point. (The UNIX operating system’s “named pipes” were the communication mechanism used). The result is that a user can see the classification “in action” on the data using whatever tools GGobi provides.
CHAPTER 8
Conclusion and final remarks We began with an interest in high dimensional data sets, and the observation that many traditional statistical tools are difficult to apply to them. The proposed solution has been to estimate non-parametric density functions using graphical models. These graphical models are fitted to our data using the forward selection algorithm of chapter 5, directed by some heuristic ideas. Although we have been motivated by the desire to implement efficient algorithms, we have nevertheless encountered some very elegant theory, particularly the graph theory in chapter 3. All along the way, mathematics has provided the ways of structuring, estimating, and evaluating the models we have coded. A few of the many conceivable applications of this technique were discussed in chapter 6, which is packed full of possible avenues for further research. Such research would fall into the following broad categories: (1) The need for stronger theory about graphical models as statistical instruments, particularly when used to construct non-parametric models. (2) Further empirical studies on different data sets, with a particular view toward gaining a better understanding of the strengths and weaknesses of this technique. (3) Improvement and optimisation of the core algorithms to increase speed and reduce resource requirements. Also, the use of graphical models with estimators other than histograms. (4) Comparison with other techniques such as sparse grids. (5) Development of some of the possible application areas, such as clustering or visualisation. Data mining applications with extraordinarily large data sets will pose particularly interesting problems. (6) Integration of discrete and continuous variables into the same model. Mixed discrete and continuous variable models have received considerably theoretical attention in this thesis but were never implemented. We saw that graphical models ought to deal quite well with mixed variable types, albeit with a few technicalities. There is surprisingly little literature about this possibility given that many real data sets do have such a mixture. We close with the conclusion stated in the introduction chapter: graphical models are a very powerful tool for modelling high dimensional data, having both practical applications and intriguing possibilities.
107
APPENDIX A
Selected Code This is the core of the forward selection algorithm as implemented in ForwardSelector.add_edge in the module forwsel.py. Some debugging constructs, assertions, and recording of changes for the benefit of the interface have been elided. Code relating to the “speculative” option for efficient greedy search has also been taken out. This is intended for readability rather than as a record of the actual code.
A.1. Addedge.py – Sun May 26 2002 1 class ForwardSelector: 2 def add_edge (self, va, vb) : 3 Notation: Cx denotes a maximal clique label
Ca; Cb = some maximal cliques containing va; vb Likewise S = Ca intersect Cb, minimal separator of a and b Cab=S+va+vb Sa = S+va, Sb = S+vb
11 12 13 14 15 16 17 18
Vab is the actual list of vertices in Cab etc., and VS is the vertices of S edgedata ← self.EfM[va][vb] Ca ← edgedata.CG_edge.a Cb ← edgedata.CG_edge.b if va < self.cliques[Ca].v : (Ca, Cb) ← (Cb, Ca) (S, Sa, Sb, Cab) ← self.get_sep_cliques (va, vb, edgedata) VS ← self.cliques[S].v CG ← self.CG
20 21 22 23 24 25 26
1) Compute lists of vertices connected to v a and vb in GV\Sab Gsub ← copy.copy (self.G) Gsub.del_vertices (VS) conn_a ← Gsub.connected (va) conn_a.append (va) conn_b ← Gsub.connected (vb) conn_b.append (vb)
109
110
A. SELECTED CODE
28 29 30 31 32 33
Begin updating the clique graph CG.add (Cab) CG.del_un (Edge (Ca, Cb)) self.CG_edges_to_process ← [ ] self.new_CG_edge (Ca, Cab, Sa, CG) self.new_CG_edge (Cb, Cab, Sb, CG)
35 36 37 38 39 40 41
2) Remove edges that are no longer needed T ← self.cliques[S].sep_for_edges nT ← len (T) for m ∈ range (nT − 1, −1, −1) : t ← T[m] CminusS ← set_subtract (self.cliques[t.a].v, VS) DminusS ← set_subtract (self.cliques[t.b].v, VS)
# Edge (C a , Cab ) with separator Sa
43 45 46
Find representative vertices These ought not to be empty! v1 ← CminusS[0] v2 ← DminusS[0]
48 50 51
if (v1 ∈ conn_a ∧ v2 ∈ conn_b) ∨ (v2 ∈ conn_a ∧ v1 ∈ conn_b) : CG.del_un (t) # Delete undirected edge del T[m]
53 54 55 56 57 58 59 61 62 63 64 66
3.1) Add new edges based on neighbours of C a , Cb Vab ← self.cliques[Cab] for (vx, Sx, Cx) ∈ ((va, Sa, Ca), (vb, Sb, Cb)) : Y ← self.cliques[Sx].v Edges (t,Cx) for t ∈ CG.to[Cx] : if (t.sep_clique , Sx) ∧ is_subset (self.cliques[t.sep_clique].v, Y) : self.new_CG_edge (t.a, Cab, t.sep_clique, CG) Edges (Cx,t) for t ∈ CG.fr[Cx] : if (t.sep_clique , Sx) ∧ is_subset (self.cliques[t.sep_clique].v, Y) : self.new_CG_edge (t.b, Cab, t.sep_clique, CG)
68 69 70 71 72 73 74 75 76
3.2) Add new edges for C0 ∩ Cab = Sx for Cd ∈ CG.v : if Cd ∈ (Ca, Cb, Cab) : continue has_a ← va ∈ self.cliques[Cd].v has_b ← vb ∈ self.cliques[Cd].v if ¬(has_a ∨ has_b) : continue if is_subset (VS, self.cliques[Cd].v) :
A.1. ADDEDGE.PY
77 78 79 80 81
We do need to add an edge if has_a: self.new_CG_edge (Cd, Cab, Sa, CG, speculative) else : # has_b must be true self.new_CG_edge (Cd, Cab, Sb, CG, speculative)
83 84 85 86 87
4) Merge cliques if necessary if Ca = Sa : self.del_CG_vertices (Ca) if Cb = Sb : self.del_CG_vertices (Cb)
89 91
CG is now updated; 5) Update graph G self.G.add (Edge (va, vb))
93 95 96
6) Update EfM (eligible edges) First, the new edge edgedata ← self.EfM[va][vb] edgedata.eligible ← 0
98 99 100 101
Then deletion for xa ∈ conn_a: for xb ∈ conn_b: self.EfM[xa][xb].eligible ← 0
103 104 105 106
Then addition of eligible edges for CGe ∈ self.CG_edges_to_process: Cd ← CGe.a assert CGe.b = Cab
108 109 110 111 112 113 114 115 116 117 119 120 121 122 123 125
Y = Cd \ Cab Y ← set_subtract (self.cliques[Cd].v, self.cliques[Cab].v) X = Cab \ (Cd ∪ {va , vb }) X ← set_subtract (self.cliques[Cab].v, self.cliques[Cd].v + [va, vb]) for y ∈ Y : for x ∈ set_subtract ([va, vb], self.cliques[Cd].v) : edgedata ← self.EfM[x][y] edgedata.CG_edge ← CGe self.compute_edge_entropy (x, y, edgedata) edgedata.eligible ← 1 for x ∈ X : (x,y) is now eligible edgedata ← self.EfM[x][y] edgedata.CG_edge ← CGe self.compute_edge_entropy (x, y, edgedata) return (Ca, Cb, S, Cab)
111
Bibliography [AHK01]
Charu C. Aggarwal, Alexander Hinneburg, and Daniel A. Keim. On the surprising behavior of distance metrics in high dimensional space. Lecture Notes in Computer Science, 1973:420–??, 2001. http://citeseer.nj.nec.com/481093.html . [BCS96] Andreas Buja, Dianne Cook, and Deborah F. Swayne. Interactive High-Dimensional Data Visualization. Journal of Computational and Graphical Statistics, 5(1):78–99, 1996. http://www.research.att.com/areas/stat/xgobi/ . [BG96] Ann Becker and Dan Geiger. A sufficiently fast algorithm for finding close to optimal junction trees. In Twelfth conference on uncertainty in Artificial Intelligence, Portland, August 1996. Morgan Kaufmann. [Bol79] Bollobás, Béla. Graph Theory: An Introductory Course. Springer-Verlag, 1979. [Chr90] Ronald Christensen. Log-Linear Models. Springer-Verlag, 1990. [CL68] C. K. Chow and C. N. Liu. Approximating discrete probability distributions with dependence trees. IEEE Trans. Inform. Theory, IT-14:462–467, 1968. [Dev87] Devroye, Luc. A Course in Density Estimation. Birkhäuser, 1987. [DGJ01] Deshpande, Amol, Garofalakis, Minos, and Jordan, Michael I. Efficient Stepwise Selection in Decomposable Models. In Proceedings of UAI’2001, Seattle, Washington, August 2001. http://citeseer.nj.nec.com/447555.html . [DGR01] Deshpande, Amol, Garofalakis, Minos, and Rastogi, Rajeev. Independence is good: DependencyBased Histogram Synopses for High-Dimensional Data. Technical report, Bell Laboratories, 600 Mountain Avenue, Murray Hill, NJ, USA, 23 March 2001. [Fel57] William Feller. An Introduction to Probability Theory and its Applications. John Wiley and Sons, Inc., 2nd edition, 1957. [GHP95] Galinier, Philippe, Habib, Michel, and Paul, Christophe. Chordal graphs and their clique graphs. In Proceedings of the 21st International Workshop on Graph-Theoretic Concepts in Computer Science, pages 358–371, Aachen, Germany, June 1995. [GKMS01] Anna C. Gilbert, Yannis Kotidis, S. Muthukrishnan, and Martin Strauss. Optimal and Approximate Computation of Summary Statistics for Range Aggregates. In Symposium on Principles of Database Systems, 2001. http://citeseer.nj.nec.com/gilbert01optimal.html . [Gol80] Golumbic, Martin Charles. Algorithmic graph theory and perfect graphs. Academic Press, Inc., New York, NY, 1st edition, 1980. [HK98] Alexander Hinneburg and Daniel A. Keim. An efficient approach to clustering in large multimedia databases with noise. In Knowledge Discovery and Data Mining, pages 58–65, 1998. http://citeseer.nj.nec.com/hinneburg98efficient.html . [HNS00] Markus Hegland, Ole M. Nielsen, and Zuowei Shen. High Dimensional Smoothing Based on Multilevel Analysis. submitted to SIAM J. Scientific Computing, 2000. http://datamining.anu.edu.au/publications/2000/hisurf2000.ps.gz . [Hon02] Hong Ooi. Density Visualization and Mode-Hunting Using Trees. to appear in the Journal of Computational and Graphical Statistics, June 2002. [Hoo99] Giles Hooker. Developing a spline-smoothed density. Bachelor of science honours thesis, Australian National University, November 1999.
113
114
[Ioa96] [JJ94] [Lau96] [LS02] [Mal91] [NR01] [Pea88] [PI97]
[Rud66] [SCBL02] [Sco92] [Sed98] [Shi88] [Sil86] [UCI] [Whi90] [YF01]
BIBLIOGRAPHY
Yannis E. Ioannidis. Query optimization. ACM Computing Surveys, 28(1):121–123, 1996. http://citeseer.nj.nec.com/ioannidis96query.html . Jensen, Finn V. and Jensen, Frank. Optimal Junction Trees. In Proceedings of the Tenth Conference on Uncertainty in Artificial Intelligence, July 1994. Lauritzen, Steffen L. Graphical Models. Clarendon Press, Oxford, 1996. Duncan Temple Lang and Deborah F. Swayne. Extending GGobi’s Functionality with Plugins. http://www.ggobi.org/plugins.pdf , 20 February 2002. Malvestuto, Francesco M. Approximating Discrete Probability Distributions with Decomposable Models. IEEE Transactions on Systems, Man, and Cybernetics, 21(5):1287–1294, September 1991. Ole M. Nielsen and Stephen Roberts. Density estimation using sparse grids. (personal communication), November 2001. . Judea Pearl. Probabilistic reasoning in intelligent systems. Morgan Kaufmann Inc., San Mateo, California, 1988. Viswanath Poosala and Yannis E. Ioannidis. Selectivity estimation without the attribute value independence assumption. In The VLDB Journal, pages 486–495, 1997. http://citeseer.nj.nec.com/poosala97selectivity.html . Walter Rudin. Real and Complex Analysis. McGraw-Hill, 1966. Deborah F. Swayne, Dianne Cook, Andreas Buja, and Duncan Temple Lang. ggobi Manual. Technical report, AT&T Labs - Research, March 2002. http://www.ggobi.org/manual.pdf . David W. Scott. Multivariate Density Estimation. John Wiley & Sons, 1992. Robert Sedgewick. Algorithms in C: part 5 graph algorithms. Addison Wesley Longman, Inc., 1998. Shibata, Yukio. On the Tree Representation of Chordal Graphs. Journal of Graph Theory, 12(3):421– 428, 1988. B. W. Silverman. Density Estimation for Statistics and Data Analysis. Chapman and Hall/CRC, 1986. UCI Machine Learning content repository. Web site http://www1.ics.uci.edu/~mlearn/MLSummary.html . J. Whittaker. Graphical models in applied multivariate statistics. Wiley, 1990. Xiaohui Yu and A. Fu. Piecewise Linear Histograms for Selectivity Estimation. In International Symposium on Information Systems and Engineering (ISE’2001), pages 319–326, Las Vegas, USA, 25 June 2001.