Results show a considerable power saving potential of up to 65% or more in base station power. Index Termsâgreen communications, dynamic spectrum.
2013 IEEE 24th International Symposium on Personal, Indoor and Mobile Radio Communications: Mobile and Wireless Networks
Green Cellular Access Network Operation through Dynamic Spectrum and Traffic Load Management Shuyu Ping, Adnan Aijaz, Oliver Holland, and A. Hamid Aghvami Institute of Telecommunications, King’s College London, London WC2R 2LS, UK {shuyu.ping, adnan.aijaz, oliver.holland, hamid.aghvami}@kcl.ac.uk
Abstract—This paper investigates the green or energy efficient operation of cellular access networks through dynamic spectrum and traffic load management techniques. Different energy saving techniques are discussed along with applications in realistic multi-cellular scenarios. The use of base station cooperation is discussed. The outage probability analysis is also discussed for different energy saving techniques in order to satisfy a particular Quality-of-Service (QoS) threshold for different services. The analysis is supported by different base station power consumption models, traffic models, and realistic statistics of different base stations in London, UK. Results show a considerable power saving potential of up to 65% or more in base station power. Index Terms—green communications, dynamic spectrum access
I. INTRODUCTION
T
HE cellular industry has seen a tremendous growth over the last few years in terms of the number of users and the amount of carried traffic. To meet the ever growing capacity requirements, operators have to deploy more base stations per area for higher capacity. As per one of the surveys, each year approximately 120,000 new base stations are deployed worldwide [1]. Studies show that Information and Communication Technology (ICT) infrastructure is responsible for up to 10% of world electric energy consumption [2]. For the cellular operator, 57% of energy is used in the access network as the base station comes out to be the most energy intensive component of a mobile network [3]. A typical 3G base station consumes between 800-1500W for a transmission power of 40-120W. A 3G network with 13,000 base stations will consume over 300GWh per annum [4]. This huge energy consumption raises the operational expenditure (OPEX) for operators. Moreover, the carbon footprint of ICT industry is significant and contributes to 2% of global CO2 emissions [5]. Recently, there has been a growing trend towards energy efficient or ‘green’ communications. This is primarily due to the factors such as the rising fuel prices worldwide, the awareness of harmful effects of CO2 emissions on environment, the depletion of non-renewable energy sources etc. The basic objective of green communications is to mitigate the inefficiencies in cellular network operation particularly in the access network. For operators, reducing energy consumption is not just a matter of corporate responsibility, but also very much an economically important issue. It is expected that communication operators in future will have access to an increasing range of spectrum bands with very
978-1-4577-1348-4/13/$31.00 ©2013 IEEE
different frequencies and physical characteristics. Even today, in different parts of the world, operators are providing services in multiple bands, such as GSM 900MHz and 1800MHz, UMTS 2GHz, and 2.4GHz Wi-Fi services among others. The introduction of IMT-Advanced bands will further increase the range of spectrum bands available to the operators. In order to achieve energy efficiency in the cellular access network, reducing the operational power consumption of base stations is particularly important. Enabling sleep modes for the radio network equipment, and more generally reducing transmission power can have a significant impact on the overall power consumption of the operator in running its network. Dynamic spectrum and traffic load management techniques can significantly improve the energy efficiency of cellular access network. These concepts were introduced in authors’ previous work in [6], [14] where we consider (i) the opportunistic reallocation of loads between bands to allow radio network equipment in the bands that the traffic originated from to be powered down, and (ii) the opportunistic selection of more appropriate spectrum band based on propagation characteristics to minimize necessary transmission power through improving propagation. In [7] we developed ON/OFF traffic models for different services like FTP, HTTP, video streaming etc. and investigated the proposed concepts under these models to evaluate the energy saving potential. In [8] we evaluated the concept of dynamically powering down the radio network equipment by opportunistically shifting users from cellular to Wi-Fi networks. However our previous work only focused on single-cell scenarios. The main objective of this paper is to extend these energy saving concepts to multi-cellular scenarios, in which system-level effects are accounted for. Moreover, the impact on Quality-of-Service (QoS) is also discussed, noting that it has not been necessary to consider this in our previous works as opportunistic cell-level power saving modes within each band have not been investigated. This paper is structured as follows. In the next section, the proposed power saving concepts are explained. Section III investigates aspects of the performances of the concepts as well as the impact on QoS. Finally, Section IV concludes this paper. II. DYNAMIC SPECTRUM AND TRAFFIC LOAD MANAGEMENT The two dynamic spectrum and traffic load management techniques studied in this paper to reduce energy consumption in the cellular access network are described as follows.
2791
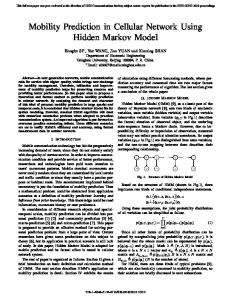
A. Power Saving through Dynamically Powering Down the Radio Equipment The first concept, illustrated in Figure 1, is reallocating traffic loads to particularly active bands from other bands, to allow radio network equipment in those other bands to be switched off or put into standby mode at times of low load [6]. The reduction in traffic load in some parts of a cellular network at some times might occur due to a number of effects, including typical day-night behavior of users, daily swarming of users from residential to corporate areas and back and movement of users to/from some areas at weekend and vacation times, for example [9]. This concept proposed by us is extremely promising as it implies guaranteed ‘from-the-socket’ power saving.
1800MHz band. Thus the opportunistic usage of 900MHz band under periods of low utilization, particularly in early morning hours for example, might allow the switching off of half of the base stations for 1800MHz network [6].
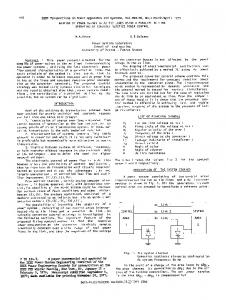
Fig. 2: Reallocating users to improve propagation.
III. PERFORMANCE EVALUATION
Fig. 1: Reallocating traffic load between bands to enable radio network equipment to be switched off.
There are two possibilities regarding the dynamic powering down of radio network equipment: (i) turning off base stations entirely in one network or spectrum band at that time/location, through traffic being sufficiently carried by single network or spectrum band and (ii) removing sectorization for a network, e.g., using spare capacity of one network/frequency to cover the required drop in load of another network/frequency in order to enable that other network/frequency to operate in omni-directional mode instead of tri-sectorized. These two techniques are referred to as ‘powering down’ and ‘sectorization switching’ solutions in this paper, and can be employed together in sectorized networks [7]. B. Power Saving through Propagation Improvement The second concept, illustrated in Figure 2, is the opportunistic reallocation of users to more appropriate propagation bands at times when that spectrum becomes available. This decreases necessary transmission power due to improved propagation, or alternatively in a frequency reuse scenario, reallocation based on the necessary deployed cell density/radius and the given local propagation environment can be used to reduce inter-cell interference through minimizing power “leaking” into co-channel cells [7]. Consider a GSM/DCS system where both 900MHz and 1800MHz bands are used to provide services over a coverage area. For a wide range of path loss models, the 900MHz band experiences at least 4 times (6 dB) less path loss as compared to the 1800MHz band. This simple model (ignoring aspects such as antenna gains and heights), implies that at least 75% less transmission power can be used in 900MHz band compared to
A. Base Station Power Consumption Model According to studies on base station power consumption modeling, ‘from-the-socket’ power consumption of a base station is given by ܲ௦ ൌ ܲ � � ܲ ൌ ݉ ή ்ܲ ܲ (1) where ܲ denotes the component that varies with transmission power ሺ்ܲ ሻ , and ܲ is a fixed term that is independent of transmission power and accounts for baseband processing, cooling and auxiliary equipments etc. [10]. B. Cellular Network Traffic Model For the cellular network, the traffic load (in terms of the number of users), L(t), varies as a percentage of busy hour load (BusyLoad) over a 24 hour period, pertaining to traffic in a cellular network in London, UK, obtained via private interaction with Vodafone representatives in a research project. Figure 3 depicts these loads as a percentage of BusyLoad.
Fig 3: Hourly variation of traffic load (cellular network) over a typical day
In addition to this, the statistical number of active users in the cell are assumed to be Poisson distributed, the mean of which can be taken from the traffic load at that time of the day, L(t). The probability that k number of active users is present at any time of the day t is expressed as:
2792
ܲሺ݇ǡ ݐሻ ൌ
ሺ௧ሻೖ ିሺ௧ሻ Ǩ
(2)
C. Achievable Power Savings through Combined Application of Power Saving Techniques in Single and Multi-cellular Scenarios. Simulations have been performed for a cellular system with parameters given in Table 1. The numerical assessment cycles in outer loops through a 24 hour period in steps of t of one hour, and uses the value of L(t) to parameterize (2). In inner loops it cycles through each possible value of k (number of active users) for the participating bands/networks and ascertains the power consumption that would be required given the proposed approach of shifting users. The actual power consumption is then given as this power consumption multiplied by the probability of it happening, which is the product of probabilities of the chosen values of k occurring for the two participating bands/networks, i.e., ܲሺ݇ǡ ݐሻଵ ή ܲሺ݇ǡ ݐሻଶ . This result is then summed with the equivalent values for all possible chosen values of k to obtain overall power consumption at time t. The operation is repeated over all hourly time units in the 24 hour period, and the average power consumption is calculated.
higher savings are achieved on average, for moderate traffic loads, through this combination. It should be noted that under certain conditions, this combination of powering down, sectorization switching and propagation improvement may result in degradation in power savings compared to combination of powering down and sectorization switching alone. This may occur, for example, when the traffic load from low frequency band is moved to high frequency band in order to remove the sectorization or to power down a base station. However, such degradations can be avoided by implementing policies that ensure that opportunistic reallocation to power down the radio equipment might always leave the band switched on that has the most appropriate propagation characteristics.
60 70 60
TABLE 1: SIMULATION CONFIGURATION PARAMETERS Parameter Value System configuration Reflecting GSM/GPRS system Operating low frequency band 900MHz Operating high frequency band 1800MHz Number of channels 252 No of users supported per cell in 25 omnidirectional mode No of users supported per cell in 38 tri-sectorized mode Busy hour load (users per cell) varied
50
Power saving %
50 40
40 30
30
20 10
20 0 10
10 15
15 20
20 25
25 30
Busy Load Band 2 (users) 900 MHz
10
30 35
35
Busy Load Band 1 (users) 1800 MHz
(a)
Exactly the same process is performed to find the average power consumption of a conventional system without applying any power saving solution. The power saving percentage is given by ಲ ಳ
ቁ ൈ ͳͲͲΨ
60
70
(3)
where ܲ is the power consumption after applying the proposed power saving techniques, and ܲ is the power consumption before applying the proposed power saving techniques. We assume that the high frequency band requires twice the number of base stations and hence twice the power to operate (the reasoning behind this is discussed in section II.B). Moreover, the transmission power consumption is determined by the COST Walfisch-Ikegami non-line-of-sight path loss model for the suburban configuration. The combination of power saving techniques is achieved through (1). We assume that ݉ is 9.25 i.e., 9.25 Watts of ‘from-the-socket’ power consumption per transmission power Watt. The fixed part i.e., ܲ is assumed to be 487W [7]. Figure 4 shows the power saving performance through combined application of power saving techniques in single-cell scenario. Significant saving of up to 65% in ‘from-the-socket’ power can be achieved through powering down and sectorization switching in tandem. However, the combined application of powering down, sectorization switching and propagation improvement techniques in tandem yield savings of up to 71% (Figure 4(b)) in total power consumption of base station and thus provide an improvement of 6%. Moreover,
50 60 Power saving %
ܲ ݃݊݅ݒܽܵ�ݎ݁ݓൌ ቀͳ െ
70
50 40 40 30 30 20 10 20 0 10
10 15
15
20
20 25
25 30
30 Busy Load Band 2 (users) 900MHz
35
10
35 Busy Load Band1 (users) 1800MHz
(b) Fig 4: Power saving against BusyLoad in single-cell scenario. (a) Power savings through sectorization switching and powering down in tandem; (b) Power savings through sectorization switching, powering down and propagation improvement in tandem
We consider 3-cell and 7-cell cluster patterns for application of the proposed power saving techniques in multi-cellular scenarios. We assume two frequency bands per cell. Other configuration parameters are same as in Table 1. The traffic load for each cell varies as a percentage of busy hour load as before (Figure 3) and the active number of users is assumed to be Poisson distributed. Moreover, the busy hour of each cell is shifted by 1 hour for each adjacent cell in order to simulate a
2793
realistic scenario. Under periods of low load, we aim to power down a base station, with its service area covered through cooperation between neighboring base stations. The base station cooperation patterns are shown in Figure 5.
in Figure 9(b). Significant savings of up to 73% can be achieved in total power consumption of the base station. 60 70 50
60
Power saving %
50 40 40
30
30
20 20 10
�
Fig 5: Base station cooperation patterns
0 10
10 15
15 20
25
25 30
35
Busy Load Band 2 (users) 900MHz
The results shown in Figure 6 correspond to the percentage of ‘from-the-socket’ total power savings in a 3-cell scenario. Significant power saving of up to 70% can be achieved when the bands are lightly loaded. At moderate traffic loads, savings in the range of 30-55% can be achieved. The results for transmission power savings through propagation improvement are shown in Figure 7, whereby savings of up to 70% can be achieved through reallocation to better propagation bands. Moreover, the combination of reallocation to dynamically power down the radio network equipment and propagation improvement is also considered. Figure 8 gives the power savings through powering down, sectorization switching and propagation improvement in tandem. Significant savings of up to 70% can be achieved in total power consumption of base station.
10
20
30
35
Busy Load Band 1 (users) 1800MHz
�
Fig 7: Power savings through propagation improvement in a 3-cell scenario
65 70 60
power saving
60
55
50
50
40
45 40
30 35 20 30 10 10
25 10
15
15 20
20 25
20
25 30
Busy Load Band 2 (users) 900MHz
15
30 35
35
Busy Load Band 1 (users) 1800MHz
Fig 8: Power savings through sectorization switching, powering down and propagation improvement in tandem in a 3-cell scenario 65 70 60 60
55 50
Power saving %
50 45 40
40 35
30 30 20
10 10
25 20 15
20
25
Busy Load Band 2 (users) 900MHz
25 30
35
35
20
15
10 15
30 Busy Load Band 1 (users) 1800MHz
�
Fig 6: Power savings through powering down and sectorization switching in tandem in a 3-cell scenario
The transmission power savings in a 7-cell scenario through opportunistic reallocation to better propagation bands are shown in Figure 9(a). We aim to power down up to 4 base stations and provide service in the total area through cooperation between the remaining base stations as shown in Figure 5. Maximum power savings of up to 60% can be achieved when 900MHz band is lightly loaded. It should be noted that 4 base stations can be switched off only at low load conditions because as the traffic load increases, more base stations need to be switched on which can provide more appropriate propagation bands for transmission power saving. The combined technique through powering down, sectorization switching, and propagation improvement in tandem are shown
D. Outage Probability Analysis Quality-of-Service (QoS) is an important aspect that needs to be considered in any energy efficient cellular network operation strategies as powering down some base stations reduces the SNR at the receiver side due to increased distances between active base stations and users. The QoS can be evaluated using metrics such as outage probability. For a certain given SNR threshold ߛ ǡ an outage occurs when the instantaneous received SNR is less than this threshold. The analysis of outage probability for different energy efficient cellular network operation strategies was first done in [11]. The analysis is based on calculating the worst case location of the user in the switched off cell and the use of different base station cooperation patterns to provide coverage in the service area of switched off base station. Our objective is to calculate the outage probability for the case of dynamically powering down the radio network equipment in a 7 cell scenario, where up to 4 base stations can be powered down. We introduce different base station cooperation patterns, as shown in Figure 10. We extend and modify the analysis done in [11] for outage probability calculations. As the analysis is based on similar methodology, therefore detailed proofs are omitted (due to space limitations) and final expressions are given. The interested reader is referred to the analysis in [11].
2794
consider the probability of powering down a base station into account as well. The average probability of powering down a base station when only 3 out of 7 base stations are active is given by (7). Therefore, in order to complete the outage probability analysis, both (4) and (5) should be multiplied by ܲௗ .
60 55 70 50 60 45 Power saving %
50 40 40 35
்
30
்
ೞೢ ೞೢ ܲሺ݇ǡ ݐሻቂσଷୀଵ σୀ ܲௗ ൌ σୀ
30 20
ି
ܲ ሺ݆ǡ ݐሻቃ
(7)
25 10 20 0 10
10 15
15 20
15
20 25
25 30 35
Busy Load Band 2 (users) 900MHz
10
30 35
Busy Load Band 1 (users) 1800MHz
(a) 70
80 60 70
��
power saving %
60
�
Fig10: Base station cooperation for outage probability in 7-Cell scenario (same convention is used for active and powered down cells as in Figure 5)
50
50 40
40
30 30 20
10 10
15
15 20
10
20
20 25
30
30 35
25
35 Busy Load Band 1 (users) 1800 MHz
Busy Load Band 2 (users) 900 MHz
(b) Fig 9: Power saving performance in 7-cell scenario, (a) Power saving through propagation improvement; (b) Power saving through powering down, sectorization switching and propagation improvement in tandem
For each different base station arrangement, the outage probability formulas are given by (4), (5), and (6), where (4) gives the outage probability for pattern (a), (5) gives the outage probability for (b), (c), (d), and (e), and (6) gives the baseline outage probability. The baseline outage probability scenario corresponds to the case when all base stations are active and no cooperation is used.
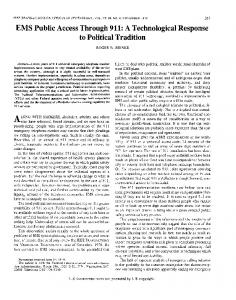
In our simulations, we assume M=4,ߙ ൌ ͵, G=2, R=1km, N=5dB, and ߛ ൌ ʹͲ�. P is equal to the transmission power per base station at each value of BusyLoad. Figure 11 gives the outage probability for each base station cooperation pattern. The QoS probability represents the baseline outage probability in 7cells. Different base station cooperation pattern have different outage probability performance. The outage probability decreases as the transmission power of active base station is increased. The percentage figure given with each pattern shows the percentage of times this pattern is used for covering the area of powered down base stations. For some cooperation patterns in our scenario, it is necessary to increase the transmission power to reach the desired outage probability. 0
10
-2
10
-4
10
ೌ
ܲݎሺܴܵܰ ߛ ሻ ൌ
(4)
ሺெିଵሻǨ
಼ ೞ ം ήಿήೃೌ ሺσೣసభ ೝషೌ ೣ ሻ ఊሺమǡ బ షమೌ ುಸሺσ಼ ೣసభ ೝೣ ሻ ೞ ሺ ሻ మ
Outage probability
ܲݎሺܴܵܰ ߛ ሻ ൌ
ം ήಿήೝ ఊሺெǡ బುಸ ሻ
(5)
-6
10
-8
10
-10
10
-12
10
ܲݎሺܴܵܰ ߛ ሻ ൌ
ം ήಿήೃೌ ఊሺெǡ బ ುಸ ሻ
మ
where ݏൌ ʹ�
షೌ ሺσ಼ ೣసభ ೣ ሻ
షమೌ σ಼ ೣసభ ೣ ஶ ௫ିଵ ି௧ ݐ݀ ݁ ݐ. M
, ɀሺǡ ሻ ൌ
௫ ݐ௦ିଵ ݁ ି௧ ݀�ݐ
25% 75% 25% 50% 25%
-14
10
(6)
ሺெିଵሻǨ
Qos probability Arrangement (a) Arrangement (b) Arrangement (c) Arrangement (d) Arrangement (e)
10
15 20 25 30 Total transmission power of active base stations (Watts)
35
Fig11: Outage probability for each cooperation pattern in 7cell scenario
,
and
denotes the number of antennas per Ȟሺሻ ൌ base station, K is the number of cooperating base stations, R is the original radius of each base station, r is the new extended radius (shown in Figure 10 for each pattern), G is the normalizing gain factor, Ƚ�is the path loss exponent, P is the transmission power, and N is the receiver noise variance [11]. It should be noted that we assumed the active number of users in a cell to be Poisson distributed, under which, it is important to
E. Transmission power saving through realistic BS statistics Our realistic base station statistics are based on the base station locations in Central London, UK. The detail information of each base station can be obtained from [13]. The general information is listed in Table 2. We first calculate the transmission power savings for each operator individually and then calculate the overall transmission power savings achievable in the whole area. For the macro cell scenario we consider Okumura-Hata path Loss
2795
model for urban environment whereas for micro cell scenario we assume the Lee model.
responsibility perspectives. In this paper, we have investigated how different dynamic spectrum and traffic load management techniques can improve the energy efficiency of the cellular access network. Results show a significant power saving potential of 65% or more, through combination of different power saving techniques, in base station power consumption and point to a viable solution for reducing energy consumption in practical scenarios.
Fig12: Base station locations in Central London, UK (area = ~0.5 sq. km) [13]
We consider the worst case scenario i.e., keeping the minimum number of base stations for each operator to provide coverage in this area (also considering the upper bound on transmit power per base station). The results in Figure 13 show the transmission power performance with and without applying the transmission power saving solutions for macro cells. . As it can be seen, turning off the base stations without applying the propagation improvement solution cannot yield much savings. Moreover, in some cases, transmission power needs to be increased to extend the coverage. However, with the application of propagation improvement techniques, transmission power savings of up to 50% can be obtained by selecting the bands with better propagation characteristics.
Fig 14: Transmission power for micro cell scenario
ACKNOWLEDGMENT Some of the work reported in this paper has formed part of the Green Radio Research Programme of Mobile VCE, UK, www.mobilevce.com. This work has also been supported by the ICT-ACROPOLIS Network of Excellence, FP7 project number 257626, www.ict-acropolis.eu. The authors are extremely thankful to Professor Fernando Jose da Silva Velez, of the “Instituto de Telecomunicações, DEM, Universidade da Beira Interior”, for his assistance. .
REFERENCES [1]
TABLE 2 REALISTIC BASE STATION STATISTICS Operators
Vodafone
O2
Orange
3
No. base station
6
8
5
2
No. Macro Cell
6
3
3
2
No. Micro Cell 900MHz bands
0 6
5 11
2 0
0 0
1800MHz bands
1
4
5
0
2100MHz bands
1
4
5
2
[2]
[3] [4]
[5] [6]
The results for micro cell scenario are shown in Figure 14. With a similar reasoning as before transmission power savings of up to 50% can be achieved by selecting the band with better propagation characteristics.
[7]
[8]
[9]
[10]
[11]
[12] Fig13: Transmission power for macro cell scenario
[13]
IV. CONCLUSION
[14]
Energy efficiency in cellular networks is a growing concern for cellular operators from economical as well as corporate
2796
H. Sistek, “Green-Tech Base Stations cut Diesel Usage by 80 percent,” in CNET News Green Tech, 2008, accessible at http://news.cnet.com/8301-11128_3-9912124-54.html, accessed July 2011. G. Fettweis and E. Zimmermann, “ICT Energy Consumption; Trends and Challenges,” in Proceedings of IEEE WPMC, Lapland, Finland, Sep 2008. UK Mobile Virtual Centre of Excellence – Green Radio, accessible at http://mobilevce.co.uk/green-radio, accessed Aug 2011. Vodafone UK Corporate Responsibility Report 2009-10, accessible at http://www.vodafone.co.uk/cs/groups/configfiles/documents/contentdoc uments/cr_report_2009_10.pdf, accessed May 2011. BusinessGreen Blog. http://blog.businessgreen.com, accessed July 2011. O. Holland, V. Friderikos and A. H. Aghvami, “Green Spectrum Management for Mobile Operators,” IEEE Globecom, workshop on Green Communications, Miami, FL, USA, Dec. 2010. O. Holland, et al., “Opportunistic Load and Spectrum Management for Mobile Communications Energy Efficiency,” IEEE PIMRC, Toronto, Canada, Sept. 2011. A. Aijaz, O. Holland, P. Pangalos, and A. H. Aghvami, “Energy Savings for Cellular Access Network through Wi-Fi Offloading,” IEEE ICC, Ottawa, Canada, Jun. 2012. M. A. Marsan et al., “Optimal Energy Savings in Cellular Access Networks,” IEEE GreenComm, workshop on Green Communications, Dresden, Germany, Jun 2009. Peng, C., S.-B. Lee, et al., “Traffic-Driven Power Saving in Operational 3G Cellular Networks,” ACM MobiCom. Las Vegas, Nevada, USA, Sept. 2011. F. Han, Z. Safar, W. Lin, Y. Chen, and K. Liu, "Energy-Efficient Cellular Network Operation via Base Station Cooperation", IEEE ICC, Ottawa, Canada, Jun. 2012. http://www.keralapolice.org/telecommunication/refpdf/NETWORK%20 AND%20RF%20 PLANNING.pdf Ofcom,"Sitefinder: Mobile Phone BASE STATION Database," http://www.sitefinder.ofcom.org.uk/. O. Holland, T. Dodgson, A.H. Aghvami, and H. Bogucka, “Intra-Operator Dynamic Spectrum Management for Energy Efficiency,” IEEE Commun. Mag., vol. 50, no. 9, Sept. 2012.