Grid Computing Visualization Louis Weitzman Internet Technology Group IBM 1 Rogers Street Cambridge, MA 02142 USA
[email protected]
Abstract Grid computing is a new way to access and take advantage of the distributed computational resources that the web has made available. Currently the grid is almost exclusively used by the scientific community for specialized applications. In the future, it is envisioned that grid computing will provide access for the average user needing various business applications that live remotely on the web. In order to better understand the interdependencies and complex nature of a computational grid network, an application was created to visualize this new computing environment. This research sketch, presents an interface to explore IBM’s intraGrid with a number of different users in mind. It allows the user to see the computing resources available in three separate views, filter grid resources based on their attributes, and submit jobs to a specific computer that has been selected.
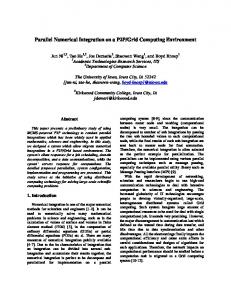
Keywords Grid computing, web services, peer-to-peer computing, information visualization, interaction design. figure 1. Grid visualization integrated into IBM’s intraGrid job submission service.
Industry/category Computing infrastructure, business applications
Project statement Grid computing has been compared to the electrical grid. It is a network that you can plug into to get unlimited resources. The computing Grid provides
2
Peer-to-peer computing Peer-to-peer computing utilizes the idle processors of desktop computing. Web services Web services enhance the existing HTTP protocols to enable the discovery and use of relevant applications on the web. Grid computing Grid computing merges peer-topeer computing, web services and new protocols to take advantage of computational resources of diverse and dispersed computational resources. Globus Toolkit The Globus toolkit is an opensource implementation of grid protocols that has become the de facto standard.
unlimited computational resources and is being recognized as one of the 10 emerging technologies that will change the world [5]. Grid computing relies on the integration of a number of technologies. One is peer-to-peer computing which utilizes the idle cycles of desktop computers, as popularized by SETI@home’s screensaver [4]. Another is the emergence of web services which provides access to diverse computational resources through the enhancement of the web’s hypertext protocol [6]. By layering an additional protocol on top of these technologies, grid computing provides access to amazing computational power and resources [1, 3]. These protocols involve everything from security and authentication to the brokering for the appropriate service. They are being designed and built in an opensource effort called the Globus Project [2]. While the promise is great, the ability to comprehend what is happening on a particular computational grid is becoming increasingly complex. There is an opportunity to provide new tools and techniques to aid in the understanding of the grid environment itself. The end user may not care about the overall topology of the grid but only cares if his application or data is being properly managed. Administrators would like to know the status of the resources on the grid they manage, while the causal observer may be interested in the overall scope of the grid and its resources. Today, the standard use of the grid is to run jobs on remote machines, either sequentially or in parallel. Unfortunately, users have to choose the specific computer(s) on the grid in order to run their job. In the future, different brokering models will be available to
hide much of this complexity from the user. The administrator, however, will still be interested in seeing the status of the resources under his or her management.
Project participants and duration This simple research sketch explored the possibilities for visualizing grid activity and its resources. Only one person was involved with the development of the application and no user studies were done. The project lasted for about 6 months. After a working version was complete, it was integrated into the IBM intraGrid job submission site [see figure 1].
Research sketch details Many locations worldwide participate in IBM’s intraGrid effort. Each location consists of 1 or more pools of resources and each pool can contain 1 or more computers. Each computer has a set of attributes that would help to determine its status (offline, idle, working, busy or overloaded) and appropriateness for a particular job. This research sketch is composed of a server side component and a Flash XML-based client. The serverside component is a servlet that first reads data from a registration database and then goes to the live grid merging in the details of each pool and resource. Periodically, this server updates its local cache with live data from the grid. The server presents the data as a set of web pages or can be queried and return an XML document. The client-side application requests the XML data and renders three distinct views; a view to browse the resources, called Describe; a view to see the resources in their physical location, called Locate; and
3
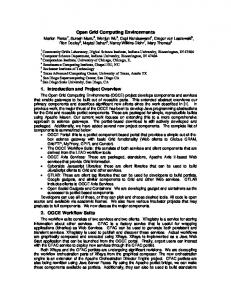
a view to compare and filter different resources and submit jobs, called Evaluate. The Describe view, shown in figure 2, presents the information in a set of columns starting with locations, then pools, computers and attributes. The user can browse this information and the appropriate attributes for the selected computer are displayed. Color is used to indicate status (offline or online), progress bars illustrate percentages of some attributes, and smooth animation is used to maintain context during transitions. Consistent color and smooth animation are
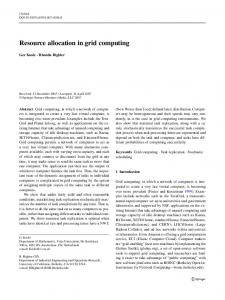
used throughout this sketch. The Locate view, shown in figure 3, provides a geographic organization of the pools and computers. A user can select a location and get more information on the pools in that location. Figure 4 illustrates the Evaluate view which allows the user to filter the computers using constraints on the attributes. These include attributes such as OS, CPU speed, CPU load, disk space, and the computer’s pool and location. Once a computer is selected, the user can submit a job on that computer launching the job submission web site, shown in figure 1.
figure 2. The Describe view which lists locations, pools, computers, and attributes of those computers.
4
figure 3. The Locate view provides geographic placement of
figure 4. The Evaluate view allows users to filter computers
the pools.
based on their attributes relevant to their job submission.
Summary
Acknowledgements
This sketch helped to identify a number of scenarios for a grid visualization tool, but much work still needs to be done. It uses smooth animation and scrolling, and transparency of items to create a consistent look and feel. However, the problem with visualizing a grid is that it can grow very large and involve hundreds, even thousands of resources. Working with limited real estate presents a significant problem. Without using the techniques of transparency, overlay and dynamics, it becomes increasingly difficult to display information about the grid and its status. In many instances, this solution will not scale. In addition, this application has not focused on the users specific tasks. For instance, users need to be able to track their jobs, administrators need to support and maintain a pool of computers, and the casual user needs to get a sense of the whole grid and its overall status. As the grid evolves, better presentation techniques need to be incorporated, as well as a tighter collaboration with the actual users of the grid.
I’d like to thank the Internet Technology Group at IBM. In particular, I would like to thank Jessica Wu and Dikran Meliksetian, for their technical and design support in developing this application.
References
[1] Foster, I. and Kesselman, C. The Grid: Blueprint for a New Computing Infrastructure, Morgan Kaufmann Publishers, San Francisco, USA, 1999. [2] Globus Toolkit, http://www.globus.org. [3] Reed, D. and Ribler, R. Performance Analysis and Visualization, in The Grid: Blueprint for a New Computing Infrastructure, Morgan Kaufmann Publishers, San Francisco, USA, pp. 367-393, 1999. [4] SETI@home, http://setiathome.ssl.berkeley.edu. [5] Waldrop, M. Grid Computing, 10 Emerging Technologies That Will Change The World, Technology Review, pp. 41-42, Vol. 106, No. 1, February, 2003. [6] W3C, Web Services, http://www.w3.org/2002/ws/.