2012 Fourth International Conference on Intelligent Networking and Collaborative Systems
Grid Configuration and Application Monitoring in GridGain Florin Pop, Maria-Alexandra Lovin, Catalin Negru, Valentin Cristea University POLITEHNICA of Bucharest, Romania Faculty of Automatic Control and Computers Emails: fl
[email protected],
[email protected],
[email protected],
[email protected]
Nik Bessis, Stelios Sotiriadis School of Computing & Maths, University of Derby, Derby, United Kingdom Bucharest, Romania Emails:
[email protected],
[email protected]
taxonomy introduced in [3], the solution belongs to the category of third level of monitoring tools, as a hierarchy of publishers system, based on the provision characteristics, complexity of components defined in Grid Monitoring Architecture (GMA). The remainder of this paper is organized as follows: Section 2 presents the main issues regarding Grid monitoring; Section 3 details the proposed solution at architectural level and presents the technologies used and the way the different modules are combined, with a small portion dedicated to changes at monitoring level starting from version 3 of GridGain; Section 4 focuses on the data visualization and management layer of the solution, exploring the possibility of analyzing the gathering information in order to make configuration arrangement proposals; Section 5 tries to evaluate the solution based on the parameters gathered referring to characteristics such as number, accuracy and relevance; Sections 6 and 7 contain a number of possible development and improvement directions, while Section 8 presents the conclusions of this paper.
Abstract—Monitoring large scale distributed systems such as Grids environments represents a means for obtaining a quantitative and qualitative measurement of performance by collecting information relevant to environment and applications running on the Grid. This paper proposes a solution for Grid monitoring on GridGain middleware platform using both indirect information gathered inside the platform and an addition tool based on MonALISA and ApMon. A useful feature would be to allow the monitoring system to present the operator with suggestions computed based on the history of monitored parameters for jobs with a longer execution time or based on some theoretical, model based assumptions that relate existing configuration to the values of some performance parameters. Keywords-Distributed System, Monitoring, GridGain, MonALISA, Scheduling Service
I. I NTRODUCTION Grid monitoring solutions focus on different directions of monitoring: on configuration monitoring of the entire structure of the Grid or per Grid node, on monitoring applications running on the Grid or on a combination of both configuration and applications performance monitoring. Although starting from version 3, GridGain platform [1] becomes oriented more towards cloud development, Grid middleware remains an important feature of the platform and thus the need for monitoring in order to evaluate and enhance the performance of applications running and of resources usage. The solution for GridGain follows a combined approach for both configuration and applications monitoring, by gathering a large number of parameters of both types. As previously proven on the existing monitoring solutions for GridGain, information extracted from Grid metrics and configuration available with GridGain API, GridGain SPIs and other monitoring tools. Also, the analysis of the existing Grid monitoring solutions indicates MonaLISA [2] and the set of available tools as the solution that can be easily integrated with GridGain. The solution is designed for applications running on a Linux/Unix environment and uses the Java implementation part from MonALISA. Monitoring information is sent to a central location from where it can be accessed by requesters and further viewed in a separate module. According to the 978-0-7695-4808-1/12 $26.00 © 2012 IEEE DOI 10.1109/iNCoS.2012.82
II. G RID M ONITORING . S TATE OF THE A RT AND S OLUTIONS A traditional Grid monitoring process consists of four stages [2] [21]. In the first phase, generated events lead to the acquiring of measurements specific to the environment and monitored application. The next phase involves processing acquired data according to different criteria or groups of events, followed by a distribution of the information to requesters. Presentation is often organized in a GUI application by using a stream of events or recorded trace data stored as archive or database, a process known as consumption. The data presented involves further processing to extract conclusions. Grid monitoring systems need to follow a certain schema for data representation and ongoing research tries to establish a standard for the schema and structure of description. Monitoring information or statements are described by a time-stamp, indicating the moment of time when the information was taken of the measurement statement was true. 155
The GMA introduced in [10] by the OGF (Open Grid Forum) is an architectural recommendation for Grid monitoring applications that contains three main components: a producer, a consumer and a registry (see Figure 1). Additional components are sensors and sensor managers. In GMA a sensor defines any type of component that generates a time-stamped parameter for a monitoring-performance event. Sensors can be used for applications, hosts, network and processes. The process sensors generate events when a change in the state occurs; application sensors are embedded in the application. Host sensors refer to CPU and memory parameters and often there is the necessity to view these parameters remotely. SNMP queries to network devices have the role of network sensors. For each sensor, a sensor manager can be assigned based on some configuration. The producer is usually an API for events generation, events that are further captured by the consumer, while the registry is responsible with storage, communication and discovery between producer and consumer. Other elements contained in GMA are a compound component (known as a republisher) responsible for additional operations such as filtering and a schema repository for collecting events. The proposed architecture corresponds to the above mentioned phases of the monitoring process.
performance of the monitored Grid environment and should present only a small degree of intrusiveness obtained by collecting data separate from the execution. Provided data format needs to be portable, compact, easy to use and exposed in standard formats. A monitoring tools architecture should allow extensions for new type of monitored parameters and events. Information needs to be periodically refreshed (requirement known as a time-to-live for information) and maintained accurate. Archive handling requirements in the form of file logging or data base storage can be helpful for prediction, analysis as well as management decisions [20]. The taxonomy introduced in [3] allows the classification of Grid monitoring systems based on the provision and characteristics of components defined in GMA, the level of interaction with other systems and the monitored entities taxonomy obtained by conducting a survey on 19 Grid monitoring solutions and their features. The classification identifies the following categories: •
•
Figure 1.
OGF Grid Monitoring Architecture
Metrics, benchmarks for Grid hardware, middleware and different applications are analyzed in an initiative of the Grid Benchmark Research Group (GB-WG) [11]. Other Grid benchmarking problems addressed in [11] are the complexity of interaction with services and the need for standardization. Concepts as robustness, performance, stability and fault detection capabilities [22] should also be addressed by a monitoring tool oriented towards Grid environment and less towards monitoring the progress of applications running on the Grid environment. Such a system is GRASP [12], which defines a set of probes and is integrated with Globus toolkit infrastructure. Scalability requires the monitoring tool to be capable to adjust to the change of Grid dimensions in both resources and events. The overhead introduced by the monitoring process should not have a negative impact on the overall
•
156
Level 0 monitoring solutions. Self-contained systems, systems that do not expose functionality to a publisher interface are classified as level 0 monitoring tools. GridICE [13], part of the DataTAG project is a monitoring solution based on a centralized architecture, where a main server queries some selected nodes in order to extract information in XML format as requested by the clients; extracted information about Grid activities can be viewed by connecting to a specific web page interface; storage of information is also possible in a database. MapCenter [14] focuses on end-users receiving a flexible data presentation and uses transparent monitoring techniques. Level 1 monitoring solutions. As a level 1, producer only systems, Autopilota [15] is a distributed application monitoring tool, that enables self-describing applications, where events contain descriptions of their structure and can be accessed remotely. Level 2 monitoring solutions. LMM, NetLogger and SCALEA-G.evel 2 monitoring systems are publisherrepublisher model based applications in the following architectures: centralized republisher, distributed republishers and distributed republishers with replication. GridRM [16] is based on Java technologies (applets, servlets and JDBC) a SQL database and agents and objects, designed to monitor Grid behavior and not Grid applications. Hawkeye [17] is a general purpose monitoring system that can be accessed by a web interface, based on a central republisher, integrated in Condor. Other examples of level 2 Grid monitoring tools are JA. NetLogger (Networked Application Logger) is a tool for monitoring the behavior of elements in an application-to-application monitoring path [23] in order to determine performance and fault problems in a complex system. The toolkit contains four com-
•
ponents: a library of functions for writing event logs, tools for collecting and sorting log files, a set for monitoring host and networks and visualization and log analysis component. SCALEA-G [24] implements a set of services based on OGSA (Open Grid Services Architecture) with a client-server architecture and is built as an unified system monitoring and analysis tool. Level 3 monitoring solutions. More complex monitoring tools are classified as hierarchy of publishers (level 3). Ganglia [18] was mainly designed for clusters and therefore lacks registry, but can be also used for Grid environments. Globus Monitoring and Discovery Service (MDS) framework [19] contains information providers, resource information producers and Grid Index Information Services as republishers, allowing simple queries in XML format. R-GMA (Relational Grid Monitoring Architecture) [25] is part of the European Data Grid project and allows the monitoring data to be viewed as stored or streamed in a large virtual data warehouse ; while stable, the R-GMA implementation is known to have performance issues. R-GMA is based on Servlet technologies and offers a global view of the virtual organizations data, similar to a large database. It provides agents that support clients for consumer or stream producer roles, with an interaction based on language and vocabulary describing the data generated by monitoring.
III. G RID G AIN M ONITORING . P ROPOSED S OLUTION The structural and functional requirements for the monitoring solution have been determined considering the disadvantages of existing solutions for GridGain as well as standards concerning the four step Grid monitoring procedure [4] and some existing implementations of Grid monitoring frameworks [8] [9]. The monitored entities can refer to the entire Grid structure or to one node inside this structure. The GridGain architecture composes one named Grid factory, where each Grid can be accessed by either name or unique identifier (UUID) and Grid node following the same procedure. Because Grids inside a Grid factory are accessible on a mechanism similar to accessing a Grid node inside the Grid, the solution could easily be extended to cover factory level as a monitored entity. Monitored parameters can be classified into two categories - configuration related and performance related. Of course, a decision can be made to choose a combination of the parameters or to monitor only a subset based on their type. A combination of the two categories would relate measured metrics from Grid nodes to the overall Grid performance. We present the architectural design of the modules composing the solution and describes the procedure for gathering and using the values of the parameters (see Figure 2).
An efficient Grid environment and Grid application monitoring tool requires features as scalability with growing number of resources, events and demands for monitored parameters, extensibility by using data schema, protocols. Interoperability requests, security issues and the problem of possible bottleneck introduced by services and communication protocols are some other aspects a Grid monitoring tool needs to consider. Regarding monitoring, GridGain comes with an extensive collection of JMX MBeans that exposes all major monitoring and statistical information about all nodes in the Grid. This information is available via programmatic interface as well as through any JMX-compliant Web or standalone GUI viewer such as VisualVM. GridGain Enterprise Edition also features GridGain Visor - an interactive interpreter and monitoring tool for GridGain. Built on top of Scala REPL utility it provides CLI access to over dozen of different commands like: view the Grid topology, manage user defined monitoring alerts, view configuration on any remote node, deploy resources on remote nodes, start and stop GridGain on remote nodes, view discovery events and topology log, trace task execution [5]. The problem with monitoring and tracing task execution in GridGain is represented by the outside parameters collection. Sometimes, users need to view the evolution of application from inside, in a real-time.
Figure 2.
Architectural design of the proposed solution
A. Modified ApMon - Collecting monitoring information from GridGain nodes Existing ApMon tool from MonALISA has been modified to allow sending of additional parameters in datagrams - it can be configured to send all configuration or performance related parameters or all existing parameters by calling
157
Feb 2, 2012 12:01:42 PM apmon_ext.ApMon sendGridGainTimedParameters FINE: Datagram with size 116 sent to monitor.hpc.pub.ro, containing parameters: averageJobWaitTime 0.0 Feb 2, 2012 12:01:42 PM gridgain_appmon.GridGainParams sendAllConfigMetrics FINE: Send pameter averageJobWaitTime for node 0.0 Feb 2, 2012 12:01:42 PM apmon_ext.ApMon encodeGridGainParams Feb 2, 2012 12:01:42 PM gridgain_appmon.GridGainParams sendAllConfigMetrics FINE: Send pameter availableProccesors for node 1
specific methods. The initial option of sending a named parameter with a certain signification is also present. ApMon needs the following information in order to monitor jobs the PID of the parent process (connected to the Grid node and that can be obtained at the moment a job is deployed on a Grid node), the name of the Grid and the name of the Grid nodes. An additional parameter about the working directory can help gather information about disk. Therefore information about GridGain nodes falls in the configuration and performance-metrics categories. A large part of these parameters can be obtained from existing SPIs using the GridNodeMetrics interface. Some of these parameters have the same significance as standard parameters obtained through ApMon - examples are CPU usage and statistical information about number of deployed and executed jobs. Values are available as average and peek (maximum, minimum) values. Parameters from GridNodeMetrics are available for Grid node, but can be extended to Grid level, assuming a known configuration of the Grid. Metrics parameters refer to the number of available processors, CPU load, percentage of busy time, percentage of idle time, number of daemon threads, thread count, heap memory measurements for committed memory, initialized memory, maximum available memory, idle time percentage, last idle time value, latest update time for metrics belonging to the current node, uptime and start time for the JVM on node. The extended ApMon exposes the following new methods: sendAllConfigMetrics, sendAllConfigParams, sendAllMetricsParams or for named parameter in the two categories. Jobs executed on a Grid node can be described by the following parameters: average active jobs, average canceled jobs, average job execution time, average rejected jobs during collision resolution, current values for active, canceled, rejected jobs, current job execution time. Inside the configuration category, parameters refer to the type of class configuration used load balancing and fail over policies. GridGain allows particular configuration for each of the nodes in the Grid either by code or using different configuration files or the same configuration for all of the nodes. The configuration parameters that refer to early load balancing configuration policy can have the possible values of Grid Adaptive Load Balancing, Grid Affinity Load Balancing, Grid Coherence Load Balancing, Grid Round Robin Load Balancing, Grid Weighted Random Load Balancing, each with a subset of parameters established either per node or per Grid structure. Similarly, fail over policy configuration group of parameters are described by the set of all possible values in GridGain. All monitored parameters are also logged locally. A fragment example of logging the information sent inside a datagram by using the ApMon logger is given below:
A level of detail can be added to obtain configuration values such as the type of policy used, as well as specific values - values for weights, or different time parameters. Another parameter that can be included in this category is the number of Grid nodes. B. Monitoring changes in version 3 of Grid Gain Starting from version 3.0 of GridGain, some modules for monitoring have been added [5] - namely GridGain Visor and JMX based monitoring tool. GridGain Visor module is available in commercial, enterprise mode and is a script based monitoring module. It does not offer a graphical visualization of monitored data, but data can be filtered by writing users scripts that show only nodes that correspond to certain constraints on parameters. Also, jobs can be directly deployed from this console. Another new feature is the introduction of a more advanced JMX Instrumentation for JMX Monitoring. Visor can monitor not only performance on the Grid but also its topology. The Visor or JMX tool do not influence the requirements determined for the proposed solution. No important changes or addition of relevant parameters has been noticed at Grid benchmarking/metrics level or at the possible configuration values. IV. DATA VISUALIZATION AND ANALYZER MODULE The collected data should be available at a centralized location, but also accessible at request at any of the sites of Grid or at a site unrelated to the Grid structure. In order to accomplish this availability of monitored information, data is requested using the ML Web Service, the Java-Axis implementation. A. Filtering data Filtering data refers to analyzing the values of the collection of gathered parameters over an established history or on the entire collection and to further applying various
158
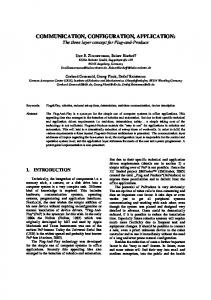
from GridGain metrics and from ApMon - such examples are the CPU usage, memory usage or information related to jobs executing on Grid nodes. Other aspects that need to be considered in the evaluation of the solution are scalability reported to the number of resources and Grid nodes, an extensive and adjustable set of monitoring parameters, network traffic and bottleneck introduced by monitoring, level of intrusion on applications running on the Grid, as well as other issues of performance monitoring of real-time systems. Accuracy and relevance of measurement. A number of test executions for collecting information have been performed on a test application in similar conditions in order to evaluate the difference of value between the parameters of the same significance and to determine whether the solution is capable of detecting in useful time the changes that occur in the Grid configuration. For example, the analysis of CPU usage shows a median difference of less than 5% between the values obtained from metrics, that demonstrated the made assumption about the small delay that exist for these measurements (see Figure 3). This deviation can be considered acceptable in order to reduce the overhead introduced by measuring the parameters with ApMon. An observation is the fact that a dedicated resource was not used for Grid deployment can influence the evaluation of accuracy.
computing operations in order to obtain some statistical information. Possible statistical information can refer to average values on a node, on all the nodes over the hole history or a time interval. At this step, a decision needs to be made in order to identify abnormal values that can be caused by errors in the measurement mechanism from the values due to problems on the Grid nodes. The decision can be taken either at the central storage location for the parameters or at the site of each requester. Because at this moment, a excellent mechanism for distinguishing measurement errors has not been developed, an alternative solution is not to eliminate the suspected values from the collection of data sent to the requester, but to mark differently the peek values and the abnormal values. B. Management Module/Console The purpose of the management module is the visualization of gathered data and to allow the operator to modify the configuration of a certain Grid node within the Grid or parameters related to the configuration of the entire Grid. This module exposes information using ML Web Service to obtain data from a central repository. Two methods have been implemented in order to modify a configuration. The first method consists in generating a modified configuration file by parsing the old xml configuration file and replacing the old values of the changed parameters with the new values; a drawback is the necessity of accessing in real time the configuration file for each node because it can contain additional Spring configuration Beans that the ones indicated by the monitored parameters; these parameters need to remain the same. The second method dynamically modifies the configuration from Java code and also needs to access the network locations of the nodes. They both imply a centralized control structure where all nodes within a Grid can be accessed based on their network address or name. An observation is that the current configuration of the node can reject the proposed configuration and use the old values. All changes made by the operator take place inside a graphical module that also deals with the visualization of data. A user interface implementation would preferable to a script console. The operator can choose the new values, after seeing the current ones and the necessary configuration file is send in the background to the destination Grid node(s).
Figure 3. Evaluation of execution time for different experiments with and without monitoring
The set of parameters covers the entire set of standard performance parameters and configuration related parameters, but can be reduced to a subset according to the nature of the Grid and the jobs executing at a certain moment.
V. E VALUATION OF THE PROPOSED SOLUTION VI. P OSSIBLE U SAGE IN R E -E VALUATING G RID C ONFIGURATION AND S CHEDULING
The evaluation refers to the accuracy and relevance of the measured parameters in the context of Grid monitoring and the performance of applications running on the monitored Grid environment and also to the level of usage in evaluating and adjusting the existing configuration. The evaluation helps to decide the accuracy of the parameters that have the same significance - parameters that can be obtained both
The decision of changing some of the configuration and scheduling parameters can be taken independently by the operator according to its experience after reviewing the values or history of measured parameters, with the peek values marked accordingly.
159
assumed theoretical influence of configuration parameters with the purpose to insure a more qualitative monitoring approach. These test should not overlook the influence of the type of jobs executed on the Grid nodes and their necessities at both computational and memory/storage capacity levels. Dynamic adaptability and real-time issues. The problem of dynamically adapting the configuration of the Grid to increase the perceived performance should be addressed - find a mechanism based on a set of rules that can compute and apply the necessary changes. Explore the interaction between the modules. Integrate the existing modules in order to discover the possible interaction problems between them on a real system analyze and improve the quality of system proposals for reconfiguration. Consider reducing the number of monitored parameters according to traffic and their relevance. Security issues. Address security issues in the management interface - such as the necessity of authentication based mechanism for both data visualization and monitoring module, provide feedback if the remote node has not accepted the proposed configuration because security issues.
A useful feature would be to allow the monitoring system to present the operator with suggestions computed based on the history of monitored parameters for jobs with a longer execution time or based on some theoretical, model based assumptions that relate existing configuration to the values of some performance parameters. The type of jobs deployed in the Grid can have an influence in this evaluation. In order to improve the performance of the Grid, decisions would need to be taken in real time. A set of rules based on experience or theoretical assumptions can be the base of such a system making the suggestions. This set should be extensible and easily changeable by modifying the rules according to previous observations that confirmed or proved wrong the initially made assumptions. For example, such a rule could be if the some of the performance parameters on a certain node show a decrease overtime while executing a number of jobs, consider enabling a job stealing mechanism by forwarding some of the jobs to less used nodes inside the Grid and make the necessary changes in the configuration files. If the new configuration does not yield any significant change in performance, either reverts to the original configuration or apply an additional rule. Such a solution would lead to a certain delay in computing the rule that should be applied in a certain situation and assumes control of all configuration files and versioning for these files. A form of adaptive control technique as the ones described in [6] needs to be implemented.
VIII. C ONCLUSION Grid monitoring is a challenging task due to the variety of resources and requirements involved. However, the GridGain platform contains means for benchmarking and accessing different metrics and allows the integration with a set of monitoring tools from MonALISA. The idea is to insure not only a quantitative approach on the monitored parameters, but also a qualitative approach related to performance. The set of parameters should cover all relevant aspects and should present a real time view about both performance and configuration. Instrumentation, analysis and visualization should work together to obtain optimization and dynamic configuration and adaptation. The report indicates the structure of a excellent monitoring solution for GridGain, introduces the necessary modules and proposes the way the modules should work together. The solution is still subject to development, with a number of key decisions that need to be taken.
VII. O PEN I SSUES The creation of the necessary modules and executed tests identified the directions to be followed in order to improve and further develop the proposed solution. Most developments refer to further implementations for the structure of existing modules and to insure a better integration and cooperation between these modules. Changes in the procedure for enabling the monitoring service. Currently, monitoring can be enabled from inside the application that deploys jobs on Grid nodes by configuring and starting an instance of extended ApMon; the type of monitored parameters is also configurable. This approach needs to be modified to allow enabling of monitoring service during a jobs execution or independently from a jobs deployment. This can only be approached by using a better connectivity, discovery between the Grid environment and the monitoring modules. Data visualization module. Data visualization module should generate graphics and allow parameters to be shown and filtered based on their timestamps; peek values and anomalies of the observed parameter values should be marked accordingly. Relate current configuration to performance issues. More tests that relate existing Grid configuration to the performance need to be performed in order to confirm the
ACKNOWLEDGMENT The research presented in this paper is supported by national project: ”SORMSYS - Resource Management Optimization in Self-Organizing Large Scale Distributes Systems”, Contract No. 5/28.07.2010, Project CNCSIS-PN-II-RU-PD ID: 201. The work has been co-funded by the Sectorial Operational Program Human Resources Development 20072013 of the Romanian Ministry of Labor, Family and Social Protection through the Financial Agreement POSDRU/89/1.5/S/62557.
160
R EFERENCES
[15] R.L. Ribler, J.S. Vetter, H. Simitci, D.A. Reed, Autopilot: adaptive control of distributed applications, in: Proceedings of the Seventh IEEE Symposium on High-Performance Distributed, 1999
[1] *** GridGain home page, http://www.gridgain.com/, Accessed on February 15th, 2012. [2] Dobre, C.; Voicu, R.; Legrand, I.; Monitoring large scale network topologies, Intelligent Data Acquisition and Advanced Computing Systems (IDAACS), 2011 IEEE 6th International Conference on, 15-17 Sept. 2011, Prague, pp: 218-222, ISBN: 978-1-4577-1426-9
[16] M. Baker and G. Smith, GridRM: A Resource Monitoring Architecture for the Grid, Proceedings of the Third International Workshop on Grid Computing, Lecture Notes In Computer Science; Vol. 2536, pp 268 - 273, 2002
[3] S. Zanikolas and R. Sakellariou, A taxonomy of grid monitoring systems, Future Generation Computer Systems, 21(1), January 2005, pp. 163–188.
[17] Xuehai Zhang, Jeffrey L. Freschl, and Jennifer M. Schopf. 2007. Scalability analysis of three monitoring and information systems: MDS2, R-GMA, and Hawkeye. J. Parallel Distrib. Comput. 67, 8 (August 2007), 883-902.
[4] Jeffrey Joyce, Greg Lomow, Konrad Slind, and Brian Unger. 1987. Monitoring distributed systems. ACM Trans. Comput. Syst. 5, 2 (March 1987), 121-150.
[18] Chao-Tung Yang, Tsui-Ting Chen, and Sung-Yi Chen. 2007. Implementation of Monitoring and Information Service Using Ganglia and NWS for Grid Resource Brokers. In Proceedings of the The 2nd IEEE Asia-Pacific Service Computing Conference (APSCC ’07). IEEE Computer Society, Washington, DC, USA, 356-363.
[5] GridGain 3.0 white paper, Paper available on-line at http://www.gridgain.com/media/gridgain white paper.pdf, Copyright 2005-2011 GridGain Systems Inc., Accessed on February 15th, 2012.
[19] Helene N. Lim Choi Keung, Justin R. D. Dyson, Stephen A. Jarvis, and Graham R. Nudd. 2003. Predicting the Performance of Globus Monitoring and Discovery Service (MDS2) Queries. In Proceedings of the 4th International Workshop on Grid Computing (GRID ’03). IEEE Computer Society, Washington, DC, USA, 176-.
[6] Jeffrey S. Vetter and Daniel A. Reed. 2000. Real-Time Performance Monitoring, Adaptive Control, and Interactive Steering of Computational Grids. Int. J. High Perform. Comput. Appl. 14, 4 (November 2000), 357-366. [7] W. Zhang, S. Chen, L. Zhang, Shui Yu and F. Ma, AGARM: An Adaptive Grid Application and Resource Monitor Framework, Lecture Notes in Computer Science, 2005, Volume 3514/2005, 815-821
[20] Fatos Xhafa and Ajith Abraham. 2010. Computational models and heuristic methods for Grid scheduling problems. Future Gener. Comput. Syst. 26, 4 (April 2010), 608-621.
[8] P. Holub, M. Kuba, L. Matyska and M. Ruda, Grid Infrastructure Monitoring as Reliable Information Service, Lecture Notes in Computer Science, 2004, Volume 3165/2004, 39-48
[21] Kolodziej J., Xhafa F.: Modern Approaches to Modelling User Requirements on Resource and Task Allocation in Hierarchical Computational Grids, ’Applied Mathematics and Computer Science’, Vol. 21 No. 2, pp. 243-257
[9] G. Gombs, C. Marosi and Z. Balaton, Grid Application Monitoring and Debugging Using the Mercury Monitoring System, Lecture Notes in Computer Science, 2005, Volume 3470/2005, 193-199
[22] Ciprian Dobre, Monitoring and Controlling Grid Systems, in Towards a Global Interconnected Infrastructure Ed. by Preve, Nikolaos 2011. XVI, 326 p. 235 mm Verlag/Jahr: SPRINGER, BERLIN 2011, ISBN: 0-85729-675-2
[10] B. Tierney, R. Aydt, D. Gunter, W. Smith, M. Swany, V.Taylor, and R. Wolski, A Grid Monitoring Architecture, GWDPerf-16-3, Global Grid Forum, August 2002
[23] B. Tierney, D. Gunter, NetLogger: a toolkit for distributed system performance tuning and debugging, Proceedings of the IFIP/IEEE 8th International Symposium on Integrated Network Management vol. 246, pages. 97-100, 2003
[11] R. S. Montero, E. Huedo, and I. M. Llorente. 2006. Benchmarking of high throughput computing applications on Grids. Parallel Comput. 32, 4 (April 2006), 267-279.
[24] H.L. Truong, T. Fahringer, SCALEA-G: A Unified Monitoring and Performance Analysis System for the Grid, Technical Report, Institute for Software Science, University of Vienna, 2003
[12] OK Kwon, J Hahm, S Kim, J Lee, A grid resource allocation system for scientific application: Grid resource allocation services package (GRASP), Frontiers of Grid, 2005
[25] A. Cooke, A.J.G. Gray, L. Ma, W. Nutt, J. Magowan, M. Oevers, P. Taylor, R. Byrom, L. Field, S. Hicks, J. Leake, M. Soni, A.Wilson, R. Cordenonsi, L. Cornwall, A. Djaoui, S. Fisher,N. Podhorszki, B. Coghlan, S. Kenny, and D. OCallaghan, RGMA: an information integration system for grid monitoring, in: Proceedings of the 10th International Conference on Cooperative Information Systems, 2003
[13] S. Andreozzia, N. De Bortolib, S. Fantinelc, A. Ghisellia, G.L. Rubinia, M.C Vistolia, GridICE: a monitoring service for Grid systems, Future Generation Computer Systems, Vol. 21, Pages 559-571, 2005 [14] F. Bonnassieux, R. Harakaly, P. Primet, Automatic services discovery, monitoring and visualization of grid environments: The MapCenter approach, Proceedings of the First European Across Grids Conference, vol. 2970 of Lecture Notes in Computer Science, Springer-Verlag, 2004, pp. 222-229.
161


![Hyperscaling Your SaaS Infrastructure - GridGain [PDF]](https://m.moam.info/img/260x300/hyperscaling-your-saas-infrastructure-gridgain-pdf_648040b9098a9e576d8b4604.jpg)


![Automate Configuration of Application Networking Services in the Cloud [PDF]](https://m.moam.info/img/260x300/automate-configuration-of-application-networking-s_678701a0098a9e9d7c8b45a0.jpg)