this work showing how to separate GRM and PROVE from the P-GRADE ... monitor redesigned for semi-on-line general application monitoring in a grid.
Application Monitoring in the Grid with GRM and PROVE* Zoltán Balaton, Péter Kacsuk and Norbert Podhorszki MTA SZTAKI H-1111 Kende u. 13-17. Budapest, Hungary {balaton, kacsuk, pnorbert}@sztaki.hu
Abstract. GRM and PROVE were originally designed and implemented as part of the P-GRADE graphical parallel program development environment running on clusters. In the framework of the biggest European Grid project, the DataGrid project we investigated the possibility of transforming GRM and PROVE to a Grid monitoring infrastructure. This paper presents the results of this work showing how to separate GRM and PROVE from the P-GRADE system and to turn them into standalone Grid monitoring tools. Keywords: Grid monitoring, message passing programs, performance visualisation.
1. Introduction GRM and PROVE are available as parts of the P-GRADE graphical parallel program development environment. GRM is a semi-on-line monitor that collects information about an application running in a distributed heterogeneous system and delivers the collected information to the PROVE visualisation tool. The information can be either event trace data or statistical information of the application behaviour. Semi-on-line monitoring means, that any time during execution all available trace data can be required by the user and the monitor is able to gather them in a reasonable amount of time. Semi-on-line monitoring keeps the advantages of on-line monitoring over off-line monitoring. The performance or status of an application can be analysed or visualised during the execution. The scalability of on-line monitoring is better than that of off-line monitoring. Data can be analysed in portions and unnecessary data can be discarded before processing new portions of data. Moreover semi-on-line monitoring puts less overhead on monitoring: trace data are buffered locally and it is sent in larger data blocks than in on-line monitoring. It also stresses the collection site and the trace processing application less than on-line collection since trace is sent only when requested. This way the overload of the collector can be avoided. PROVE supports the presentation of detailed event traces as well as statistical information of applications. It can work both off-line and semi-on-line and it can be
*
This work was supported by a grant of the Hungarian Scientific Research Fund (OTKA) no. T032226
used for observation of long-running distributed applications. Users can watch the progress of their application and realise performance problems in it. P-GRADE is a graphical programming environment integrating several tools to support the whole life cycle of building parallel applications. It provides an easy-touse, integrated set of programming tools for development of general message passing applications to be run in heterogeneous computing environments. Its main benefits are the visual interface to define all parallel activities in the application, the syntax independent graphical definition of message passing instructions, full support of compilation and execution in a heterogeneous environment and the integrated use of the debugger and the performance visualisation tool. Components of the P-GRADE program development environment are the GRAPNEL graphical parallel programming language, the GRED graphical editor to write parallel applications in GRAPNEL, the GRP2C precompiler to produce the C code with PVM or MPI function calls from the graphical program, the DIWIDE distributed debugger, the PROVE execution and performance visualisation tool and the GRM distributed monitor. For detailed overview of the tools in P-GRADE, see [6] and [7]. GRM is described in [3], while PROVE is presented in [4]. Further information, tutorial and papers about P-GRADE can be found at [5]. In this paper, we present the problems and implementation issues of the GRM monitor redesigned for semi-on-line general application monitoring in a grid environment. In the next section, we shortly present the original design goals and the structure of GRM. In section 3, we discuss the problems with GRM in a grid environment and present our solutions to these problems. Finally, Section 4 compares GRM with NetLogger.
2. The GRM semi-on-line monitoring tool The monitoring in GRM is event-driven, both trace collection and counting are supported. The measurement method is software tracing and the instrumentation method is direct source code instrumentation. For a classification of monitoring techniques, see [8]. P-GRADE controls the whole cycle of application building, and source code instrumentation is supported by graphics. The precompiler inserts instrumentation function calls into the source code and the application process generates the trace events. The main goals in the original design of GRM have been strongly related to the P-GRADE environment. The monitor and the visualisation tool are parts of an integrated development environment and they support monitoring and visualisation of P-GRADE applications at source level. The monitor is portable among different UNIX operating systems (Irix, Solaris, Linux, Tru64 UNIX, etc.) which is achieved by using only standard UNIX programming solutions in the implementation. GRM is a semi-on-line monitor, that is, the user can let GRM to collect the actual trace data or statistical information about the application any time during the execution. Semi-online monitoring is very useful for the evaluation of long-running programs and for supporting debugging with execution visualisation. Both trace collection and statistics are supported by the same monitor and the same instrumentation of the application.
2
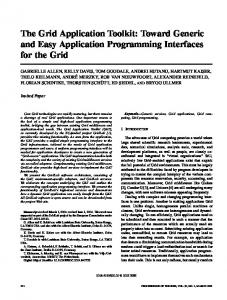
Trace collection is needed to pass data to PROVE for execution visualisation. Statistics mode has less intrusion to the execution by generating fixed amount of data and it supports initial evaluation of long-running applications. For trace storage shared-memory segments have been used on each host for two main reasons. First, semi-on-line monitoring requires direct access to all trace data any time during the execution. The shared buffer can be read by a Local Monitor independently from the application process, when the user asks to collect trace data. Second, if a process aborts its trace data can be saved and analysed to the point of failure. GRM is a distributed monitor. It consists of the following three main components (see its structure in Fig. 1): Client library (See "Appl. Process" in the figure.) The application is instrumented with functions of the client. Both trace events and statistics can be generated by the same instrumentation. The trace event types support the monitoring and visualisation of GRAPNEL programs. An instrumented application process does not communicate outside of the host it is running on. It places trace event records or increments counters in a shared memory buffer provided by the Local Monitor. Local Monitor A Local Monitor (LM) is running on each host where application processes are executed. It is responsible for handling trace events from processes on the same host. It creates a shared memory buffer where processes place event records directly. Thus even if the process terminates abnormally, all trace events are available for the user up to the point of failure. In statistics collection mode, the shared memory buffer is used to store the counters and LM is responsible for generating the final statistics data in an appropriate form. Main monitor A Main Monitor (MM) is co-ordinating the work of the Local Monitors. It collects trace data from them when the user asks or a trace buffer on a local host becomes full. Trace is written into a text file in Tape/PVM format (see [9]), which is a record based format for trace events in ASCII representation. MM also performs clock synchronisation among the hosts. Both trace collection and statistics are supported by the same monitor and the same instrumentation of the application. Trace collection is needed to give data to PROVE for execution visualisation. PROVE communicates with MM and asks for trace collection periodically. It can work remotely from the Main Monitor process. With the ability of reading new volumes of data and removing any portion of data from its memory, PROVE can observe applications for arbitrary long time. The integration of GRM into a development environment made it possible to put several functionalities of a stand-alone monitoring tool into other components of P-GRADE. For example: − instrumentation is done in the GRED graphical editor,
3
− trace events of different processes are not sorted into time order since the preprocessing phase in PROVE does not need a globally sorted trace file, − the monitor is started and stopped by GRED, − Local Monitors are started on the hosts defined by the environment, − the monitor does no bookkeeping of processes Host 1 Main Monitor MM
Trace file
Local Monitor LM
Local Monitor LM
Host 2 Appl. Process
Host 3 Appl. Process
Appl. Process
Fig. 1. Structure of GRM
Although the start and exit of the application processes are also events that are put into the trace buffer, monitor processes do no bookkeeping so GRM cannot recognise when the application is finished. The simplest solution was to leave everything to GRED that already knows when the application terminates. GRED sends a message to the MM after program termination and GRM collects the yet uncollected trace from the Local Monitors.
3. Monitoring applications in the Grid Monitoring of applications in a grid environment brings new requirements for a monitoring tool: 1. Scalability to a large number of resources and events is very important. 2. The problem of starting up the monitoring system in the grid must be solved. 3. Measurements must have accurate cross-site timestamps. In addition, the original design goals of GRM must be reviewed. Specifically, two goals must be changed: 1. General application monitoring should be supported (not only GRAPNEL). This also requires user defined event data types. 2. GRM and PROVE should be standalone monitoring and visualisation tools (not part of an integrated development environment).
4
Other goals are unchanged but they are now requirements not just design goals. Portability remains very important, since the grid consists of heterogeneous resources. Semi-on-line monitoring must be supported, because the grid is a changing environment, where off-line monitoring does not help. Both statistics and event trace collection is needed to monitor large and long running applications that are typical in the grid. Getting trace data to the point of failure is very important, since errors are more frequent in a grid environment. Remote execution of applications from the monitoring data processing site is the normal operation in the grid. 3.1.
Scalability
To be usable in a grid environment, a general application monitor must be able to handle a large number of resources and events. Since Local Monitors store event trace in local buffers GRM can already handle large sets of trace data. When the local trace buffer is full, its content should be transferred to some other place to make empty space for further data. To easily recognise the influence of the monitor on the application execution and possibly eliminate it in the statistics, GRM uses a special trace collection scheme in the original design. When a buffer is full all processes of the application are stopped, the Main Monitor collects all trace data from each host and sends the full trace to PROVE or writes it into a global trace file. The trace collection scheme in GRM is the following: 1. When the buffer on a host is full (more exactly, it is filled up to a predefined threshold is), the process actually recognising this situation notifies the LM. 2. The LM notifies the MM that its buffer needs to be emptied. 3. The MM starts a global trace collection: − First it asks Local Monitors to stop the application processes. − When all processes are stopped the MM collects the trace data from each LM. − MM sends data further to PROVE or writes it into a trace file. − MM finishes the collection by notifying Local Monitors, which let the processes continue their execution. Since the MM collects data from the hosts one after the other and does not merge the traces, we can only ensure that trace events from individual hosts are in time order. The tool processing the trace should sort data itself in a pre-processing phase. PROVE does this pre-processing and this greatly simplifies the Main Monitor. Stopping all processes before trace collection and restarting them after finishing it ensures that no events are generated by the application during trace collection. As a result, the collection phase can be recognised in the trace (and visualisation), since timestamps are either less than collection start time or greater than collection finish time. This solution makes it possible to eliminate the collection overhead from the statistics. Unfortunately the above trace collection scheme does not work well in a grid environment. Here stopping all processes might take a long time and it is not scalable for a large number of resources, either. Because of this, the collection scheme must be changed. In a grid, the MM does not initiate a global trace collection when a LM indicates that its buffer is full. Instead, it only collects trace data from this LM.
5
The current handling of the local buffer (by setting the threshold appropriately) makes GRM scalable to a large number of events. However, its scalability could be further enhanced by modifying Local Monitors to support double buffering or to use local trace files to temporarily store trace data until the Main Monitor collects it. 3.2.
Standalone Tool and Start-up
In the original design, start-up and termination of GRM is controlled by GRED. The Main Monitor of GRM has no information about where to start the Local Monitors. GRED provides all the necessary information since it knows the hosts from a configuration file, and directories containing binaries and their access method (host name, user account, remote shell program name) are defined in dialogs of GRED or in its start-up script. The start-up of GRM in P-GRADE goes in the following way: − GRED launches the MM with a script (on a remote host or locally), GRED passes its listening socket port number as an argument. − MM connects to GRED on the given port − GRED sends information about the execution hosts and the MM launches a LM on each host − GRED sends the trace file name to the MM − GRED asks the MM to start the initial clock synchronisation − MM reports the finish of the clock synchronisation − GRED starts the application After starting, the application processes call an instrumentation function that connects them to their Local Monitors. The LM creates a FIFO through which processes can connect to it and get the shared memory segment (and semaphore) identifiers. The name of the FIFO is predefined and it depends only on the user id. Because of this, only one application can be monitored per user. After receiving the shared identifiers, the processes can start generating trace events. The client library functions in the processes recognise if the shared buffer is almost full and tell this fact to the LM. This simplifies the structure of the LM process so it can wait in a select system call most of the time and does not consume resources. Problems with the above if GRM is used as a standalone tool in a grid are: 1. There is no GRED, the user interfaces with GRM directly. Either via the command line or via tools implemented using the monitor control API of GRM. 2. FIFO of the LM should have a name that does not depend on the user id only, since on a grid resource more than one user can be mapped to the same local user id. 3. The Local Monitors cannot be started on a host explicitly, since it is the competence of the local job-manager on a grid resource to decide where jobs will run. This local policy cannot be influenced. Because of this, the Main Monitor cannot start the Local Monitors. It should be prepared to accept connections from them instead. 4. The executable of the Local Monitor should be transferred to the grid resource where the application is run. The easiest way to do this is to link the LM executable to the application as a library. This way we have a single executable
6
which contains both the application and the LM, and can be started the same way as the application. This solution is independent of any specific grid implementation but requires that the application can be relinked. However, the application has to be instrumented for monitoring with GRM, so this can be assumed. The start-up of GRM in a grid environment goes in the following way: − The user launches the MM. − The MM gives back its port number. The hostname and port number pair identifies this MM. − The user sets the trace file name (e.g. using the command line interface to the MM). − The user starts the application that also contains the LM linked in, giving it the MM identifier as a parameter. − The application is started on some resources in the grid. After starting, the application processes call an instrumentation function that tries to connect them to the Local Monitor through a FIFO that contains the MM identifier in its name. If a process detects that there is no LM listening on this FIFO yet, it forks, and becomes the Local Monitor. Its child continues as an application process. The LM creates the shared buffer and the FIFO through which processes can now connect to it. To resolve the race condition the processes should wait for a random time interval before trying to connect to the LM. This way the process that picked the smallest wait time will do the fork and create the Local Monitor. In addition, when an LM fails to bind its listening socket to the FIFO, it should free all allocated resources and become inactive, since in this case another process should have already successfully created the LM. When an LM is created, the application processes connect to it and the LM connects to the MM. After successfully connecting to the Main Monitor, the LM notifies the processes. From this point, the processes can start generating trace events. 3.3.
Clock Synchronisation
The generated trace can be globally consistent if clock synchronisation is performed regularly and local timestamp values are adjusted to a consistent global timestamp. The offsets of the clocks can be determined by the well-known "ping-pong" message exchange. The message exchange in GRM is done through the sockets connecting Local Monitors with the Main Monitor. After stopping the application processes but before starting trace collection the MM performs the synchronisation with LMs. This clock synchronisation technique works well on clusters of workstations connected by a LAN but grids require a more sophisticated algorithm. In a grid environment the resources (e.g. clusters) are usually connected by WAN links that have higher latency than the LAN used inside the resource. GRM determines the clock offsets of each LM (running on a host at the remote grid resource) relative to the host of the MM but the accuracy of this measurement is limited by the latency of the WAN link. Because of this, the error of the clock-offset measurement can be comparable to or bigger than the time intervals between events generated at the remote resource (e.g. the start and end of a communication on the LAN).
7
Since there are several tools (e.g. NTP) that can be used to synchronise clocks, this problem can be solved independently from monitoring. For this reason, GRM does not support clock synchronisation in grid environments, instead it assumes that the clocks are already synchronised. 3.4.
User Defined Trace Event Types
The event types originally supported by GRM were only those that are required for monitoring and visualisation of GRAPNEL programs. For general application monitoring, GRM should be re-designed to support arbitrary event types. This is achieved by a two step procedure. First it should be possible to define an event type and then event records of this type can be generated by a simple function call giving event data as function parameters. The client library function int GMI_DefineEvent(int eid, char *format, char *dsc); is provided for defining trace event formats in the application process. A description for the event type can be given in the dsc parameter. The format parameter should be given in the standard printf format. This is used by the trace generation library when printing an event string. The integer eid is the identifier of the event type that can be used in the following function: int GMI_Event( int eid, ...); This will generate a trace event with the parameters given as variable arguments corresponding to the format of this event type. These two functions give a general API for trace event generation. However, for easier use GRM provides additional functions for some common even types. Block begin and end pairs are very common type of events to identify e.g. procedure calls and exits in the application. Message passing event types are predefined to generate send and receive events. GRM in the newest versions of P-GRADE already uses this general API to generate GRAPNEL events. In fact, original GRAPNEL event types are internally implemented with the new API and instrumented P-GRADE applications use the original event functions.
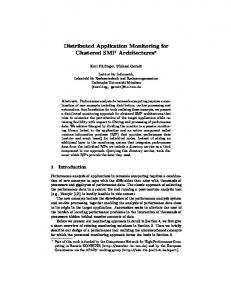
4. Comparison with NetLogger NetLogger is a distributed application, host and network logger developed at the Lawrence Berkeley National Laboratory in the USA, see [1] and [2]. Its main suggested application areas are performance and bottleneck analysis, selecting hardware components to upgrade (to alleviate bottlenecks), real-time and postmortem analysis of applications and correlating application performance with system information. Its logical structure can be seen in Fig. 2, where netlogd is a data-logging daemon that writes trace data into the trace file. Sensors and instrumented application processes can generate events in ULM (Universal Logger Message) format using the client library of NetLogger and send them to the netlogd daemon. Sensors can run remotely from netlogd and send data through the network.
8
The basic difference between GRM and NetLogger is that GRM uses a shared memory buffer to store trace events locally before sending them to the Main Monitor on another host. In NetLogger, processes should store trace events in their local memory or they should send them right after their generation to the remote collector process. Local Host netlogd
Trace file
Host 1
Host 2
Appl. Process
sensors
Appl. Process
Fig. 2. Structure of NetLogger
While NetLogger’s collection mechanism is based completely on the push data model, GRM uses a mixed push/pull mechanism for the data transfer. In the push model, data is sent to its target without checking the target’s availability of receiving. In the pull model, data is stored locally and is sent to a target only for a specific query from the target. GRM works with both mechanisms. When the local buffer is full the Local Monitor sends (pushes) data to the main collector. However, when the buffer is not full yet, the target (e.g. a visualisation tool) can make a request for all available data. In this case, GRM collects (pulls) all available data from the Local Monitors. The advantages of GRM over NetLogger are: − Local buffering of trace data is done independently from the monitored application, so the Main Monitor can collect it any time. In NetLogger data should be sent immediately to the remote netlogd process or can be buffered locally but in this case, the visualisation tool must wait until the block of trace data arrives. In GRM the visualisation tool can send a query for trace data any time and the monitor collects data from the Local Monitor processes. − Efficient data transfer. With local buffering in a shared memory segment, application processes and sensors can give trace events to the monitoring tool quickly so they can have very low intrusiveness. Thus, the application runs almost as efficiently as without instrumentation. In NetLogger, the application process is blocked while it sends trace to the collecting process over wide-area network. − Scalability. The use of Local Monitors, local buffering and semi-on-line trace collection mechanism makes GRM more scalable than NetLogger in the sense of number of processes, number of events and event rate.
9
− Trace data to the point of failure. Local buffering in a shared memory segment helps to keep all trace events when a process aborts. Thus, the visualisation tool can show all events until the point of failure.
5. Conclusions A grid environment brings new requirements for monitoring. The GRM monitor and PROVE performance visualisation tool of the P-GRADE graphical parallel programming environment are good candidates to be standalone grid-application monitoring and performance visualisation tools. We examined their features and monitoring mechanisms and compared them to the requirements of a grid. With some modifications and redesign GRM can collect trace files from large distributed applications in a grid that can be examined in PROVE. In the design of GRM, scalability and problematic start-up issues in grid were considered. The new version of GRM for grid applications will be implemented based on this design.
6. References [1] D. Gunter, B. Tierney, B. Crowley, M. Holding, J. Lee: "NetLogger: A Toolkit for Distributed System Performance Analysis", Proceedings of the IEEE Mascots 2000 Conference (Mascots 2000), August 2000, LBNL-46269 [2] B. Tierney et al.: "The NetLogger Methodology for High Performance Distributed Systems Performance Analyser", Proc. of the IEEE HPDC-7 (July 28-31, 1998, Chicago, IL) LBNL-42611 [3] N. Podhorszki, P. Kacsuk: "Design and Implementation of a Distributed Monitor for Semi-on-line Monitoring of VisualMP Applications", Proceedings of DAPSYS’2000 Distributed and Parallel Systems, From Instruction Parallelism to Cluster Computing, Kluwer Acad. Publ., pp. 23-32, 2000. [4] P. Kacsuk: Performance Visualization in the GRADE Parallel Programming Environment, HPCN Asia, Beijing, China, 2000. [5] P-GRADE Graphical Parallel Program Development Environment: http://www.lpds.sztaki.hu/projects/p-grade [6] P. Kacsuk, G. Dózsa, T. Fadgyas, and R. Lovas: "The GRED graphical editor for the GRADE parallel programming environment", FGCS journal, Special Issue on HighPerformance Computing and Networking, Vol. 15 (1999), No. 3, April 1999, pp. 443-452. [7] P. Kacsuk: "Systematic macrostep debugging of message passing parallel programs", FGCS journal, Special Issue on Distributed and Parallel Systems, Vol. 16 (2000), No. 6, April 2000, pp. 609-624. [8] J. Chassin de Kergommeaux, E. Maillet and J-M. Vincent: "Monitoring Parallel Programs for Performance Tuning in Cluster Environments", In "Parallel Program Development for Cluster Computing: Methodology, Tools and Integrated Environments" book, P.Kacsuk and J.C.Cunha eds, Chapter 6., will be published by Nova Science in 2000. [9] É. Maillet: "Tape/PVM: An Efficient Performance Monitor for PVM Applications. User's guide", LMC-IMAG, Grenoble, France, 1995. Available at http://wwwapache.imag.fr/software/tape/manual-tape.ps.gz
10