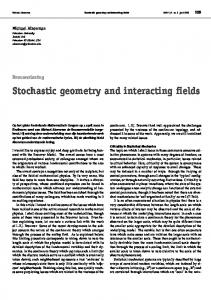
Group Dynamics of Phototaxis: Interacting stochastic many-particle systems and their continuum limit Devaki Bhaya1 , Doron Levy2 , and Tiago Requeijo3 1
2
3
Department of Plant Biology, Carnegie Institution of Washington, Stanford University, Stanford, CA 94305.
[email protected] Department of Mathematics, Stanford University, Stanford, CA 94305-2125.
[email protected] Department of Mathematics, Stanford University, Stanford, CA 94305-2125.
[email protected]
Summary. In this paper we introduce new models for describing the motion of phototaxis, i.e. bacteria that move towards light. Following experimental observations, the first model describes the locations of bacteria, an internal property of the bacteria that is related to the group dynamics, and the interaction between the bacteria and the medium in which it resides. The second model is a new multi-particle system following the same quantities as in the first model. The main theorem shows how to obtain a new system of PDEs, which we refer to as the phototaxis system as the limit dynamics of the multi-particle system. Numerical simulations are provided.
1 Introduction Microbes live in environments that are fluctuating and often limiting for growth. Thus they have evolved several sophisticated mechanisms to sense minute changes in important environmental parameters such as light and nutrients. Most bacteria also have complex appendages that allow them to move, so they can swim or crawl into optimal conditions. This combination of sensing changes in the immediate environment and transducing these changes to a flagellar motor allows for movement in a particular direction: a phenomenon known as chemotaxis or phototaxis [1]. Many of the molecular players in this pathway of signal transduction are now known and the flagella which is used for motility is also extremely well characterized [7, 12]. Cyanobacteria are a lineage of ancient, ubiquitous photosynthetic microbes that use a different surface appendage for motility. They use thin, long flexible pili which are referred to as Type IV pili [2]. The pili adhere to various surfaces and are alternately extended and retracted to slowly pull the cell body in a particular direction. This movement requires energy in the form of ATP which is provided to a motor protein encoded by pilT. Interestingly, pili are multifunctional organelles involved in a host of important biological processes such as DNA uptake, pathogenicity and
2
Devaki Bhaya, Doron Levy, and Tiago Requeijo
biofilm formation [6]. Yet we know much less about these organelles that we do about flagella synthesis or regulation. Cyanobacteria track light direction and quality to optimize conditions for photosynthesis. The motility toward a light source is called “phototaxis” and requires (i) a photoreceptor (ii) a signal transduction event and (iii) the motility apparatus or pili. Many of the molecular components for pilus biosynthesis and signal transduction have been identified in recent years [3, 4]. We have also taken a genetic approach to identify mutants in the process of phototaxis. Time-lapse video microscopy can also be used to monitor the movement of individual cells and groups of cells [5]. These movies suggest that there is both a group dynamic between cells, as well as the ability of single cells to move directionally. The various patterns of movement that we observe appear to be a complex function of cell density, surface properties and genotype. Very little is known about the interactions between these parameters. Some models have been proposed to explain pilus dependent social motility in Myxococcus xanthus which have led to important insights into group behavior [10, 9]. Considering the widespread use of pilus-dependent surface motility an attempt to model this motility in Cyanobacteria may provide novel insights into an important biological phenomenon. In the past several decades, starting from the Keller-Segel model [11] there has been a lot of activity in the mathematical community in studying chemotaxis (i.e. bacteria that move in the direction of a chemical attractant), see e.g. [13, 16] and the references therein. At the same time, no mathematical models have been developed for describing the somewhat more mysterious motion of phototaxis. This paper is the first attempt in that direction. It is structured in the following way In Section 2.3 we introduce a mathematical model that is based on experimental observations. Following these observations we assume that the bacteria, while being able to move individually, do require an internal property, which we refer to as an excitation to reach a certain threshold in order for a motion to develop. This excitation accumulates as a result of a group-like influence. In addition, we assume that the bacteria are more likely to move on surfaces that were already traveled on by other bacteria, i.e., we take into account also an interaction between the bacteria and the medium on which they move. We proceed in Section 3 by deriving a multi-particle system approach to the first model considered in Section 2.3. The main result in this paper is the limit dynamics to the multi-particle system, given by the system of PDEs (20), which is discussed in the final part of Section 3. We conclude with several numerical simulations that demonstrate the properties of our models. Acknowledgments. The work of D. Bhaya was supported in part by the NSF under Grant 0110544. The work of D. Levy was supported in part by the NSF under Career Grant DMS-0133511. We would like to thank Matthew Burriesci for generating the images and movies.
2 The Framework 2.1 Observations The time-lapse video microscopy we used to track the movement of cells [5] has led us to the following observations regarding the characteristics of the motion:
Group Dynamics of Phototaxis
3
(1) Motion when the density is high. When the density of the cells is homogeneously high, all bacteria move as if they were forming a solid block (see Fig. 1). Worth noting is how bacteria don’t scatter around. Instead, we observe a somewhat well defined interface between the group of bacteria and the medium.
(a)
(b)
(c)
(d)
Fig. 1. Bacteria motion when the density is high. The snapshots were taken at increasing times, starting from (a) and ending at (d). The light comes from the left of the domain. (2) Fingering. When the density of cells is not homogeneous, we observe a faster movement in areas of higher bacteria density. This faster movement of bacteria towards light creates fingers as bacteria in lower density areas tend to remain still or move slower. This behavior is shown in Fig. 2. In this case, the light source is from the upper-right corner of the domain. (3) Pinching. Pinching is related to the fingering effect described above. Pinching develops when the density of cells is high enough to form a finger but as the finger is formed and bacteria move towards the light source, the density behind the leading tip decreases (if there are not enough bacteria present), and the tip eventually detaches. (4) Existence of an external substance. The movies suggest that when the cells move, they leave behind a trail. It is unclear what is the nature of the trail, e.g., they might segregate a substance that adheres to the medium. Our observations indicate that this substance either has an extremely slow decay or does not decay at all (with the time-frame of the movies, typically several hours). In either case it is clear that this is an important factor in the dynamics as cells that revisit locations that were already traveled by other bacteria are likely to follow a similar pattern of motion. This phenomenon is demonstrated in Fig. 4.
4
Devaki Bhaya, Doron Levy, and Tiago Requeijo
(a)
(b)
(c)
(d)
Fig. 2. Creation of fingers with a light source at the upper-right corner of the domain. Figure (a) shows the edge of the colony with single cells showing as dark dots. Figure (b) shows the initial phase of creating the fingers. Figures (c) and (d) taken several hours later show the bacteria moving toward the light source.
(a)
(b)
(c)
(d)
Fig. 3. Bacteria follow a similar pattern of motion on locations that were traveled by other bacteria. Shown are snapshots taken at consecutive times starting from (a) and ending at (d).
Group Dynamics of Phototaxis
5
2.2 Interpretation and Assumptions As mentioned in item (4) above, we assume bacteria leave some substance behind. The evolution from the second to third pictures in Fig. 4 suggests that, when in contact with a surface that was previously occupied, bacteria seem more predisposed to moving. Also, from the same sequence, it seems the substance left behind diffuses slowly or doesn’t diffuse at all (if there was a considerably amount of diffusion the interfaces would not be so well defined). Observing Fig. 2 leads us to believe there exists some sort of communication between bacteria since those tend to aggregate and move faster or slower depending on the number of bacteria around themselves. Assuming this mechanism is present, then the pinching phenomenon is nothing more than an effect of such mechanism; as mentioned before, if the density is high enough to make a group of bacteria move faster, but the density drops considerably when that group starts moving, then we expect that the initial group will detach from its neighbors. The mechanism proposed to describe such communication among bacteria consists on the existence of some excitation level associated to each bacterium (this will be called excitation). In chemotaxis, bacteria segregate a substance that diffuses on the medium and serves as a communication mechanism; bacteria flow towards higher concentrations of this substance which, in turn, decays over time. In our case this is not a desirable mechanism; it would mean that moving particles would leave yet another substance behind, so all the excitation would be passed to bacteria immediately behind and we would always observe aggregation instead of a detachment in low densities (which is what we observe in experiments). We also assume that bacteria can sense how excited to moving the neighboring bacteria are. This leads to propagation in high densities, if the excitation of a particular bacterium is high, it will cause an immediate increase in the excitation of its neighbors. Another difference with chemotaxis resides on the behavior of the external substance. With chemotaxis, the external substance does not only decays and diffuses over time, but is also consumed by bacteria. In our phototaxis system, the external substance is assumed to be persistent, i.e., there is no consumption, decay or diffusion. Thus, this substance functions as a memory effect; its existence or not at a specific point in space and time t signals if any bacterium was present at that point, at previous times s ≤ t.
2.3 The Mathematical Framework To derive a model that is based on the observations and assertions above, we need to specify three different stochastic processes. The first two concern the position of each bacterium and its excitation at a specific moment in time, while the third process is related to the extra substance at a specific point (on the medium) and time. To that end, let N denote the number of bacteria present in a free boundary medium (assume the medium is R2 ) and denote by Xi (t) ∈ R2 the position of bacterium i at time t ≥ 0. From the assumptions above, it is natural to assume that the process L, describing the external substance, is a pure jump process given by L(t; x, y) = max δ(x,y) (Xi (t)), 0≤s≤t i=1,...,N
(1)
6
Devaki Bhaya, Doron Levy, and Tiago Requeijo
where δ(x,y) is the Dirac delta function in R2 . Remark 1. It would be more realistic to assume the external substance is produced in a continuous manner, rather than by a pure jump process. However, in the setting of the multi-particle system discussed in Section 3, this difference does not play an important role. Also, according to our assumptions, the quantity of such a substance should quickly increase when it is in contact with bacteria (up to a certain level). Hence, even from practical considerations, when simulating the model, the best way to discretize this process is according to (1). Denote the excitation process for particle i by Si and let µi (t) be some weighted average of the total excitation around particle i at time t. This means µi is a quantity that describes how excited bacteria around bacterium i are. We will assume that Si (t) is given by a mean-reverting process, dSi (t) = (µi (t) − Si (t))dt + σdWi (t) Si (t)
(2)
where σ is a quantity inherent to the this kind of bacteria (hence constant) and Wi , i = 1, . . . , N are independent Brownian motions. With µi (t) and Si (t) defined this way we know that Si (t) > 0 for all t ≥ 0 and also that Si (t) tends to move towards the mean reverting level µi (t). Hence, controlling µi (t) will implicitly control Si (t) (in particular, since µi is bounded then the same will hold for Si almost surely). To define the position processes Xi (t), we assume the light source is always present, that it is of uniform intensity, and that it is located to the left of the bacteria. Together with bacteria sensitivity to the extra substance, this can be encoded into 2 a C ∞ function g : R+ 0 × R → [0, 1] satisfying 1) g is strictly increasing (in both variables) 2) lims→∞ g(s, w) = 1 3) g(0, ·) = 0. We can thus define n “ ” o dXi (t) = −vs g (Si (t) − K)+ , ∇LN (t; x, y) , 0 dt ˜ i (t) +vg ∇ρN (t; x, y)dt + vr dW
(3)
˜ i (t) are independent 2-dimensional Brownian motions and vs , vg , vr are the where W maximum velocity components for 1) excitation and sensitivity to external subN stance, 2) the density gradient, and 3) the random phenomena. P For each N > 0, L N 1 and ρ are the stochastic process obtained from L and N i δXi by a convolution with a mollifier. This model thus accounts for sensitivity to the extra substance, sensitivity to light, natural group dynamics (not coming from reaction to light), and random phenomena. Remark 2. As mentioned above, we assume the light source is always present, and bacteria sense it coming from the left. These assumptions can be easily dropped by ˘ ` ´ ¯ - substituting the quantity g (Si (t) − K)+ , ∇LN (t; x, y) , 0 , appearing in dXi (t), ` ´ by g (Si (t) − K)+ , ∇LN (t; x, y) ξt , where ξt is the unit vector representing the direction from which bacteria sense the light at time t;
Group Dynamics of Phototaxis -
7
changing the processes Si (t) by either making them decay fast when the light source is not present or even by making them jump to values below the threshold K at the moment the light source vanishes.
Remark 3. A major difference of this work compared with the work of Stevens [16], resides in the existence of a the excitation quantity, which is an internal property of each bacteria. Equation (2) has the desired effect that an individual’s excitation will evolve towards a surrounding neighborhood trend (given by µi (t)).
3 Many-particle system Based on the model introduced in Section 2.3, we now introduce a new particle system resembling the models in [16] and [14]. In particular, we consider an initial population of approximately N particles that can move in R2 , die, or give birth to new particles. As the initial population size N tends to infinity, we rescale the interaction between individuals in a moderate way. This means that the instantaneous change on a particular particle depends on the configuration of the remaining particles in a neighborhood, which is macroscopically small and microscopically large. That is, the volume tends to 0 as N → ∞ and it contains an arbitrarily large number of individuals as N → ∞. For N ∈ N we consider a population in R2 consisting of approximately N particles, which is divided into three subpopulations: bacteria, excitation and external substance. From now on, the indexes u, v and l will refer respectively to each of these subpopulations and we will refer to those subpopulations as type u, v or l. Denote by M (N, r, t), where r = u, v, l, the setSof all individuals belonging at time t to population type r. Also, let M (N, t) = r=u,v,l M (N, r, t) be the set of all individuals alive at time t. k For k ∈ M (N, t), let PN (t) ∈ R2 denote the position of particle k at time t, and consider the measure valued processes X 1 t → SN,r (t) = δP k (t) (4) N N k∈M (N,r,t)
where r = u, v, l and δx denotes the Dirac measure at x ∈ R2 . Following Section 2.3, excitation particles should be associated with a particular bacterium, hence we have to be careful numbering the set M (N, v, t). To that end, define Mw (N, v, t) ⊂ M (N, v, t) as the set of excitation particles associated with bacterium w ∈ M (N, u, t). For w ∈ M (N, u, t) define the measure valued process X t → SN,v,w (t) = δP k (t). (5) N
k∈Mw (N,v,t)
Note P that since {Mw (N, v, t)}w∈M (N,u,t) is a partition of M (N, v, t), then SN,v (t) = 1 w∈M (N,u,t) SN,v,w (t). N
3.1 Densities We introduce now smoothed versions of the empirical processes above. For a fixed symmetric and sufficiently smooth function W1 , let
8
Devaki Bhaya, Doron Levy, and Tiago Requeijo d WN (x) = αN W1 (αN x),
d ˆ N (x) = α W ˆN W1 (α ˆ N x),
ˆ where αN = N α/d and α ˆ N = N α/d for fixed scaling exponents α and α. ˆ Conditions for α and α ˆ are given in [16]. Define for r = u, v, l
sN,r (t, x) = (SN,r (t) ∗ WN ∗ WN )(x) ˆ N )(x) sˆN,r (t, x) = (SN,r (t) ∗ WN ∗ W
(6)
and, for v ∈ Mw (N, v, t), sN,v,w (t, x) = (SN,v,w (t) ∗ WN ∗ WN )(x) ˆ N )(x) sˆN,v,w (t, x) = (SN,v,w (t) ∗ WN ∗ W
(7)
These functions formally represent the density or concentration of each subpopulation type near x at time t. We introduce two density versions of each type (s and sˆ) for technical reasons. A more detailed discussion and technical details can be found in [14].
3.2 Dynamics In our model we assume that particles not only move in R2 , but also cause discontinuous changes to the population; they can die or give birth to new particles. We first describe how existing particles move. For t ≥ 0 and k ∈ M (N, u, t) let “ ” k k k dPN (t) =g sˆN,v,k (t, PN (t)), ∇sN,l (t, PN (t)) dt “ ” k + g˜ ∇sN,u (t, PN (t)) dt + µdW k (t) (8) “ ” “ ” k k k =gN (t) dt + µdW k (t), t, PN (t) dt + g˜N t, PN k where gN (t, x) = g (ˆ sN,v,k (t, x), ∇sN,l (t, x)) and g˜N (t, x) = g˜ (∇sN,u (t, x)). For k ∈ Mw (N, v, t) ⊂ M (N, v, t) we impose k w dPN (t) = dPN (t).
Finally, for k ∈ M (N, l, t),
k dPN (t) = 0.
(9) (10)
Note that this is consistent with Section 2.3; any excitation particle moves together with a specific bacterium and extra substance particles do not move at all. k We assume that any individual k ∈ M (N, u, t) at position dPN (t) = y may induce discontinuous changes in the v and l subpopulations; namely -
give birth to type l particles, with intensity λN (t, y), give birth to type v particles, with intensity βN,k (t, y),
k and that any individual k ∈ M (N, v, t) at position dPN (t) = y may cause the death of type v particles, with intensity γN,k (t, y). We also assume that these intensities depend on the densities of the N -particle system,
Group Dynamics of Phototaxis
9
βN,k (t, x) = β(ˆ sN,v (t, x), sˆN,v,k (t, x)) γN,k (t, x) = γ(ˆ sN,v (t, x), sˆN,v,w (t, x))
(11)
λN (t, x) = λ(ˆ sN,u (t, x), sˆN,l (t, x)) To describe this behavior, we introduce the processes « „Z t k k βN (t) = Qβ,k 1 (k)β (τ, P (τ ))dτ N,k M (N,u,τ ) N N 0 « „Z t k k γN (t) = Qγ,k 1 (k)γ (τ, P (τ ))dτ N,k M (N,v,τ ) N N 0 „Z t « k λ,k k λN (t) = QN 1M (N,l,τ ) (k)λN (τ, PN (τ ))dτ
(12)
0
·
where QN are independent standard Poisson processes. Thus the point processes k k k k βN (t), γN (t), λkN (t) have intensities 1M (N,u,τ ) (k)βN,k (t, PN (t)), 1M (N,u,t) (k)γN,k (t, PN (t)), k 1M (N,u,t) (k)λN (t, PN (t)) for a jump of size 1 at time t.
3.3 The Limit Dynamics R Let hµ, f i = R2 f (x)µ(dx) for any measure µ and real-valued function f in R2 . Using Itˆ o’s formula, we obtain for f ∈ Cb1,2 (R+ × R2 ) and k ∈ M (N, u, t), “ ” “ ” Z t “ ” k k k f t, PN (t) =f 0, PN (0) + µ∇f τ, PN (τ ) · dW k (t) 0 Z th ”“ ” “ ” “ k k k (13) + τ, PN (τ ) ∇f τ, PN (τ ) · gN + g˜N 0 “ ” “ ”i k k + ∂τ f τ, PN (τ ) + µ∆f τ, PN (τ ) dτ and, since there is no birth or death of type u particles,
hSN,u (t), f (t, ·)i = hSN,u (0), f (0, ·)i Z t “ ” X 1 k + µ∇f τ, PN (τ ) · dW k (t) N 0 k∈M (N,u,τ ) Z t ”“ ” h “ ” “ X 1 k k k τ, PN (τ ) ∇f τ, PN (τ ) · gN + g˜N + N 0 k∈M (N,u,τ ) “ ” “ ”i k k + ∂τ f τ, PN (τ ) + µ∆f τ, PN (τ ) dτ
(14)
For k ∈ M (N, v, t), we have to take into account birth and decay of particles. We k w also have dPN (t) = dPN (t) for k ∈ Mw (N, v, t), thus “ ” X 1 k hSN,v (t), f (t, ·)i = f t, PN (t) N k∈M (N,v,t) “ ” X 1 k Nk (t)f t, PN (t) + birth/decay terms = N k∈M (N,u,t)
10
Devaki Bhaya, Doron Levy, and Tiago Requeijo
k (t)) for k ∈ Mw (N, v, t). Hence, where Nk (t) = |Mw (N, v, t)| = SN,v,w (t)(PN
hSN,v (t), f (t, ·)i = hSN,v (0), f (0, ·)i Z t “ ” X 1 k Nk (τ )µ∇f τ, PN (τ ) · dW k (t) + N 0 k∈M (N,u,τ ) Z t ”“ ” h “ ” “ X 1 k k k τ, PN (τ ) Nk (τ ) ∇f τ, PN (τ ) · gN + g˜N + N 0 k∈M (N,u,τ ) “ ” “ ”i k k + ∂τ f τ, PN (τ ) + µ∆f τ, PN (τ ) dτ Z t “ ” X 1 k k + f τ, PN (τ ) βN (dτ ) N 0 k∈M (N,u,τ ) Z t “ ” X 1 k k − f τ, PN (τ ) γN (dτ ) N 0
(15)
k∈M (N,v,τ )
Finally, dPkN (t) = 0 for type l individuals leads to Z t “ ” X 1 k hSN,l (t), f (t, ·)i = ∂τ f τ, PN (τ ) dτ N 0 k∈M (N,l,τ ) Z t “ ” X 1 k + f τ, PN (τ ) λkN (dτ ) N 0
(16)
k∈M (N,u,τ )
We introduce the processes Z t “ ” X 1 k µ∇f τ, PN (τ ) · dW k (t) MuN (t, f ) = N 0 k∈M (N,u,t) Z t “ ” X 1 k µ∇f τ, PN (τ ) · dW k (t) MvN (t, f ) = N 0 k∈M (N,v,t) Z t “ ”“ “ ” ” X 1 N k k k Mv,γ (t, f ) = f τ, PN (τ ) γN (dτ ) − γN,k τ, PN (τ ) dτ (17) N 0 k∈M (N,u,τ ) Z t “ ” ” “ ”“ X 1 N k k k Mv,β (t, f ) = (τ ) dτ f τ, PN (τ ) βN (dτ ) − βN,k τ, PN N 0 k∈M (N,v,τ ) Z t “ ” ” “ ”“ X 1 k k N (τ ) dτ f τ, PN (τ ) λkN (dτ ) − λN τ, PN Ml (t, f ) = N 0 k∈M (N,u,τ )
These processes are with respect to the natural filtration generated by ` martingales ´ k (t), 1M (N,r,t) (k) 1kN (t) where 1kN (t) is the indicator function the processes t → PN of the lifetime of individual k. We assume the quadratic variation of each of the martingales above tends to 0 as N → ∞, hence we can neglect them when passing to the limit dynamics. From Section 3.1, we see that in the sense of distributions ˆ N = δ0 . lim WN = lim W
N →∞
N →∞
Group Dynamics of Phototaxis
11
We assume for r = u, v, l and t ≥ 0 (see [16]), lim SN,r (t) = Sr (t),
N →∞
where the measure Sr (t) have smooth density r(t, ·). It follows that lim sN,r (t, ·) = lim sˆN,r (t, ·) = r(t, ·),
N →∞
N →∞
lim ∇sN,r (t, ·) = lim ∇ˆ sN,r (t, ·) = ∇r(t, ·).
N →∞
N →∞
Let u0 (·), v0 (·) and l0 (·) be the densities of Su (0), Sv (0) and Sl (0). Define g˜∞ (τ, x) = g˜(∇u(τ, x)) and λ∞ (τ, x) = λ(u(τ, x), l(τ, x)). In order to define g∞ , β∞ and γ∞ , first w w ˜ note that as N → ∞, we assume |Mw (N, v, t)| ≃ |Mw˜ (N, v, t)| when PN (t) = PN (t). Thus, as N → ∞, SN,v,w (t) should be approximated by the number of excitation w w particles at PN (t) divided by the number of bacteria particles at PN (t), i.e. P w w w k (PN ) SN,v (t)(PN ) N SN,v (t)(PN ) k∈Sv (N,t) δPN w SN,v,w (t)(PN )≃ P w = w w = N S (t)(P S (t)(P ) δ (P ) k N,u N,u N N) N k∈Su (N,t) P N
v(t,x) . Since SN,r are sums of a finite number of delta functions, lim sˆN,v,x (t) = u(t,x) . ” “ ” “ v(τ,·) v(τ,·) Hence g∞ (τ, ·) = g u(τ,·) , ∇l(τ, ·) , γ∞ (τ, ·) = γ v(τ, ·), u(τ,·) and β∞ (τ, ·) = “ ” v(τ,·) β v(τ, ·), u(τ,·) . We can now take the limit and obtain
hu(t, ·), f (t, ·)i = hu0 (·), f (0, ·)i Z t ˙ ¸ + u(t, ·), ∇f (τ, ·) · (g∞ + g˜∞ ) (τ, ·) + ∂τ f (τ, ·) + µ∆f (τ, ·) dτ 0
hv(t, ·), f (t, ·)i = hv0 (·), f (0, ·)i Z t ˙ ¸ + v(t, ·), ∇f (τ, ·) · (g∞ + g˜∞ ) (τ, ·) + ∂τ f (τ, ·) + µ∆f (τ, ·) dτ 0 Z t Z t + hu(t, ·), β∞ (τ, ·)f (τ, ·)i dτ − hv(t, ·), γ∞ (τ, ·)f (τ, ·)idτ 0
(18)
0
hl(t, ·), f (t, ·)i = hl0 (·), f (0, ·)i Z t Z + hu(t, ·), λ∞ (τ, ·)f (τ, ·)i dτ + 0
t
hl(t, ·), ∂τ f (τ, ·)i dτ 0
Integrating (18) by parts we obtain the system corresponding to “` ´ ” ∂t u =µ∆u + ∇ · g(v/u, ∇l) + g˜(∇u) u “` ´ ” ∂t v =µ∆v + ∇ · g(v/u, ∇l) + g˜(∇u) v + β(v, v/u)u − γ(v, v/u)v
(19)
∂t l =λ(u, l)u
The system (19) can be simplified by rewriting it as ` ´ ∂t u =µ∆u + ∇ · g(u, v, ∇u, ∇l)u ` ´ ∂t v =µ∆v + ∇ · g(u, v, ∇u, ∇l)v + β(u, v)u − γ(u, v)v ∂t l =λ(u, l)u
where the new function g captures the effect of both g and g˜ in (19).
(20)
12
Devaki Bhaya, Doron Levy, and Tiago Requeijo
Remark 4. The structure of the system (20) is not surprising, when we take into account the discussion in Section 2.3. In fact, from (3) we expect the rate of change on bacteria density u to be given by a diffusion part (coming from the Brownian motion term) plus a term representing sensitivity to light and external substance. Similarly, the excitation density v, can be expected to follow the same pattern as u with the addition of birth and decay terms. Remark 5. The phototaxis system (20) is similar to the chemotaxis system ` ´ ∂t u =µ∆u − ∇ · χ(u, v)u∇v ∂t v =η∆v + β(u, v)u − γ(u, v)v
(21)
where u is the bacteria density and v the density of chemoattractant (which is an external substance). Using the analogy to our problem, we can easily deduce how the phototaxis system would look, if we were to assume that the external substance can also diffuse and decay. In that case the last equation in (20) should be replaced by ∂t l = ηλ ∆l + λ(u, l)u − γλ (u, l)l. Remark 6. Our work is based on the assumption that, as N → ∞, |Mw (N, v, t)| ≃ w w ˜ |Mw˜ (N, v, t)| if PN (t) = PN (t). That is, as N → ∞, our model looks like a reactiondiffusion system, which allows us to use the methods discussed in [16] and [14]. As mentioned above, when rescaling the interaction in a moderate way, we are looking at neighborhoods that are microscopically large. Hence, as N → ∞, we expect to have an arbitrarily large number of individuals in such neighborhoods. From (2) and the definition of µi (t) in Section 2.3, this means that as N → ∞ the excitation of particle i should quickly converge to µi , a weighted average of all the excitations of particles in the interacting neighborhood. This behavior is assumed in our derivation of the limit dynamics.
4 Simulation We used the model described in Section 2.3 to simulate the behavior of this bacteria population. The simulation consists of building a cellular automaton by discretizing (2) and (3) for small time increments. The functions and parameters that were used in our simulations are: ∆t = 0.1, σ = 0.3, K = 0.1, vs"= 3.0, vg = 0.1 and vr = 0.05, # «+ „ N ` ´ d(X(j), X(i)) 1 X g(s, w) = 1 − exp(s) w · {−1, 0}, and µi (t) = S(j) 1− N j=1 r where r = 2. In Figure 4 we show snapshots at different times of a bacteria motion in the direction of a light source that is located to the left of the domain. Bacteria surrounded by a higher number of individuals tend to move faster. Darker colors correspond to higher bacteria density.
References 1. J.P. Armitage. Bacterial tactic responses. Adv Microb Physiol., 41:229–89, 1999.
Group Dynamics of Phototaxis
13
Fig. 4. A simulation of a bacteria motion towards the light source, on the left. Bacteria surrounded by a higher number of individuals tend to move faster. Darker colors correspond to higher bacteria density. 2. D. Bhaya. Light matters: Phototaxis and signal transduction in unicellular cyanobacteria. Mol. Microbiol., 53:745–754, 2004. 3. D. Bhaya, N. R. Bianco, D. Bryant, and A. R. Grossman. Type IV pilus biogenesis and motility in the cyanobacterium Synechocystis sp. PCC6803. Mol. Microbiol., 37:941–951, 2000. 4. D. Bhaya, A. Takahashi, and A. R. Grossman. Light regulation of TypeIV pilusdependent motility by chemosensor-like elements in Synechocystis PCC 6803. Proc. Natl. Acad. Sci. U.S.A., 98:7540–7545, 2001. 5. M. Burriesci and D. Bhaya. Tracking the motility of single cells and groups of synechocystis sp. strain pcc6803 during phototaxis. in preparation, 2006. 6. L.L. Burrows. Weapons of mass retraction. Mol Microbiol., 57(4):878–88, Aug 2005. 7. W. Chiu, M.L. Baker, and S.C. Almo. Structural biology of cellular machines. Trends Cell Biol., 16(3):144–50, Mar 2006. 8. B. Davis. Reinforced random walks. Probability Theory Related Fields, 84(1):203–229, 1990. 9. A. Gallegos, B. Mazzag, and A. Mogilner. Two continuum models for the spreading of myxobacteria swarms. Bull Math Biol., 68(4):837–61, May 2006. 10. O.A. Igoshin, A. Goldbeter, D. Kaiser, and G. Oster. A biochemical oscillator explains several aspects of myxococcus xanthus behavior during development. Proc Natl Acad Sci U S A., 101(44):15760–5, Nov 2 2004. 11. E.F. Keller and L.A. Segel. Traveling band of chemotactic bacteria: a theoretical analysis. J. Theor Biol., 30:235–48, 1971. 12. L.L. McCarter. Regulation of flagella. Curr Opin Microbiol., 9(2):180–6, Apr 2006. 13. J.D. Murray. Mathematical Biology. Springer, Berlin Heidelberg New York, third edition, 2003. 14. K. Oelschl¨ ager. On the derivation of reaction-diffusion equations as limit dynamics of systems of moderately interacting stochastic many-particle processes. Probability Theory Related Fields, 82(1):565–586, 1989. 15. B. Øksendal. Stochastic Differential Equations. Springer, fifth edition, 2002. 16. A. Stevens. The derivation of chemotaxis equations as limit dynamics of moderately interacting stochastic many-particle systems. SIAM Journal of Applied Mathematics, 61(1):183–212, 2000. 17. A. Stevens. A stochastic cellular automaton modeling gliding and aggregation of myxobacteria. SIAM Journal of Applied Mathematics, 61(1):172–182, 2000.