Although they can be chosen at will, EspaËnol and Warren showed8 that ÏD and ..... the shape of the weight function - the characteristic force felt by each particle ..... 15 R. Evans, in Fundamentals of Inhomogeneous Fluids, D. Henderson ed., ...
Dissipative particle dynamics for interacting systems I. Pagonabarraga(*) and D. Frenkel
arXiv:cond-mat/0105075v1 [cond-mat.soft] 3 May 2001
FOM-Institute for Atomic and Molecular Physics (AMOLF), Kruislaan 407, 1098 SJ Amsterdam (The Netherlands) Current address: Departament de F´ısica Fonamental, Universitat de Barcelona, Av. Diagonal 647, 08028-Barcelona, Spain We introduce a dissipative particle dynamics scheme for the dynamics of non-ideal fluids. Given a free-energy density that determines the thermodynamics of the system, we derive consistent conservative forces. The use of these effective, density dependent forces reduces the local structure as compared to previously proposed models. This is an important feature in mesoscopic modeling, since it ensures a realistic length and time scale separation in coarse-grained models. We consider in detail the behavior of a van der Waals fluid and a binary mixture with a miscibility gap. We discuss the physical implications of having a single length scale characterizing the interaction range, in particular for the interfacial properties.
I.
INTRODUCTION
There is a strong incentive to develop “mesoscopic” numerical techniques to model the dynamics of fluids with different characteristic length scales. Mesoscopic simulations make it possible to analyze processes that take place on length and time scales that are out of reach for purely atomistic simulations such as Molecular Dynamics (MD). In MD, one retains the full atomic details in the description of the system, but at the expense of restricting the studies to short times. In contrast, models that describe the system at mesoscopic scales, employ a certain degree of coarse graining, which allows one to analyze longer times. However, care should be taken that the loss of “atomic” information associated with the coarse-graining process does not lead to unrealistic features on larger length and time scales. In particular, the coarse-grained models should provide an adequate description of the equilibrium properties of the system. Some of the mesoscopic models that have been proposed previously in the literature were derived in a systematic way from underlying microscopic models, as is the case with the lattice-Boltzmann method1 , which can be viewed as a preaveraged lattice gas model2 . Coming from the opposite side, smoothed particle dynamics was introduced as a Lagrangian discretization of the macroscopic equations of fluid motion3 . A different strategy to simulate structured fluids is to assume that the solvent is passive, and that the suspended objects have a diffusive dynamics with diffusion coefficients that are known a priori. This has led to the development of Brownian4 and Stokesian dynamics5 . In the early nineties, Dissipative Particle Dynamics (DPD) was introduced as a novel way to simulate fluids at a mesoscopic scale6 . In DPD, the fluid is represented by a large number (N ) of point particles that have a pairwise additive interaction. The interparticle forces are the sum of three contributions. In addition to the usual conservative forces that can be derived from a Hamiltonian, DPD includes dissipative and random forces. These mimic the effect of viscous damping between fluid elements and the thermal noise of the fluid elements, respectively. Flekkøy and Coveney7 have shown that, in principle, a particular DPD-like model can be derived from an atomistic description. However, no such derivations exist for the commonly used DPD models. Nonetheless, even without such a link to the underlying microscopics, it has been shown that thermal equilibrium can be ensured by an appropriate choice of the ratio between dissipative and random forces8 . The hydrodynamic behavior of the DPD model has been explored in some detail9,10,11,12 , although the link between the mesoscopic and the macroscopic description is not completely understood. In conventional DPD, all interparticle forces have the same finite interaction range rc . Their amplitudes decay according to a weight function w(rij ) that has been made to vanish at rc in order to avoid spurious jumps at the cut-off distance. In this paper we employ a more general description of the conservative interactions. In the existing literature, the conservative forces have usually been assumed to depend explicitly on the distance between a pair of particles. For the sake of computational convenience, the conservative forces between DPD particles are taken smooth and monotonic functions of the distance - in fact, the smoothness of the forces is one of the advantages of DPD. When the forces depend linearly on the interparticle separation, the equation of state (EOS) of the DPD fluid is approximately quadratic in the density and exhibits no fluid-fluid phase transition. Even though the forces between DPD particles are smooth, they still induce structure in the fluid (reminiscent of atomic behavior) on a length scale of order rc . In this respect, the conventional DPD scheme is similar to other mesoscopic models for non-ideal fluids but differs from the - computationally more demanding - scheme of Flekkøy and Coveney that was mentioned above7 . Our aim in this paper is to arrive at a formulation of DPD that allows for a description of the behavior of non-ideal fluids and fluid-mixtures. To this end, we look for a model in which there is a direct link between the macroscopic
2 equation of state and the effective interparticle forces. As we will show, as an additional advantage, our approach results in rather weak structural correlations in the fluid. In the next section we describe in detail the model and how conservative forces are derived. We will subsequently elaborate the general method on three characteristic examples: a non-ideal fluid without a gas-liquid phase transition that has been studied previously with a different choice of conservative forces, a van der Waals fluid, and a mixture with a miscibility gap. In section III we look at the interfacial properties of these examples to gain some insight in the physical meaning of the conservative forces that we introduce, and subsequently analyze their equilibrium behavior and compare with previous models. We conclude with a discussion of our main results. II.
MODEL
In DPD one has N point particles of mass {mi } that interact through a sum of pairwise-additive conservative, dissipative and random forces. These particles can be interpreted as fluid elements, and the dissipative forces are introduced to mimic the viscous drag between them. The random force equilibrates the energy lost through friction between the particles, enabling the system to reach an equilibrium state. To be specific, if we call {rk , pk } the set of particle positions and momenta of the N point particles, their dynamics are controlled by Newton equations of motion drk = vk dt X� dpk = FC (rij ) + FD (rij ) + FR (rij ) dt j6=i X� = FC (rij ) − γω D (rij )vij · eij eij + σω R (rij )eij ξij
(1)
(2)
j6=i
where we have used the notation rij ≡ ri − rj and vij ≡ vi − vj . eij denotes a unit vector in the direction of rij , and vi = pi /mi is the velocity of particle i. The dissipative force, FD (rij ), depends both on the relative positions and velocities of the interacting pair of particles and its amplitude is characterized by the parameter γ. This parameter is related to the viscosity of the DPD fluid. The third term in eq.(2), FR (rij ), is a random force acting on each pair of DPD particles - ξ stands for a random variable with Gaussian distribution and unit variance. The random force has an amplitude σ and is also central. Central pair interactions ensure angular momentum conservation (although the dynamics can be generalized to account for non-central forces13 ). The dissipative and random forces are completely specified once the weight functions, ω D (rij ) and ω R (rij ), are specified- these are smooth and of finite range. Although they can be chosen at will, Espa˜ nol and Warren showed8 that ω D and ω R must be related to ensure that the probability to observe a particular configuration of DPD√particles is given by the Boltzmann distribution in equilibrium. Specifically, if they are chosen such that ω R = ω D , then the correct equilibrium distribution is recovered, and the equilibrium temperature of the DPD fluid is fixed by the ratio of the amplitudes of the dissipative and random forces, kB T = σ 2 /(2γ). We stress that the DPD equations of motion, eq.(1-2), cannot be derived from a Hamiltonian. Traditionally, and for simplicity, the conservative forces in DPD have been taken as pairwise-additive and central, with a weight function related to ω D , and with a variable amplitude that sets the temperature scale in the system. As long as the force is sufficiently weak that it does not induce appreciable inhomogeneities in the density around a DPD particle, it can only lead to an equation of state with a quadratic dependence in the density, irrespective of the precise choice for the weight function (see below). One consequence is that phase separation between disordered phases cannot occur in a pure system; at least a binary mixture of different kinds of particles is needed14 . We will first consider the general form that the free energy of a DPD system can have, in order to elucidate the generic shape of consistent conservative forces. In agreement with the idea that the DPD particles refer to lumps of fluid, it seems natural to assume that the relevant energy associated to their configurations is a free energy, rather than a strictly “mechanical” potential energy. We can express quite generically the free energy F of an inhomogeneous system with density ρ(r) as F=
Z
drρ(r)f (n(r))
(3)
where f (ρ) is the expression for the local free energy per particle (in units of kB T ), and n({r}) is related to the density of the system at r. This formulation is reminiscent of the strategy followed in density functional theory to study the
3 equilibrium properties of the fluids15 . In fact, the particular case n({r}) = ρ({r}) corresponds to the local density approximation in density functional theory, and if n(r) is chosen to be an average of the density over an interval around r, it can be understood as a weighted density approximation for the true free energy. We can separate the total free energy, f (ρ) = f id (ρ) + f ex (ρ), as the sum of the ideal f id (ρ) = log(Λ3 ρ) − 1 plus the excess contribution, where Λ is the thermal de-Broglie wavelength. Our purpose is to obtain the equivalent expression for a DPD system, in which we have N particles distributed in the space. Since the free energy is an extensive quantity, the total free energy of a DPD system can be obviously expressed in terms of the free energy per DPD particle, ψ, as
F=
N X
ψ(ni ) =
N Z X i=1
i=1
drδ(r − ri )ψ(n(r)) =
Z
drρ(r)ψ(n(r)))
(4)
where we have introduced the symbol ni to refer to the generalized density defined above, although now expressed in terms of the positions of the discrete N DPD particles (see below). Comparing eqs.(4) and (3), we can easily identify ψ(ρ) = f (ρ) which obviously implies that we can decompose ψ into its ideal and excess contributions. If the free energy determines the relevant energy for a given configuration of DPD particles, we can then derive the force acting on each particle as the variation of such an energy when the corresponding particle is displaced. However, the motion of the particles themselves, due to the action of the dissipative and random forces, already accounts for the ideal contribution to the free energy of the system, which is not related to the interactions among the particles. Therefore, only the excess part of the free energy will be involved in the effective interactions between the DPD particles. Accordingly, we can write the conservative force acting on particle i, FC i , as
Fi = −
N ∂ X ex ψ (nj ) ∂ri j=1
(5)
We have derived the generic form for the conservative force acting on a DPD particle as a function of the excess free energy that characterizes the system, which is in general not pair-wise additive. These forces are analogous to the ones derived from semi-empirical potentials16 in MD, used to model effectively the many-body interactions in condensed systems. However, we have started from the macroscopic properties of the system, i.e. its free energy, rather than ensuring microscopic consistency. We can then fix the equilibrium thermodynamic properties of the system beforehand, and derive a set of conservative forces consistent with the desired equilibrium macroscopic behavior. This procedure is reminiscent of an approach used in other mesoscopic simulation techniques that deal with generic non-ideal fluids17 . Given that the free energy has been defined as a functional of a certain local density, local variation in such a density are responsible for the effective forces among the DPD particles. The particular expression for the forces will then depend both on the specific form of the free energy and on the choice of the local density ni . It seems natural to define the local density of a particle i as its average on the corresponding interaction range. For simplicity, we weight this average with the same functions used to define the dissipative and random forces, as introduced in eq.(2). Therefore, we write ni =
1 X w(rij ) [w] j
(6)
where [A] refers to the spatial integral of a given quantity A. The normalization factor [w] ensures that ni is indeed a density, so that in a homogeneous region, n = ρ. This is in spirit similar to the weighted density approximation in density functional theory15 . The use of a continuous and smooth weight function that vanishes at the cut-off distance, rc , ensures a smooth sampling of the environment of each particle, avoiding spurious jumps. There is no a priori reason to choose w(r) equal to any of the other weight functions, although the particular case of a constant weight function constitutes a pathological limit - in this case the conservative force will only act when one particle enters or leaves the interaction range. The dependence of the energy of a particular configuration on the particles’ positions enters implicitly through the weighted densities. For densities of the form given by eq.(6), the conservative force acting on particle i can be rewritten as
Fi = −
N X ∂ψ(nj ) j=1
∂ri
=−
′ X X wij (ψi′ + ψj′ ) Fij eij ≡ [w] j j
(7)
4 where we have introduced the notation, ψi ≡ ψ ex (ni ), and where the primes denote derivatives with respect to the corresponding variables. Although the free energy of each particle depends on the local density, and leads in general to many-body effective forces, for the particular local density introduced in eq.(6), the forces between DPD particles can still be written down as additive pairwise forces- a computational advantage. The fact that the forces depend on the positions of many particles through their corresponding local weighted densities suggests that in general the local structure of the fluid phase will be smoother than in the case in which forces are derived from a pair-potential. This is an attractive feature of the present model; the local structure in a fluid should only be related to its microscopic structure, and should be smeared out at mesoscopic, coarse-grained, scales. In this respect, the density-dependent interactions of these DPD models enforce an appropriate length scale separation. In the next sections we will analyze these properties in detail. Before considering specific examples, as a consistency check, we will analyze the predictions for the pressure of a fluid following the free energy, pth , and the virial, pv , routes. If we start from the free energy per particle, eq.(4), the pressure for a fluid will be pth = −f + ρ
∂f ∂ψ ex = kB T ρ + ρ2 ∂ρ ∂ρ
(8)
On the other hand, since we have derived the force between particles from the free energy, we can also obtain the pressure of the fluid following the virial route. In this case the pressure is given pvirial = ρkB T +
Z Z 1 1 XX rij · Fij = ρkB T + drdr′ ρ(r, r′ )(r − r′ ) · F(r − r′ ) 2dV i j 2dV
(9)
where we have approximated the discrete sum over the N DPD particles by an integral. Introducing the pair correlation function, g(r), we can rewrite the previous equation as � � Z ρ2 ρ2 ∂ψ ex [rw′ ] −2w′ (r)e ∂ψ ex virial p = kB T ρ + = kB T ρ − r· (10) drg(r) 2d ∂ρ [w] d ∂ρ [w] In the last equality we have assumed that the density is nearly homogeneous, and that therefore ∂ψ ex /∂ρ is effectively a constant. Otherwise, it is not possible to express the force in terms of the relative coordinates only. If there is no local structure in the fluid, and w(rc ) = 0, then [rw′ ] = −d[w], and then eq.(10) coincides with the prediction for the “thermodynamic” pressure, eq.(8) for any weight function18 . Otherwise, a discrepancy between the two pressures will appear because the averaged density ni is always centered on the corresponding DPD particle- a conditional densityand it is therefore related to the g(r). We will see in some examples in subsequent sections how such local structure may develop. Theoretical studies have shown that in the fluid phase of DPD, in the hydrodynamic limit the usual Navier-Stokes equation is recovered9, and that the equilibrium pressure term is related to the pairwise forces through the usual virial expression, as we have derived previously. This corresponds to dynamics which conserves momentum locally (as in model-H19 ), instead of being purely relaxational (as happens in certain dynamical models that start from density functional theories20 ). By analogy with the usual non-ideal DPD models, in equilibrium we recover a probability distribution for a given configuration in agreement with Boltzmann fluctuation theorem: the probability of observing a fluctuation is proportional to the exponential of the deviation of the appropriate thermodynamic potential- the free energy (as introduced in eq.3) for DPD models at constant volume, temperature and number of particles. In the following subsections we will consider three particular examples, where we will compute explicitly the form of the conservative forces. A.
Groot and Warren fluid
Let us first derive the expression for the conservative force that corresponds to the non-ideal fluid studied by Groot and Warren21 . They introduce a conservative force of the form
Fij =
(
� a 1−
rij rc
0
�
eij , rij < rc , rij > rc
(11)
5 For this conservative force, they have shown that the EOS is p = kB T ρ + αaρ2 , where by a numerical fit they found α = 0.101 ± 0.001. Using the expressions of the previous section, the corresponding pairwise force is ( ′ wij (12) Fij = 2αa [w] eij , rij < rc 0 , rij > rc It corresponds to an excess free energy per particle ψ ex = αaρ, which is linear in the density. As stated in the introduction, an interaction with a smooth, monotonic dependence in position does not induce a fluid-fluid phase separation. B.
van der Waals fluid
The van der Waals fluid is the classic example of a fluid with a liquid-gas phase transition. It is characterized by the equation of state p = ρkB T /(1 − bρ) − aρ2 (and excess free energy per particle, ψ ex = −kB T log(1 − bρ) − aρ). We can recover this EOS in a DPD system with pairwise conservative forces of the form,
Fij =
��
� � �� ′ wij kB T b kB T b −a + −a eij 1 − bni 1 − bnj [w]
(13)
For reasons that will be discussed below, it is helpful to generalize slightly the van der Waals fluid allowing for a contribution cubic in the density. The EOS then becomes p = ρkB T /(1 − bρ) − aρ2 − α3 abρ3 . The critical point of this model corresponds to the parameters Tc = ρc
a bρc (2 + 3α3 bρc )(1 − bρc )2 b q
2 2 1 α3 − 1 + 1 + 3 α3 + α3 = b 4α3
ρc b ≡ xc =
−1 + α3 +
q 1 + 23 α3 + α23
4α3 Tc b/a ≡ yc = xc (2 + 3α3 xc )(1 − xc )2
(14)
(15) (16)
The compressibility of the fluid, χ, in turn, can be written down as χ−1 =
yyc kB T b(2 − bρ) kB T − 2a − 3α3 abρ = − 2 − 3α3 xxc + 2 ρ (1 − bρ) xxc (1 − xxc )2
(17)
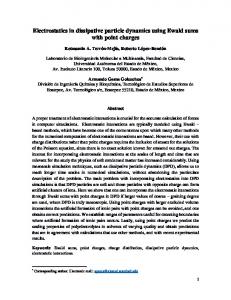
In fig.1 we show the behavior of the compressibility for two different values of the parameter α3 , for temperatures close to the critical temperature Tc . The increase in α3 reduces χ both above and below the critical temperature. As expected, χ becomes negative in a region below Tc that is bounded by a spinodal. Controlling the compressibility of the fluid is a desirable feature; a low compressibility helps reducing fluctuations of the fluid interface, which may be useful in simulations. It also provides a way of modifying properties of the fluid, such as the speed of sound. Moreover, it gives an additional parameter to select the surface tension which, as we will explain, may even change sign in this DPD-van der Waals fluid. Finally, it proves useful to reduce the amplitude of the density fluctuations to compare with mean field theoretical predictions, as the ones developed in the next section. C.
Binary mixture
A binary mixture composed of particles of two species14 , A and B, has also been considered by Groot and Warren21 . In this system, it is possible to induce demixing with usual pairwise forces by modifying the relative repulsions between the A − A, B − B and B − A pairs. Nevertheless, even in this case, a model in which the forces depend on local densities can be useful since if they induce less local structure, a relevant feature at a fluid-fluid interface.
6 If the system consists of NA particles of type A and NB particles of type B, then there are two relevant local density fields, nA and nB , that are the straightforward generalizations of eq.(6), X w(rij ) [w]
n Ai =
(18)
j∈A
X w(rij ) [w]
nBi =
(19)
j∈B
nAi and nBi represent the concentration of A and B particles around particle i, respectively. Whenever it is appropriate, we will denote by ρA and ρB the continuum limit of the discrete densities nA and nB , respectively. The simplest free energy that leads to a miscibility gap has an excess free energy of the form
F
ex
=
Z
2
�
2
dr 2λρa (r)ρb (r) + λA ρa (r) + λB ρB (r)
=
" X
(λnBi + λA nAi ) +
i∈A
X i∈B
(λnAi + λB nBi )
#
(20)
where the two sums run over particles of type A and B, respectively. The corresponding conservative force acting on particle i can be written down as ( ( ) ( )) X X X X X X ′ Fj = λ +λA + λ +λB [wik eik (δij − δkj )] (21) i∈A
k∈B
i∈B
k∈A
k∈A
k∈B
Although in this case with two averaged local densities the conservative forces do not have the form of eq.(7), they can still be expressed as pairwise additive forces, � ′ −2λA,B wij eij , i j same type Fij = (22) ′ −2λwij eij , i j different type This fluid will be miscible at high temperatures, and below a critical temperature Tc a miscibility gap will develop. In terms of the parameters of the free energy, eq.(20), for a symmetric mixture Tc is kB Tc = ρ(λ − λA ) III.
,
1 ρA |c ≡ cc = ρA + ρB 2
(23)
INTERFACIAL BEHAVIOR
In this section we develop a mean field theory for the interfacial properties for a non-ideal DPD fluid that gives some insight in the meaning of the conservative forces for these DPD models. For definiteness, we concentrate on the derivation of the surface tension, γ˜. Since we are interested in the interfacial properties, we focus on the excess free energy, and will not write down the ideal gas contribution, which is local in the density and does not contribute to the interfacial properties. We start from the continuum limit of the appropriate free energy, and make an expansion in gradients. Therefore, we disregard correlations in the positions between the particles, hence the mean field character of the predictions of the present section. A.
van der Waals fluid
For a van der Waals fluid we can express the continuum free energy of the fluid, that corresponds to the conservative forces introduced in eq.(13), as Z � � α3 (24) abn(r)2 F ex = drρ(r) −kB T log(1 − bn(r)) − an(r) − 2 where n(r) is the continuum limit of eq.(6), namely,
1 n(r) = [w]
Z
dr′ w(|r − r′ |)ρ(r′ )
(25)
7 In eq.(24), the density ρ(r) means the mean density at point r. This is different from the density appearing in section II, where it referred to the instantaneous value of the density for a particular configuration. Due to this density preaveraging, the results of the present section constitute a mean field approximation. For a smooth planar interface, we can expand the density in eq.(25) to second order in the gradients15, 1 ρ(r − z) = ρ(r) − z · ∇ρ(r) + zz : ∇∇ρ(r) 2
(26)
Inserting this expression in eq.(25), and using the fact that the weight function is radially symmetric we get n(r) = ρ(r) +
[z 2 w] 2 ∇ ρ(r) 2d[w]
With this expression, eq.(24) can be written down as � � � Z b[z 2 w] 2 ex F = drρ(r) −kB T ln 1 − bρ(r) − ∇ ρ(r) − aρ(r) 2d[w] � �� [z 2 w] α3 ab a[z 2 w] 2 2 2 ρ(r) + ∇ ρ(r) − ρ(r)∇ ρ(r) − 2d[w] 2 d[w]
(27)
(28)
where terms containing derivatives higher than second order have been neglected. Collecting terms in powers of the density gradients, making use of the integration by parts we can rewrite eq.(28) in the usual form � Z � � [z 2 w] � α3 kB T b ex 2 F = drρ(r) −kB T ln(1 − bρ(r)) − aρ(r) − − + a + 2α3 abρ(r) |∇ρ(r)|2 (29) abρ(r) + 2 2d[w] (1 − bρ(r))2 The first term in brackets gives the local contribution to the excess free energy. When the ideal contribution is added, it gives us the free energy for a homogeneous van der Waals fluid. The second term in brackets is the energy penalty to generate gradients in the system. It is this term that contains, to lowest order, the interfacial energy of the fluid. In particular, we can obtain from it an expression for the surface tension. If we assume that the profile is a hyperbolic tangent, and we estimate its width from the asymptotic bulk coexisting densities22 , we arrive at s � 2 � kB T b d f ρl − ρg [z 2 w] − + a + 2α3 abρm (30) γ˜ = 2 d[w] (1 − bρm )2 dρ2 2
where ddρf2 = 1/ρ − 2a + kB T (2 − bρ)/(1 − bρ)2 − 3α3 abρ is the second derivative of the homogeneous free energy with respect to the density evaluated at one of the coexisting phases. We have assumed for simplicity that the density difference between the two phases is small, so that we can approximate the density across the interface by its mean value, ρm If we look at the structure of both the expansion of the free energy and the surface tension, we can recognize a qualitative difference with respect to the corresponding expressions for the standard van der Waals fluid. In the latter, the interfacial tension is a function only of the parameter a characterizing the long range attraction between the particles, whereas now it depends on all the parameters, a, b and α3 . This qualitative difference can already be traced back to the coefficient of the gradient square term in free energy expansion, eq.(29) - for the standard van der Waals fluid the gradient energy cost is only related to a. As a result, in this DPD van der Waals fluid there are different contributions to the gradient energy term with different signs. Therefore, depending on their relative strength, it is possible either to favor or penalize the appearance of density gradients in the fluid; hence, the sign of the interfacial tension may change. In an atomic fluid, the repulsion parameter, b, in the van der Waals EOS arises from the hard core repulsion, while the attraction parameter, a, comes from a long range weak attraction. Therefore, they appear in different length scales, and accordingly, only the parameter a- related to the long-range structure- is responsible for the behavior the interfacial tension. On the contrary, for a DPD fluid there is no excluded volume interaction, and all interactions between the particles take place at the same length scale, rc . Then, the relative strength of the different contributions will determine their overall net effect. It is known that a microscopic model in which both attractions and repulsions are long ranged leads to a van der Waals equation of state in which the interfacial behavior can either favor or penalize the presence of interfaces23 . The van der Waals fluid introduced in this paper shares these same properties. Even if we can ensure a van der Waals EOS for a fluid, a careful tuning of the parameters a, b and α3 may lead to a van der Waals model for lamellar fluid, whenever interfaces are favored. Although unrealistic for atomic fluids, this behavior is relevant, e.g for nanoparticles, for which repulsive and attractive interactions act on similar length scales24 .
8 Therefore, depending on the kind of fluid that needs to be modeled at mesoscopic scales, the parameters in the free energy should be chosen appropriately. For example, in order to get a positive surface tension, the densities of the fluid phases is restricted because one must ensure that both the pressure and the surface tension are positive. In fig.2 we display the curves where the pressure and the surface tension vanish for two different values of α3 . The area defined in between the corresponding set of curves defines the region of phase space where the fluid is mechanically stable with a positive surface tension. Remember that the values of a and b set the critical values ρc and Tc . The allowed regions do not change very much as the parameter α3 is modified. If we make b = 0, this model reduces to that of Groot and Warren. In this case, γ˜ becomes negative (remember that a is negative now). As we have mentioned in subsection II A, there is no fluid-fluid phase separation in this model; therefore this negative value of the surface tension does not lead to a proliferation of interfaces. However, the negative value of γ˜ implies that the structure factor will have a minimum at a finite wave vector. We can define a characteristic length, ˜ l0 , on which local structure in the fluid will develop. If we expand the free energy eq.(24) to next order in gradients we can estimate this length to be s [wr4 ] ˜l0 ∼ 2πrc (31) 12[wr2 ] which does not depend on the amplitude a; only on the shape of the weight function w. Except for rapidly decaying weight functions, this length is of order of the interaction range rc . This fact is consistent with the local structure observed in the radial distribution functions for this model (see section IV A). We have also verified numerically the presence of a minimum in the structure factor S(k). B.
Binary mixture
We can also compute the interfacial tension for a binary mixture following the procedure of the previous subsection. The excess free energy in the continuum limit is now F ex = λ
Z
dr(ρA (r)nB (r) + ρB (r)nA (r)) + λA
Z
drρA (r)nA (r) + λB
Z
drρB (r)nB (r)
(32)
It is useful to introduce the total density ρ and the mole fraction c of component A as the relevant variables. They are defined as usual, ρA = ρc ρB = ρ(1 − c)
(33) (34)
If we expand the local densities n(r) in the same way as in eq.(27), we arrive at the square-gradient approximation for the free energy, [z 2 w] � λρA ∇2 ρB + λρB ∇2 ρA + λA ρA ∇2 ρA + λB ρB ∇2 ρB 2d[w] 2 [z w] 2 � = 2λρ2 c(1 − c) + λA ρ2 c2 + λB ρ2 (1 − c)2 + ρ −λc∇2 c − λ(1 − c)∇2 c + λA c∇2 c − λB (1 − c)∇2 z 2d[w] [z 2 w] 2 � ρ 2λ − λA − λB )|∇c|2 (35) = 2λρ2 c(1 − c) + λA ρ2 c2 + λB ρ2 (1 − c)2 + 2d[w]
F ex =
Z
dr2λρA (r)ρB (r) + λA ρA (r)2 + λB ρB (r)2 +
Assuming that ρ is constant, and for a symmetric mixture (λA = λB ), we get F ex = ρ2
Z
� � [z 2w] 2 dr 2(λ − λA )c(1 − c) + 2 (λ − λA )|∇c| 2d[w]
(36)
Again, the interfacial tension can have either a positive or negative sign, depending on the relative magnitudes of the λ parameters. If λA = λB = 0, and only the repulsion between the particles belonging to different species is kept, then the surface tension has the same sign as λ, as expected.
9 The interfacial width ξ can be obtained taking into account that the concentration profiles converges exponentially to its bulk value. This gives us ξ 2 = 4κ/F ′′ , where κ/2 is the amplitude of the |∇c|2 in the gradient expansion of the free energy, and F ′′ is the second order derivative of the free energy with respect to the concentration evaluated at its bulk coexisting value. In the symmetric case, we get
ξ2 =
[z 2 ω] [ω]
� −1 +
T 4Tc c∞ (1 − c∞ )
�−1
(37)
where c∞ is the value of the concentration in the bulk phase. The surface tension, γ, can be obtained integrating the diference between the free energy profile and its bulk value. In the small gradient limit, it reduces to
γ=
Z
∞
−∞
ρ
[z 2 ω] Tc |∇c|2 2d[ω]
(38)
If we assume that the concentration profile is a tanh, we get the estimate
γ=
2[z 2 ω] ρTc (c∞ − 1/2)2 3[ω] ξ
(39)
Close to the critical point, we recover the expected limiting behavior for the interfacial properties22 , s � �3 Tc 2[z 2 ω] T γ = 2ρkB Tc 1− T 3d[ω] Tc s [z 2 w] ξ = 4d[w](1 − T /Tc ) IV.
(40) (41)
EQUILIBRIUM PROPERTIES
We will now analyze the equilibrium properties of the examples of non-ideal DPD systems introduced in section II and will compare with the predictions of previous models performing numerical simulations. We take the interaction range rc as the unit of length, the mass of the DPD particles m as the unit of mass, and the critical thermal energy, kB Tc , of the corresponding free energy as the unity of energy. If no phase transition is present, then kB T is taken as the unit of energy. The equations of motion are integrated self-consistently to avoid spurious drifts in the thermodynamic properties10 . A.
Groot and Warren fluid
Before studying a DPD model with fluid-fluid coexistence, we compare the results of our model for a Groot-Warren fluid with the original one, based on forces given by eq.(11). In this case, both models should coincide and we analyze it to see the effects of the weight function shape on the properties of non-ideal fluids.. We have performed simulations for a DPD fluid in 3 dimensions, taking as parameters a = 25 and α = 0.101- which corresponds to those used in21 . In fig.3 we compare the predictions for the EOS given by our model and by running a DPD simulation with the Groot-Warren model. Groot and Warren used the same weight function for all pairwise forces. The proposed model for this non-ideal fluid shows neatly that for the present class of models a linear weight function is not suitable to sample the local density of each DPD particle, because it leads to a pairwise conservative force that exhibits a discontinuity at the edge of the interaction region, rc . We have analyzed the effect of such a jump on the thermodynamic and structural properties of this system. To this end, we have considered both decreasing linear and quadratic w’s. In fig.3 we compare the EOS obtained from simulations; for a quadratic w, our model coincides with that of GrootWarren. However, for a linear w, the agreement survives only at low densities. This DPD model has a transition to a solid state at high densities, and the results obtained indicate that the location of such a transition is sensitive to the shape of the weight function - the characteristic force felt by each particle depends on the shape of w for a given
10 density. In figs.4-5 we compare the radial distribution functions for our model and that of Groot-Warren, and for for different w’s, at increasing values of the density. It is clear that the shape of w plays an important role in the local structure of the fluid, and will influence the location of the fluid-solid transition. In section III A we have noted that for the present model there exists a characteristic length, ˜l0 , associated with density fluctuations and which is of order rc . Only for fairly narrow weight functions will this length become much smaller than rc . At low densities, a linear w generates less local structure, a pleasant feature for a mesoscopic model. However, as the density is increased, the local structure develops faster for a linear weight function, leading sooner to a transition to the ordered phase. The use of a quadratic weight function leads to results identical to those of the GW model, while a linear force tends to smooth the structure at short distances. The mean repulsion between particles is larger with a linear w rather than with a quadratic one. Moreover, it seems plausible to assume that the discontinuity in the force induces a higher sensitivity to local density fluctuations. These results show how the modifications of the shape of the weight function can be used to tune fine details of the behavior of a fluid, once the EOS has been fixed. B.
van der Waals fluid
Next, we focus on the liquid-gas equilibrium properties of a two-dimensional van der Waals fluid. Taking a homogeneous system, we can analyze the effect of the density fluctuations on the EOS, and compare it with the predictions coming from the macroscopically assumed EOS. In fig.6, we show the pressure values obtained in simulations run at fixed homogeneous density, volume and temperature. In this case we can recover the characteristic van der Waals loop. The actual coexistence curve should be derived from it using the equal area Maxwell’s construction. The agreement with the expected EOS from the macroscopic free energy is very good, and only small deviations are observed, due to particle correlations. We have also analyzed the density and pressure profiles when we bring into contact a liquid and a gas in the coexistence region. As mentioned in section II, the compressibility of the fluid, especially in the coexistence region, is very sensitive to the parameter α3 that characterizes the amplitude of the term cubic in the pressure. For α3 = 0 the density profiles tend to fluctuate substantially. Note that our estimates for the parameters and ranges of stability are all based on a mean field description, which may be no longer quantitatively correct under such conditions. Due to this, a series of simulations will be needed for each set of selected parameters whenever a detailed, quantitative comparison, may be required. When the parameter α3 is increased (we have taken the value α3 = 5), imposing an initial slab of liquid in coexistence with a slab of gas the interface remains stable, and the density fluctuations in the liquid phase are not too large. In Fig.7 we show the temperature, pressure and mean square displacement of the system during the extension of the simulation. One can see that the temperature does not shift, and corresponds to its nominally assigned value. The pressure exhibits important fluctuations, but if we subtract the normal and tangential components (in the figure we only display the averaged pressure), their difference, which is twice the surface tension, gives a value with a well-defined positive mean. Also the mean square displacement shows that particles have had the time to diffuse the interfacial width, which is roughly proportional to the interaction range, rc , indicating that the droplet is stabilized. Fig.8a shows the density profiles obtained by starting with a step density profile in the liquid-gas coexistence region, where the numerical errors are smaller than the fluctuations, as in the rest of the plots. The shape of the drop is stable and the interfaces fluctuate around their initial location, as could be expected. The density ratio between the two fluid phases, ρliq /ρgas = 4 makes it reasonable to call the two phases liquid and gas. The density in the gas phase is 10rc−2 , which ensures that in both phases the number of interacting particles is sufficiently high. By looking at the density profiles one can also observe that the density fluctuations in the dense phase are small, as expected on the basis of the small compressibility of the fluid. Finally, we have also computed the components of the pressure tensor across the profiles. For an inhomogeneous fluid there is no unambiguous way of computing the local components of the pressure tensor; we follow here the procedure described in ref.25 and display them in fig.8b. They follow basically the increase in density, exhibiting larger fluctuations in the liquid phase. In the bulk phases, the two components of the pressure tensor have to be equal. This is clearly shown in fig.9, where the differences in the two components are confined to the interfaces, if we compare the location of the differences with the density profiles of fig.8a. Moreover, the increase in fluctuations in the dense phase is clearly displayed. The equilibration of the drop can also be monitored by analyzing the time scale at which the pressure profile becomes symmetric at both interfaces. Together with the pressure differences, we have also plotted in thin line the integral of the pressure difference across the profile. This quantity is the surface tension, and indeed, the values we get when the profile is equilibrated agree with the predictions extracted from the mean pressures, displayed in fig.7. We have also computed the excess free energy profile. Its integral gives us an alternative (thermodynamic) route to compute the surface tension. We have verified that the values of the surface tension obtained integrating the excess free energy profile coincides with the value presented above, computed along
11 the virial route. Another appealing feature of these conservative interactions is that their density dependence induces smooth local structure. Indeed, if we analyze the radial distribution functions for a homogeneous phase, we can see that the structure in this case is almost non-existent. When an interface is present it is hard to assess the spurious structure that the model may induce through the density profile . All we can say is that the decay of the density is monotonic from one phase to the other, and avoids therefore spurious structure close to the interface. Such a structure would be spurious on the mesoscopic scale modeled by the DPD fluid. In contrast, the onset of structuring of the liquid-vapor interface on an atomic scale (beyond the Fisher-Widom line) is a real effect26 . C.
Binary mixture
Finally, we have run simulations for a binary mixture corresponding to the model described in section II.C. As in the previous subsection, we concentrate on the equilibrium properties of the fluid in the coexistence region. We have simulated a 2D fluid, starting with an initial step profile in concentration. In fig.10 we show the evolution of the temperature and pressure, which remain essentially constant through the simulation. We also display the root mean square displacement of the two species. One can clearly see that after a short initial period, when the species start to feel the presence of the interfaces their effective diffusion slows down. The fact that the mean square displacement is much larger than the interfacial width, which remains of the order of the interaction range, rc , ensures that the initial configuration has relaxed to its proper equilibrium shape. We have computed the concentration profiles as a function of time. In fig.11 we show the concentration profiles of one of the species at an initial and late stage of the relaxation towards the equilibrium coexistence. As was the case in the van der Waals fluid, the fluctuations are greater in the concentrated phase. Although the concentration of each species goes basically to zero in one of the two coexisting phases, the interface does not broaden and keeps its width within rc . Despite this large concentration gradient, the mean density barely changes across the interface. These normalized mean densities are displayed in also in fig.11 as thin curves. Although a small dip in the normalized mean density appears at the interfaces, its value is not large compared with the typical bulk density fluctuations (which are due to the compressibility of the fluid). Again, this indicates that the use of concentration dependent conservative forces suppresses the appearance of spurious structure at interfaces, while still being able to drive the phase separation. We can also test the predictions of section III B for the interfacial properties on the basis of a binary mixture. To this end, we have integrated numerically eq.(38) using the concentration profiles obtained from the simulations, and we have compared the results with the theoretical prediction, eq.(39). We display the results in fig.12, where we have multiplied the theoretical curve by an overall numerical factor, since the numerical prefactors in eq.(39) are approximate. One can observe that the overall good agreement is lost at small temperatures, where the interface is very sharp, and close to the critical point, where fluctuations are expected to play a relevant role. V.
CONCLUSIONS
We have presented a new way of implementing conservative forces between DPD particles. Rather than assuming a force that depends on the interparticle separation, we have introduced a conservative interaction that depends on the local excess free energy. In this way, it is possible to fix beforehand, at the mean field level, the desired thermodynamic properties of the system. However, this procedure neglects the effect of particle correlations. Whenever an accurate quantitative comparison is needed, a set of numerical simulations will be required to determine accurately the appropriate phase diagram. We could equally use the free energy to carry out Monte Carlo simulations to analyze the static properties of fluids; this procedure will suffer from similar drawbacks as a result of the ignored particle correlations. When the free energy per particle depends on the averaged local density, it is possible to recover central pairwise additive forces- an important computational feature. The only assumption we have made is that the system is isothermal, although it should be straightforward to generalize it to include energy transport, along the lines developed previously27 . These models can be viewed as a dynamical density functional theory (DFT) for smooth conservative forces with local momentum conservation. However, since the DPD particles do not have a local structure, these models can only describe the dynamics at a mesoscopic level, while the usual dynamical DFT can account for the dynamics down to the microscopic scale. In addition to the freedom in the choice of the free energy, this new type of proposed forces leads to weaker structure at short distances. Hence, we can enforce a proper length and time scale separation, avoiding the appearance of
12 microscopic features of the system at distances of order rc . At the mean-field level, and using standard techniques, it is easy to derive expressions for the interfacial properties. We have shown that the absence of internal structure of the DPD particles (implying that all forces act on the same length scale) leads to qualitatively new behavior not present in atomic fluids. From the physical point of view it shows that, for example, the same thermodynamic system can be tuned to favor macroscopic or microscopic phase separation. Although it may seem unrealistic, the competition of attractive and repulsive effective potentials on the same length scales correspond to certain physical situations, and they are probably more common on the mesoscopic than in the microscopic domain. In this respect, the models we have introduced are quite flexible because, for a given bulk thermodynamic behavior (e.g. a given EOS), it is still possible to modify the parameters to control other physical properties. For example, the mean interaction strength can be changed by modifying the way in which the local density is sampled, or for the van der Waals fluid, it is possible to modify the compressibility (and hence the speed of sound). As in any diffuse interface model, the typical interfacial width sets a minimum length scale in the system. For DPD, the natural scale is rc , unless the parameters are chosen carefully. Acknowledgments
The work of the FOM Institute is part of the research program of “Stichting Fundamenteel Onderzoek der Materie” (FOM) and is supported by the Netherlands Organization for Scientific Research (NWO). We acknowledge Pep Espa˜ nol for sending us at the early stages of this work a preprint on a similar model for treating conservative forces in DPD, P.B. Warren for enlightening and encouraging discussions and J. Yeomans and S.I. Trofimov for helpful comments.
1 2 3 4 5 6 7 8 9 10 11 12 13 14 15 16 17 18
19 20 21 22 23 24 25 26 27
G. R. McNamara and G. Zanetti, Phys. Rev. Lett. 61, 2332 (1988). U. Frisch, B. Hasslacher and Y. Pomeau, Phys. Rev. Lett. 56, 1505 (1986). J. J. Monaghan, Annu. Rev. Astron. Astrophys. 30, 543 (1992). D. L. Ermack and J. A. McCammon, J. Chem. Phys. 69, 1352 (1978). J. F. Brady and G. Bossis, Ann. Rev. Fluid. Mech.20, 111 (1988). P. J. Hoogerbrugge, and J.M.V. Koelman, Europh. Lett. 19, 155 (1992). E. G. Flekkøy and P. V. Coveney, Phys. Rev. Lett. 83, 1775 (1999). P. Espa˜ nol and P. B. Warren, Europh. Lett. 30, 191 (1995). C. Marsh, G. Bacxk, and M. H. Ernst, Phys. Rev. E 56, 1676 (1997). I. Pagonabarraga, M. H. J. Hagen and D. Frenkel, Europh. Lett. 42, 377 (1998). A. Masters and P. B. Warren, Europh. Lett. 48, 1 (1999). P. Espa˜ nol and M. Serrano, Phys. Rev. E 59, 6340 (1999). P. Espa˜ nol, Phys. Rev. E 57 , 2930 (1998). P. V. Coveney and K. E. Novik, Phys. Rev. E 54, 5134 (1996). R. Evans, in Fundamentals of Inhomogeneous Fluids, D. Henderson ed., (Dekker, New York, 1992). M. W. Finnis, and J. E. Sinclair, Philos. Mag. A, 50, 45 (1984) M. R. Swift, E. Orlandini, W. R. Osborn, and J. M. Yeomans, Phys. Rev. E 54, 5041 (1996). If there is local structure, the last term in eq.(10) will have an additional factor (1 + (1/d)[rwd ln g(r)/dr]/[w]). In this case, the virial and thermodynamic pressures will differ. The true pressure is the virial pressure, and the differences arise from correlations not accounted for in the macroscopic free energy used to derive the thermodynamic expression for the pressure. However, if the local structure varies smoothly, such differences can be disregarded. P. C. Hohenberg and W. P. Halperin, Rev. Mod. Physics 49, 435 (1977). U. Marini Bettolo Marconi, and P. Tarazona, J. Chem. Phys. 110,8032 (1999). R. D. Groot and P. B. Warren, J. Chem. Phys. 107, 4423 (1998). J. Langer, in Solids far from Equilibrium, C. Godr`eche ed., (Cambridge Univ. Press, Cambridge, 1991). R. P. Sear, and W. M. Gelbart, J. Chem. Phys. 110, 458 (1999). R. P. Sear, S. -W. Chung, G. Markovich, W. M. Gelbart, and J. R. Heath, Phys. Rev. E 59, R6255 (1999). J. H. Irving and J. G. Kirkwood, J. Chem. Phys. 18, 817 (1950). R. Evans, Mol. Phys. 88, 579 (1996). J. Bonet Avalos, and A. D. Mackie, Europh. Lett. 40, 141 (1997); P. Espa˜ nol, Europh. Lett. 40, 631 (1997).
13 5
6
α3=0 α3=5
α3=0 α3=5
4
4
3
χ
χ
2
2
0
1
−2
0
0
0.5
1
ρb
1.5
2
−4
0
0.5
1
1.5
ρb
2
FIG. 1: Compressibilities of the van der Waals fluid around the critical point, for two different values of the parameter α3 . a) Curves at T /Tc = 1.1; b) Curves at T /Tc = 0.8.
critical point α3=0 α3=0 α3=5 α3=5
1.5
T/Tc
1
0.5
0
0
1
ρ/ρc
2
FIG. 2: Curves where the pressure and the surface tension vanish for two different values of α3 for a van der Waals fluid. Above the solid curve the pressure is positive, and below the long dashed curves the surface tension is positive. The region contained in between the corresponding pair of curves corresponds to the portion of phase space where the fluid will be mechanically stable, with a positive surface tension. Above the long dashed curves the surface tension is negative. Two different values of α3 are considered: α3 = 0 and α3 = 5.
14
600 EOS Groot−Warren quadratic weight function linear weight fucntion
p
400
200
0
0
5
ρ
10
15
FIG. 3: Pressure as a function of the density for a Groot-Warren fluid, using both the previously proposed pairwise force, eq.(11), and for the force of the present form, eq.(12). In the second case we compare the behavior for a linear and a quadratic weight function. a = 25, α = 0.101. L = 6rc , kB T = 1, γ = 1 (See head of sec.IV for units).
1.25
1
0.75
g(r)
GW linear w quadratic w
0.5
0.25
0
0
1
2
3
r/rc FIG. 4: Radial distribution for a Groot-Warren fluid, using both the previously proposed pairwise force, eq.(11), and for the force of the present form, eq.(12). In the second case, we compare the behavior for a linear and a quadratic weight function. Same parameters as in fig.3. The mean density is ρm = 3.
15 3 quadratic w linear w
GW quadratic w linear w
1.5
2
g(r)
g(r)
1
1 0.5
0
0 0
0.5
1
1.5
2
2.5
0
0.5
1
1.5
2
2.5
3
r/rc
r/rc
FIG. 5: Radial distribution function for a Groot-Warren fluid, using both the previously proposed pairwise force, eq.(11), and for the force of the present form, eq.(12). In the second case we compare the behavior for a linear and a quadratic weight function. Same parameters than in fig.3. The mean densities are: a) ρm = 8 and b) ρm = 14.
20.0 simulation theory
P
15.0
10.0
5.0
0.0 0.02
0.07
0.12
0.17
1/ρ FIG. 6: Equation of state for a 2-D van der Waals fluid. The different sets of data points correspond to different temperatures. b = 0.016, a = 1.9b, α3 = 5, L = 7rc , γ = 1 (See head of sec.IV for units).
16
8
6
T/Tth P Pyy Pxx 2 1/2 ~γ
4
2
0
0
20
40
60
80
100
t FIG. 7: Thermodynamic values of a DPD fluid with a van der Waals EOS, when a liquid is coexisting with the gas phase, in two dimensions. The initial condition corresponds to a slab of fluid in the y direction in coexistence with a slab of gas. γ˜ is the interfacial tension, extracted from the mean pressures, γ˜ = (Ly /2)(Pyy − Pxx ). Also displayed the mean square displacement in units of the interaction range rc . Ly = 20, Lx = 3, kB T = 0.75, a = 1.9 ∗ b, b = 0.0156, α3 = 5. The unit of time is the time needed for a DPD particle to diffuse rc initially. (See head of sec.IV for units).
1.75
t=110.6 t=44.25 t=4.42
ρ/ρmean
pressure
1.25
0.75
0.25 −10
pn pt, t=110.6 pn pt,t=4.42
−5
−15
−25
−5
0
x/rc
5
10
−35 −10
−5
0
5
10
x/rc
FIG. 8: Equilibrium a) density and b) pressure profiles for a 2-D van der Waals fluid. The initial profile is a step profile. Same parameters as in fig.7 (See head of sec.IV for units).
17
5 t=110.61 t=4.42
4 3
pn−pt
2 1 0 −1 −2 −10
−5
0
5
10
x/rc FIG. 9: Profiles of the difference between the normal and tangential components of the pressure tensor along the system, for the pressure profiles of fig.8b. Same parameters as in fig.7 (See head of sec.IV for units).
22 20 18 16 14 12 10 8 T/Tth P 2 1/2 A 2 1/2 B
6 4 2 0
0
500
1000
1500
2000
t FIG. 10: Temperature, pressure and mean square displacements of the two species as a function of time, for a binary mixture below its critical temperature, T /Tc = 0.5, and with λ = 1, λA = 0.2 (See head of sec.IV for units).
18
2.5
2.0
1.5
1.0
0.5
0.0 −40.0 −30.0 −20.0 −10.0
2c, ρ, 2c, ρ,
t=50 t=50 t=2000 t=2000
0.0
10.0
20.0
30.0
40.0
x/rc FIG. 11: Profiles of the relative amount of one of the species across the system, at two different times. These curves have been multiplied by 2 to avoid confusion with the thin lines. The latter correspond to the normalized mean density at the same time (See head of sec.IV for units).
19
0.6 simulation theory
0.5
γ/kBTc
0.4
0.3
0.2
0.1
0
0
0.2
0.4
0.6
0.8
1
T/Tc FIG. 12: Surface tension for a binary mixture at density ρ = 0.5 with a critical temperature Tc = 8 and quicomposed, as a function of the temperature. The squares correspond to the expression derived from the mean field free energy in the small gradient limit.