to improve the learning performance, cross-modal data analy- sis aims to deal with massive ..... ferior only to SCM and CCA-3V among supervised methods about 5% and 4% under .... Multi-view k-means clustering on big data. In Proc. AAAI,.
Proceedings of the Twenty-Fifth International Joint Conference on Artificial Intelligence (IJCAI-16)
Group-Invariant Cross-Modal Subspace Learning Jian Liang1,2 , Ran He1,2,3⇤ , Zhenan Sun1,2,3 , Tieniu Tan1,2,3 1 National Laboratory of Pattern Recognition, Institute of Automation, Chinese Academy of Sciences (CASIA) 2 Center for Research on Intelligent Perception and Computing, CASIA 3 Center for Excellence in Brain Science and Intelligence Technology, CAS {jian.liang, rhe, znsun, tnt}@nlpr.ia.ac.cn Abstract Cross-modal learning tries to find various types of heterogeneous data (e.g., image) from a given query (e.g., text). Most cross-modal algorithms heavily rely on semantic labels and benefit from a semantic-preserving aggregation of pairs of heterogeneous data. However, the semantic labels are not readily obtained in many real-world applications. This paper studies the aggregation of these pairs unsupervisedly. Apart from lower pairwise correspondences that force the data from one pair to be close to each other, we propose a novel concept, referred as groupwise correspondences, supposing that each paired heterogeneous data are from an identical latent group. We incorporate this groupwise correspondences into canonical correlation analysis (CCA) model, and seek a latent common subspace where data are naturally clustered into several latent groups. To simplify this nonconvex and nonsmooth problem, we introduce a nonnegative orthogonal variable to represent the soft group membership, then two coupled computationally efficient subproblems (a generalized ratio-trace problem and a non-negative problem) are alternatively minimized to guarantee the proposed algorithm converges locally. Experimental results on two benchmark datasets demonstrate that the proposed unsupervised algorithm even achieves comparable performance to some state-of-the-art supervised cross-modal algorithms.
1
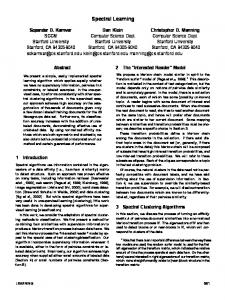
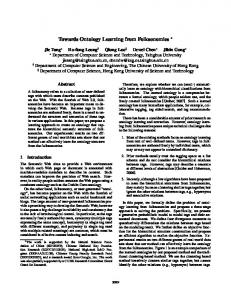
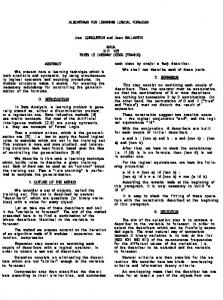
Figure 1: A simple demonstration of how CCA and the proposed method SPGCM obtain correlated common subspaces between modalities. 4 and represent different semantic samples, while hollow and solid symbols represent samples in different modalities. Figures with a bold border denote learned latent common subspaces by CCA and SPGCM respectively. Arrows in the SPGCM subspaces serve as the group centers via cosine similarity. Note that CCA is a special case of SPGCM when K = n. to improve the learning performance, cross-modal data analysis aims to deal with massive data with incomplete modalities especially during the testing phase. In this paper, we focus on cross-modal learning that attempts to take one type of data as a query to retrieve relevant data objects in another type. Canonical Correlation Analysis (CCA) [Hardoon et al., 2004] is a fundamental tool to describe the relationship between two different modalities. It maximizes pairwise correspondences so that paired heterogeneous data are close to each other in the learned subspace. Besides, most crossmodal subspace learning methods exploit semantic labels to learn better representations or to discover a superior common subspace. Various supervised structure-preserving techniques such as Linear Discriminant Analysis (LDA) and Marginal Fisher Analysis (MFA) are utilized to improve learning performance in [Sharma et al., 2012]. In spite of the better retrieval performances achieved by supervised methods, additional semantic labels are usually expensive and timeconsuming to obtain in real-world applications. However, groupwise correspondences (shown in Fig. 1) are often ignored in unsupervised learning, which suppose that paired heterogeneous data are from the same latent
Introduction
With the rapid development of Internet, massive data in multiple modalities such as images, audios, videos and text descriptions are emerging. For example, when visiting place for sightseeing, people might want to send tweets or messages consisting of pictures, text descriptions and video clips. These heterogeneous data are usually associated to depict the same entity. How to efficiently analyze the data across different modalities comes into prominence. Different from multimodal data analysis that tries to integrate multiple modalities ⇤
Corresponding Author.
1739
group. In contrast to pairwise correspondences, groupwise correspondences are higher correspondences, which try to guarantee the paired heterogeneous data close to each other in a semantic-like level. Furthermore, they can be seen as the relaxed pairwise correspondences in a semantic layer which can allow more degrees of freedom to avoid overfitting brought by the maximization of pairwise correspondences. Besides, by introducing a latent variable that plays a similar role as the semantic label variable in supervised methods, we develop a novel method, called Simultaneous Pairwise and Groupwise Correspondences Maximization (SPGCM) to discover an optimal common subspace for unsupervised cross-modal learning. The objective function consists of three components, i.e., pairwise correspondences and two clustering-like terms in each modality. The clustering-like terms can be transformed into CCA-like terms via cosine similarity metric, resulting in a generalized CCA model. When the latent cluster indicators are identical, groupwise correspondences are maximized. The subspace projections of different modalities are learned through discovering a latent common subspace and clustering projected data simultaneously. To summarize, the main contributions of this paper are three-fold:
Cxx1 Cxy Cyy1 Cyx w = w, Cyy1 Cyx Cxx1 Cxy v = v.
• The joint learning framework involves simultaneously seeking a latent cluster indicator vector and a common subspace, resulting in a difficult optimization problem. We simplify this problem into two sub-problems, and turn the subproblems on learning the subspace to a ratiotrace problem, which can be efficiently minimized; • Experimental results on two benchmark datasets demonstrate that our method obtains comparable or even better results with state-of-the-art supervised methods, and suggest that both pairwise and groupwise correspondences are important for cross-modal subspace learning.
Related Work
3
Since subspace based methods such as CCA [Hardoon et al., 2004] play an important role in cross-modal learning, we first give a brief review of CCA (a detailed introduction can be found in [Hardoon et al., 2004]) and address some recent subspace learning methods later in this section. Given two multivariate random variables x 2 Rdx and y 2 Rdy with zero mean, let the two sets Sx = {x1 , ..., xn } and Sy = {y1 , ..., yn } be paired one by one. CCA aims to discover two new coordinates for x, y by choosing two new directions w 2 Rdx , v 2 Rdy respectively, such that the correlation between the projection of Sx and Sy on w and v is maxiwT Cxy v p T mized. The correlation value ⇢ = max p T w,v
w Cxx w
(1)
Here = ⇢2 and Fig. 1 simply shows how CCA works. To further explore subspace information, Generalized Multiview Linear Discriminant Analysis (GMLDA) and Marginal Fisher Analysis (GMMFA) are proposed to learn projections from each modality to a common subspace through CCA constraints and semantic-preserving constraints simultaneously [Sharma et al., 2012]. Besides, Learning Coupled Feature Spaces (LCFS) [Wang et al., 2013] integrates feature selection into cross-modal learning for better feature representations. A deep analysis of pairwise correspondences (or pairwise constraints) for cross-modal learning is given in [He et al., 2015]. It is worth noting that cluster CCA (CCCA) [Rasiwasia et al., 2014] resorts to the concept of cluster. However, CCCA heavily relies on external semantic labels to obtain semantic clusters. Different from groupwise constraints, CCCA merely extends narrow pairwise correspondences to generalized pairwise correspondences, where correspondences between heterogeneous data with identical labels are considered as well. On the other hand, [Gong et al., 2014] tries to directly apply generalized CCA model with more than two views to supervised cross-modal problems, but the mutual promotion between clustering and CCA constraint is ignored. Additionally, multi-view clustering methods [Cai et al., 2013] try to learn the latent cluster indicator shared by multiple views, however, most of them ignore the pairwise correspondences. Although [Chaudhuri et al., 2009] exploits CCA into multiview clustering, it just tries to transform the raw features before clustering. In our proposed method, the latent clustering indicator vectors can be seen as the third view that can help align both modalities with this latent variable. This problem can be further simplified with some user-defined distance metrics to learn the latent indicator vectors and projections from two modalities to the latent common space.
• To the best of our knowledge, it is the first time to address the issue of higher groupwise correspondences for unsupervised cross-modal learning, which can be potentially robust in the real-world scenarios;
2
Pn
T i=1 xi yi is the between-set covariance matrix. E(·) indicates empirical expectation. Owing to the Lagrangian multiplier methods, the problem above can be reduced to a generalized eigenvalue problem, where w and v correspond to the top eigenvectors respectively: 1 n
Our Methodology
In this section, we first present the details of our proposed SPGCM and then describe its optimization algorithm as well as the algorithmic analysis.
3.1
Notation and Problem Definition
Assume that there are n observations from two views (modalities), denoted {xi , yi }ni=1 , where xi is the i-th row of the first view X 2 Rn⇥dx , similarly, yi is the i-th row of the second view Y 2 Rn⇥dy , and dx and dy are the dimensionalities of each modality respectively. Without lossPof generality, all n data i.e., i=1 xi = 0 and Pn are assumed to be zero-centered, a⇥a denotes the identity i=1 yi = 0. Moreover, Ia 2 R matrix, and k · kF denotes the Frobenius norm of a matrix. Cross-modal subspace learning methods aim to learn a low-dimensional common subspace Rc and two projection
v Cyy v
T where Cxx = Pn ⇢ is Tthe correlation value, PnE[xx T] = 1 1 T i=1 xi xi and Cyy = E[yy ] = n i=1 yi yi are n the within-set covariance matrices and Cxy = E[xy T ] =
1740
functions f (xi ) = xTi Wx and g(yi ) = yiT Wy , where Wx 2 Rdx ⇥c and Wy 2 Rdy ⇥c denote two projection matrices for each modality respectively. Furthermore, we assume that both modalities are observed for all data points in the training set. All experiments are conducted on two image-text datasets for cross-modal retrieval problem. Cross-modal learning in this paper mainly includes two retrieval tasks: 1) using text query to search for related images, and 2) using image query to retrieve related texts.
3.2
Hence we can take the indicator matrix as the latent third view, which facilitates to seek the optimal principal directions (i.e., the cluster centers under the cosine similarity metric). X h(xi Wx , gi B) = kXWx GBk2F i
T Wx,i X T GBj = 0, i, j = 1, . . . , c, i 6= j
Here 1 2 RK indicates a vector with all elements being 1, Bj is the j-th column of B, representing the j-th uncorrelated dimension in the latent common subspace. 1 Denote F = [f1 , . . . , fn ]T = G(GT G) 2 as the scaled indicator matrix, namely, fi is the optimal scaled cluster indicator of low-dimensional variables gi [Qian and Zhai, 2013; 1 Tang et al., 2013]. Let D = (GT G) 2 B 2 RK⇥c , we can 1 1 attain GB = F (GT G) 2 B = F D. Because (GT G) 2 is a diagonal matrix whose diagonal elements correspond to the size of each cluster, and rows in D can be seen as weighted cluster centers with the correlation distance unchanged. Imposing an orthogonal constraint on F and combining Eq. 5, we can rewrite Eq. 4 as:
Model Formulation
On one hand, we force paired heterogeneous data depicting the same content from different modalities to be close to each other [He et al., 2015], referred as pairwise correspondences, when multiple canonical directions can be learned jointly through the formulation below, addressed in the generalized CCA model [Hardoon et al., 2004; Gong et al., 2014]: min Lo = kXWx
Wx ,Wy
Y Wy k2F
s.t. WxT X T XWx = Ic , WyT Y T Y Wy = Ic ,
(2)
T Wx,i X T Y Wy,j = 0, i, j = 1, . . . , c, i 6= j.
Here Wx,j means the i-th column in Wx , i.e., the i-th canonical direction for X while Wy,j means the j-th column in Wy , and c is the dimension of the latent common subspace. On the other hand, we also expect the cluster indicator vector of data samples in each modality to correspond with each other, referred as groupwise correspondences. Benefiting from multi-view clustering [Cai et al., 2013; Liu et al., 2013], one collective indicator matrix variable G 2 Rn⇥K is introduced to our model instead of several indicator matrices, where K indicates the number of groups. Under the framework of vector quantization, we further adopt the cosine simT y ilarity h(x, y) = kxkx2 kyk , where x, y are two column vec2 tors. Hence several principal directions (group centers) can be discovered in the common subspace. The detailed loss of groupwise correspondences is defined as: X min Lg = h(xi Wx , gi B) + h(yi Wy , gi B) G,B (3) i P K s.t. gi = 1, gi 2 {0, 1} , 8i 2 [1, . . . , n],
min
Wx ,Wy ,F,D
min
L(Wx , Wy , G, B) = (1
✓)Lo + ✓Lg
/ ↵Lo + Lg ,
Y Wy k2F + kXWx
T
s.t.
F Dk2F + kY Wy
F Dk2F
0, D F F D = Ic , T
F F = IK⇥K , F
T
(6)
WxT X T XWx = Ic , WyT Y T Y Wy = Ic , T Wx,i X T Y Wy,j = 0, DiT F T XWx,j = 0,
DiT F T Y Wy,j = 0, i, j = 1, . . . , c, i 6= j,
where Di is the i-th column in D. As shown in [Yu et al., 2011], Eq. 6 can be further simplified as: ✓ T ◆ W Mf W max tr , W,F WT NW (7) T s.t. F F = IK , F 0, Mf =
"
0 ↵Cyx Cf x
(4)
Reformulation and Relaxation
Note that, the cosine similarity adopted in groupwise correspondences is consistent with the objective function of CCA.
s.t.
1741
"
↵Cxy 0 Cf y
Cxf Cyf 0
#
, N=
"
Cxx 0 0
0 Cyy 0
0 0 Cf f
#
, (8)
# Wx where W = Wy 2 R(dx +dy +K)⇥c , Mf is the weighted D covariance matrix while N is a block diagonal covariance matrix, which is unrelated with F according to the orthogonality on F (i.e., Cf f = F T F = IK ). However, it is still challenging to obtain the optimal F with two hard constraints. Inspired by [Liu et al., 2014; Han and Kim, 2015], we introduce an auxiliary variable with an additional constraint of E = F . This reformulation step aims to detach the non-negative constraint from F and assign the constraint to E. Then the final objective function for SPGCM is developed as follows: ✓ T ◆ W Mf W ˜ max C(W, F, E) = tr kE F k2F , W,F,E WT NW
where ↵ = 1 ✓ ✓ is a positive tradeoff parameter. When ↵ ! 1, i.e., ✓ ! 0, the objective function is equivalent to CCA.
3.3
L(Wx , Wy , F, D)
= ↵kXWx
where bj 2 Rc is the j-th row in B 2 RK⇥c , representing the corresponding cluster center in the low-dimensional common subspace. Then the overall objective function, integrating both the pairwise correspondences loss Lo in Eq. 2 and the groupwise correspondences loss Lg in Eq. 3, takes the following form, Wx ,Wy ,G,B
(5)
B T GT GB = Ic , G1K = 1n ,
s.t.
F T F = IK , E
0,
(9)
where is another positive tradeoff parameter to control the degree of equivalence between E and F .
3.4
where U 2 Rn⇥n and V 2 Rk⇥k are respectively the left and right eigenvectors of P QT obtained by Singular Value Decomposition (SVD).
Optimization Algorithm
Proof.
The optimization problem in Eq. 9 can be minimized by iteratively updating the following steps until convergence or the pre-set maximum number of iterations is reached. 1) Fix F and E, solve the generalized ratio-trace maximization problem below through generalized eigenvalue decomposition: Mf W = Diag( )N W,
kP
(10)
which completes the proof.
max tr
F T F =I
= max tr(S 1 W T Mf W ) + 2 tr(F T E) + const, F T F =I ⇥ ⇤ = max 2tr (JS 1 DT + ⌘E)F T + const.
3.5
(13)
n⇥dy
2. Update W (t) and E (t) via Eq. 10 and Eq. 12 respectively; 3. Decompose JS 1 DT + ⌘E by SVD and update F (t) by Eq. 19; 4. t = t + 1; until F (t) converges or t T.
4 4.1
Proposition 1. Suppose we have two matrices P 2 R and Q 2 Rk⇥m . The two optimization problems shown below Z T Z = Ik ,
(14)
Z T Z = Ik
(15)
max tr P QT Z T , s.t. Z
have the identical optimal solution as Z ? = U In,k V T ,
(19)
Algorithmic Analysis
(20)
Experiments Datasets and Setting
Experiments are conducted on the Wiki [Rasiwasia et al., 2010] and Pascal VOC [Hwang and Grauman, 2012] datasets. We further design two different protocols for each dataset to evaluate our proposed SPGCM. Notably, the following retrieval performances are evaluated where the gallery consists of testing images (or texts) for a text (or image) query. The Wiki dataset consists of 2,866 documents containing image-text pairs annotated with 10 semantic labels and each image is closely related to the content of the article. Each text
n⇥m
ZQk2F , s.t.
(18)
where W (t) , F (t) and E (t) are the optimal variables in each iteration. We summarize our overall optimization algorithm for SPGCM in Algorithm 1. The asymptotic complexity of our SPGCM method is O td3 + O n2 K , where t is the iteration number and d = dx + dy + c, and c denotes the dimension of the learned latent common space. The computation of the covariance matrix is O nd2 + tcnd and eigenvalue decomposition and matrix inverse occupy O td3 + tK 3 + td3 . The computation of E and F is O tn2 K + tnc2 . Generally, c K ⌧ d, then the total complexity is O td3 +O n2 K . Since our algorithm usually converges in a few iterations, the time complexity tends to be small.
Input: Training data X 2 R ,Y 2R , dimension of common space c, group number K, parameters ↵, . Output: Projection functions Wx 2 Rdx ⇥c , Wy 2 Rdy ⇥c and canonical correlations . Initialization: G(0) , F (0) using K-means, t = 1, and T = 10. repeat 1. Calculate Mf using Eq. 8;
Z
tr(U ⌃V T Z T ),
(t) (t+1) ˜ ˜ C(W , F (t) , E (t) ) C(W , F (t) , E (t+1) ) (t+1) ˜ C(W , F (t+1) , E (t+1) )
Algorithm 1 Simultaneous Pairwise and Groupwise Correspondences Maximization (SPGCM)
min kP
i
In our algorithm, W , F and E are alternately optimized for several iterations. Since the objective function is bounded and maximized in each update, the sequences generated by our algorithm will be converging, i.e.,
F T F =I
n⇥dx
i=1
where U 2 Rn⇥k and V 2 Rk⇥k are respectively the left and right eigenvector bases of P QT obtained by SVD.
F k2F ,
kE
Pk
F = U In,K V T
(12)
3) Fix W and E, denoting S = W T N W 2 Rc⇥c , S is an irrelevant matrix to F , and J = XWx + Y Wy 2 Rn⇥c , then the subproblem of optimizing F turns out to be: ◆
(17)
The solution of F is obtained by Proposition 1 with P QT = JS 1 DT + ⌘E as
The optimal solution of E can be directly obtained by
W T Mf W WT NW
2tr(ZQP 0 )
T
2tr(P Q Z )
T tr(U ⌃V T Z ?T ) = tr(⌃In,k )=
E 0
✓
= const
T
By using von Neumann’s trace inequality [Horn and Johnson, Pk 2012] and Z T Z = Ik , we have tr(U ⌃V T Z T ) i=1 i where i is the i-th largest singular value of P QT . Then for any column orthogonal matrix Z,
where are the corresponding eigenvalues. 2) Fix W and F , the subproblem only relates to E, taking the form: min kE F k2F . (11) Ei,j = max(Fi,j , 0).
ZQk2F = tr(P T P ) + tr(QT Z T ZQ)
(16)
1742
0.28 CCA PLS BLM UCCA3V SPGCM
0.22 0.2
0.26 CCA PLS BLM UCCA3V SPGCM
0.26 0.24
0.16
0.2 0.18 0.16
CCA PLS BLM UCCA3V SPGCM
0.3 0.28
0.22
Precision
Precision
Precision
0.22 0.18
0.32 CCA PLS BLM UCCA3V SPGCM
0.24
0.26
Precision
0.24
0.2
0.18
0.24 0.22 0.2
0.14 0.18
0.14 0.16
0.12 0.1
0.12 0
100
200
300
400
500
600
0.1
700
0.16 0
100
200
300
Scope
400
500
600
0.14
700
0
200
400
Scope
(a) Image Query
600
800
0.14
1000
0
200
400
Scope
(b) Text Query
600
800
1000
Scope
(c) Image Query
(d) Text Query
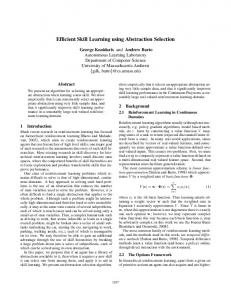
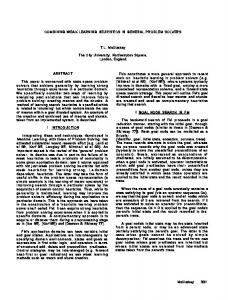
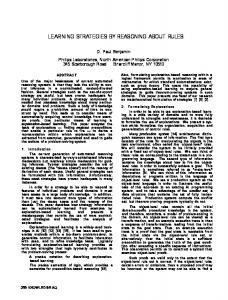
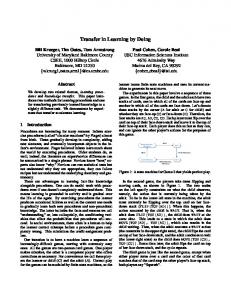
Figure 2: Performance compared with different unsupervised subspace methods on the Wiki Protocol-I dataset in (a-b) and on the Wiki Protocol-II dataset in (c-d), based on precision scope curves. 0.45
0.35 CCA PLS BLM UCCA3V SPGCM
0.3
0.35 CCA PLS BLM UCCA3V SPGCM
0.4 0.35
0.4 CCA PLS BLM UCCA3V SPGCM
0.3
CCA PLS BLM UCCA3V SPGCM
0.35
0.3 0.25
0.25
Precision
0.2
Precision
Precision
Precision
0.3 0.25
0.2
0.25
0.2 0.2 0.15
0.15
0.15
0.15 0.1
0
200
400
600
800
1000
Scope
(a) Image Query
0.1
0
200
400
600
800
0.1
1000
0
Scope
200
400
600
800
1000
Scope
(b) Text Query
(c) Image Query
0.1
0
200
400
600
800
1000
Scope
(d) Text Query
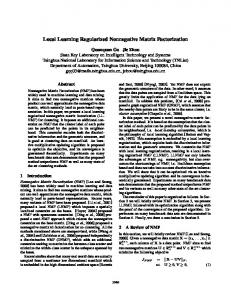
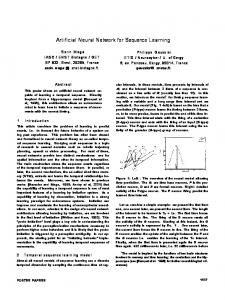
Figure 3: Performance compared with different unsupervised subspace methods on the VOC Protocol-I dataset in (a-b) and on the VOC Protocol-II dataset in (c-d), based on precision scope curves. is represented by 10-dimensional LDA topic features while the image is denoted with a 128-dimensional SIFT feature. In [Costa Pereira et al., 2014], the authors randomly split the whole set into 2,173/ 693 (training/ testing) sets respectively, which is adopted in the following experiments as Protocol I. However, taking the unbalanced distribution into consideration in [Wang et al., 2013], we split it into 1,300/ 1,566 (130 pairs per class training/ testing) as Protocol II. The Pascal-VOC 2007 dataset consists of 5,011/4,952 (training/ testing) image-tag pairs, which can be categorized into 20 classes. The images containing only one object are selected in the following experiments as [Sharma et al., 2012; Wang et al., 2013], resulting in 2,808 training and 2,841 testing data. For the features, 399-dimensional word frequency features are adopted for the texts while 512-dimensional Gist features are used for the images. We adopt dimensionreduced features (about 90% energy preserved) via Principal Component Analysis (PCA) for cross-modal retrieval as Protocol II with original features kept as Protocol I.
The mean average precision (MAP) is used to evaluate the performance of all algorithms. Higher MAP indicates better retrieval performance. Moreover, precision-scope curve [Rasiwasia et al., 2007] is adopted for evaluation as well, in which the scope is specified by the number of top-ranked items for users, obviously . Cosine similarity metric is adopted to calculate the similarities on the latent common subspace. For the projection functions, we adopt similar strategies as [Gong et al., 2014], i.e., x ˆ = xWx diag( ) 2 R1⇥c . For our proposed SPGCM, we use empirical value as 0.01, and ↵ as 0.01. Regarding the group size K, we directly fix it as the number of different groudtruth labels, i.e., K = 10 for the Wiki dataset, and K = 20 for the VOC dataset. The subspace dimension c is validated for the best performance for all methods, we further investigate its influence in Section 4.4. Besides, for the initialization of F , we simply utilize the cluster indicator obtained by spherical K-means clustering on the text modality.
4.2
Regardless of protocol I or II shown in Table. 1, SPGCM signicantly outperforms all unsupervised methods in the MAP scores of both image and text queries. Besides, SPGCM is inferior only to SCM and CCA-3V among supervised methods about 5% and 4% under protocol I and 1.5% and 1% under protocol II for average MAP. Even compared with JFSSL, the gap is acceptable. As shown in Fig. 2, SPGCM obtains the best performance over other four unsupervised methods on both image query and text query retrieval. Moreover, all methods obviously benefit from the more balanced training set due to the overall improved performances in protocol II to protocol I.
4.3
Baselines and Evaluation
SPGCM is compared with four unsupervised algorithms (i.e., CCA [Hardoon et al., 2004], Partial Least Squares (PLS) [Sharma and Jacobs, 2011], Bilinear Model (BLM) and U-CCA3V [Gong et al., 2014]) and six supervised algorithms (i.e., CCCA [Rasiwasia et al., 2014], GMMFA, GMLDA [Sharma et al., 2012], LCFS [Wang et al., 2013], Semantic Correlation Matching (SCM) [Costa Pereira et al., 2014], and CCA3V [Gong et al., 2014] and Joint Feature Selection and Subspace Learning (JFSSL) [Wang et al., 2015]). Especially, U-CCA3V is the unsupervised version of CCA3V, when topic indicator matrix is treated as semantic labels.
1743
Experiment Results
Dataset MAP(%100) Query CCA PLS BLM UCCA3V SPGCM GMLDA GMMFA LCFS CCCA SCM CCA3V JFSSL
Protocol I Image Text 24.25 19.52 21.82 17.57 23.53 17.99 26.23 20.72 26.95 21.12 25.50 19.87 26.03 21.29 26.63 20.89 23.52 18.56 27.75 22.89 27.96 22.03 -
Wiki Avg 21.88 19.70 20.76 23.47 24.04 22.68 23.66 23.76 21.04 25.32 24.99 -
Protocol II Image Text 25.12 19.86 24.38 19.43 25.65 20.29 27.00 21.26 28.47 22.29 26.46 20.17 27.42 21.66 27.64 21.35 24.76 19.62 28.72 22.77 28.70 22.55 30.63 22.75
Pascal VOC
Protocol I Image Text 25.26 21.25 31.78 23.29 27.03 21.38 35.12 27.70 30.80 23.99 26.20 19.69 33.36 24.85 25.09 20.54 30.73 24.24 36.07 28.01
Avg 22.49 21.90 22.97 24.13 25.38 23.32 24.54 24.50 22.19 25.74 25.62 26.69
Avg 23.26 27.54 24.21 31.41 27.39 22.95 29.10 22.82 27.48 32.04
Image 24.58 25.60 31.74 34.03 35.67 36.32 34.38 30.84 33.48 36.65 -
Protocol II Text 20.76 21.23 23.19 25.83 26.96 28.05 26.78 2440 27.71 29.40 -
Avg 22.67 23.42 27.47 29.93 31.32 32.19 30.58 27.62 30.59 33.03 -
Table 1: MAP comparisons on the Wiki and Pascal VOC datasets. CCA, PLS, BLM, UCCA-3V and our SPGCM are unsupervised with the rest being supervised methods. Besides, the MAP scores of JFSSL are reported in [Wang et al., 2015]. Regarding the VOC dataset, methods like CCA and SCM cannot cope with features whose covariance matrix is degenerate-rank while LCFS tries to do feature selection which is not suitable for dimension-reduced features. So we conduct two experiments on the VOC dataset with the source features dimension-reduced or unchangeable. The performances shown in Table. 1 indicate that our SPGCM is only inferior to the supervised JFSSL, and outperforms LCFS about 8% and GMLDA about 13% under protocol I. While for protocol I, SPGCM is just 5% lower than CCA-3V in average precision. SPGCM obtains the best performance over other four unsupervised methods on both image query retrieval and text query, as illustrated in Fig. 2. From the MAP scores obtained by two protocols, we can discover that unsupervised methods are more robust to the feature transformation which can be avoided due to the trivial preprocessing.
0.4
CCA
PLS
BLM
UCCA3V
CCA
SPGCM
0.4 0.38 0.36 0.34 0.32
BLM
UCCA3V
SPGCM
0.36
0.34
0.32
0.3
0.28
0.3 0.28
PLS
0.38
mean average precision
mean average precision
0.42
5
6
7
8
9
10
11
subspace dimension
12
13
14
15
0.26
5
6
(a) Image Query
7
8
9
10
11
subspace dimension
12
13
14
15
(b) Text Query
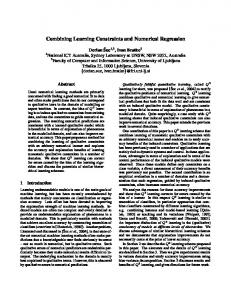
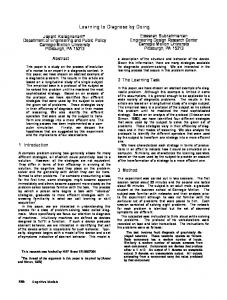
Figure 4: MAP scores versus subspace dimension c of different unsupervised subspace methods on the deep-Wiki dataset. 0.44 image query text query
0.42
mean average precision
4.4
0.44
Discussion
To investigate the cross-modal learning performance with deep and discriminative features, we further extract the 4,096dimensional CNN image features by Caffe [Jia et al., 2014] and 5,000-dimensional TF-IDF [Salton and Buckley, 1988] text features for Wiki, named as the deep-Wiki dataset. Here PCA is adopted to reduce the dimensions of original highdimensional features beforehand. Furthermore, we conduct two experiments to study the impacts of subspace dimension c and group number K, shown in Fig. 4 and Fig. 5. Obviously, our SPGCM achieves consistently better performances over other best-performing unsupervised subspace methods. Besides, SPGCM is more robust than CCA w.r.t subspace dimension. From Fig. 5, the prior group number K is quite important, however, when the group number varies near the number of actual semantic labels (i.e., 10), SPGCM outperforms well and steadily. Note that the highest MAP scores (i.e., 42.4% and 38.1%) obtained by SPGCM is comparable with that (42.8% and 39.6%) in [Wang et al., 2015]. Moreover, when the group number K grows much larger, the performance indeed degenerates to CCA as explained in Fig. 1.
0.40 0.38 0.36 0.34 0.32 0.30 0.28 0.26 0.24
//
4
5
6
7
8
9
10 11 12 13 group number
14
15
//
//
50 100 200 201
Figure 5: MAP scores versus cluster number K of SPGCM on the deep-Wiki dataset, horizontal dotted lines denote the best MAP scores among the rest unsupervised methods.
5
Conclusion
This paper has proposed an unsupervised method named SPGCM that takes both groupwise and pairwise correspondences into consideration to learn the latent common subspace. An iterative optimization procedure has been further proposed to minimize the problem with non-negative and orthogonal constraints. Experimental results illustrate that our SPGCM steadily outperforms other unsupervised crossmodal subspace learning methods. When the data distribution is balanced or data are depicted in deep discriminative features, the improved retrieval performance is highly competitive with the state-of-the-art supervised methods.
1744
Acknowledgments
[Liu et al., 2014] Wei Liu, Cun Mu, Sanjiv Kumar, and ShihFu Chang. Discrete graph hashing. In Proc. NIPS, pages 3419–3427, 2014. [Qian and Zhai, 2013] Mingjie Qian and Chengxiang Zhai. Robust unsupervised feature selection. In Proc. IJCAI, pages 1621–1627, 2013. [Rasiwasia et al., 2007] Nikhil Rasiwasia, Pedro J Moreno, and Nuno Vasconcelos. Bridging the gap: Query by semantic example. IEEE Transactions on Multimedia, 9(5):923–938, 2007. [Rasiwasia et al., 2010] Nikhil Rasiwasia, Jose Costa Pereira, Emanuele Coviello, Gabriel Doyle, Gert RG Lanckriet, Roger Levy, and Nuno Vasconcelos. A new approach to cross-modal multimedia retrieval. In Proc. MM, pages 251–260, 2010. [Rasiwasia et al., 2014] Nikhil Rasiwasia, Dhruv Mahajan, Vijay Mahadevan, and Gaurav Aggarwal. Cluster canonical correlation analysis. In Proc. AISTATS, pages 823–831, 2014. [Salton and Buckley, 1988] Gerard Salton and Christopher Buckley. Term-weighting approaches in automatic text retrieval. Information processing & management, 24(5):513–523, 1988. [Sharma and Jacobs, 2011] Abhishek Sharma and David W Jacobs. Bypassing synthesis: PLS for face recognition with pose, low-resolution and sketch. In Proc. CVPR, pages 593–600, 2011. [Sharma et al., 2012] Abhishek Sharma, Abhishek Kumar, Hal Daume III, and David W Jacobs. Generalized multiview analysis: A discriminative latent space. In Proc. CVPR, pages 2160–2167, 2012. [Tang et al., 2013] Jiliang Tang, Xia Hu, Huiji Gao, and Huan Liu. Unsupervised feature selection for multi-view data in social media. In Proc. SDM, pages 270–278, 2013. [Wang et al., 2013] Kaiye Wang, Ran He, Wei Wang, Liang Wang, and Tieniu Tan. Learning coupled feature spaces for cross-modal matching. In Proc. ICCV, pages 2088–2095, 2013. [Wang et al., 2015] Kaiye Wang, Ran He, Liang Wang, Wei Wang, and Tieniu Tan. Joint feature selection and subspace learning for cross-modal retrieval. IEEE Transactions on Pattern Analysis and Machine Intelligence, 2015. doi:10.1109/TPAMI.2015.2505311. [Yu et al., 2011] Shi Yu, L´eon-Charles Tranchevent, Bart De Moor, and Yves Moreau. Kernel-based data fusion for machine learning. Springer, 2011.
This work was supported by the National Basic Research Program of China (Grant No. 2012CB316300), the Youth Innovation Promotion Association of the Chinese Academy of Sciences (CAS) (Grant No. 2015190) and the National Natural Science Foundation of China (Grant No. 61473289).
References [Cai et al., 2013] Xiao Cai, Feiping Nie, and Heng Huang. Multi-view k-means clustering on big data. In Proc. AAAI, pages 2598–2604, 2013. [Chaudhuri et al., 2009] Sham M Chaudhuri, Kamalika a nd Kakade, Karen Livescu, and Karthik Sridharan. Multiview clustering via canonical correlation analysis. In Proc. ICML, pages 129–136, 2009. [Costa Pereira et al., 2014] Jose Costa Pereira, Emanuele Coviello, Gabriel Doyle, Nikhil Rasiwasia, Gert RG Lanckriet, Roger Levy, and Nuno Vasconcelos. On the role of correlation and abstraction in cross-modal multimedia retrieval. IEEE Transactions on Pattern Analysis and Machine Intelligence, 36(3):521–535, 2014. [Gong et al., 2014] Yunchao Gong, Qifa Ke, Michael Isard, and Svetlana Lazebnik. A multi-view embedding space for modeling internet images, tags, and their semantics. International Journal of Computer Vision, 106(2):210–233, 2014. [Han and Kim, 2015] Dongyoon Han and Junmo Kim. Unsupervised simultaneous orthogonal basis clustering feature selection. In Proc. CVPR, pages 5016–5023, 2015. [Hardoon et al., 2004] David R Hardoon, Sandor Szedmak, and John Shawe-Taylor. Canonical correlation analysis: An overview with application to learning methods. Neural Computation, 16(12):2639–2664, 2004. [He et al., 2015] Ran He, Man Zhang, Liang Wang, Ye Ji, and Qiyue Yin. Cross-modal subspace learning via pairwise constraints. IEEE Transactions on Image Processing, 24(12):5543–5556, 2015. [Horn and Johnson, 2012] Roger A Horn and Charles R Johnson. Matrix analysis. Cambridge University Press, 2012. [Hwang and Grauman, 2012] Sung Ju Hwang and Kristen Grauman. Reading between the lines: Object localization using implicit cues from image tags. IEEE Transactions on Pattern Analysis and Machine Intelligence, 34(6):1145– 1158, 2012. [Jia et al., 2014] Yangqing Jia, Evan Shelhamer, Jeff Donahue, Sergey Karayev, Jonathan Long, Ross Girshick, Sergio Guadarrama, and Trevor Darrell. Caffe: Convolutional architecture for fast feature embedding. arXiv preprint arXiv:1408.5093, 2014. [Liu et al., 2013] Jialu Liu, Chi Wang, Jing Gao, and Jiawei Han. Multi-view clustering via joint nonnegative matrix factorization. In Proc. SDM, volume 13, pages 252–260, 2013.
1745