International Journal of
Geo-Information Article
Gully Erosion Mapping and Monitoring at Multiple Scales Based on Multi-Source Remote Sensing Data of the Sancha River Catchment, Northeast China Ranghu Wang 1,2 , Shuwen Zhang 2, *, Luoman Pu 1,2 , Jiuchun Yang 2 , Chaobin Yang 2 , Jing Chen 1,3 , Cong Guan 1,2 , Qing Wang 1,2 , Dan Chen 1,2 , Bolin Fu 2 and Xuejia Sang 1 1
2
3
*
College of Earth Science, Jilin University, Changchun 130061, China;
[email protected] (R.W.);
[email protected] (L.P.);
[email protected] (J.C.);
[email protected] (C.G.);
[email protected] (Q.W.);
[email protected] (D.C.);
[email protected] (X.S.) Northeast Institute of Geography and Agroecology, Chinese Academy of Sciences, Changchun 130102, China;
[email protected] (J.Y.);
[email protected] (C.Y.);
[email protected] (B.F.) College of Arts & Sciences, Beijing Union University, Beijing 100191, China Correspondence:
[email protected]; Tel.: +86-431-8554-2246
Academic Editors: Jason K. Levy and Wolfgang Kainz Received: 19 July 2016; Accepted: 31 October 2016; Published: 4 November 2016
Abstract: This research is focused on gully erosion mapping and monitoring at multiple spatial scales using multi-source remote sensing data of the Sancha River catchment in Northeast China, where gullies extend over a vast area. A high resolution satellite image (Pleiades 1A, 0.7 m) was used to obtain the spatial distribution of the gullies of the overall basin. Image visual interpretation with field verification was employed to map the geometric gully features and evaluate gully erosion as well as the topographic differentiation characteristics. Unmanned Aerial Vehicle (UAV) remote sensing data and the 3D photo-reconstruction method were employed for detailed gully mapping at a site scale. The results showed that: (1) the sub-meter image showed a strong ability in the recognition of various gully types and obtained satisfactory results, and the topographic factors of elevation, slope and slope aspects exerted significant influence on the gully spatial distribution at the catchment scale; and (2) at a more detailed site scale, UAV imagery combined with 3D photo-reconstruction provided a Digital Surface Model (DSM) and ortho-image at the centimeter level as well as a detailed 3D model. The resulting products revealed the area of agricultural utilization and its shaping by human agricultural activities and water erosion in detail, and also provided the gully volume. The present study indicates that using multi-source remote sensing data, including satellite and UAV imagery simultaneously, results in an effective assessment of gully erosion over multiple spatial scales. The combined approach should be continued to regularly monitor gully erosion to understand the erosion process and its relationship with the environment from a comprehensive perspective. Keywords: gully erosion; high resolution satellite image; unmanned aerial vehicle; 3D photo-reconstruction; multiple spatial scales
1. Introduction Gully erosion is the process in which soil is removed according to the concentration of surface water and subsurface water in narrow flow paths, resulting in the formation of incised channels that may grow into gullies deeper than 30 cm over short time periods [1]. This causes significant soil loss and soil degradation, and it is generally considered as an indicator of desertification and land degradation [2]. Several studies proposed that gully erosion is the major soil erosion type in the black soil region of Northeast China, which suffered from severe soil erosion [3–5]. Despite being a natural ISPRS Int. J. Geo-Inf. 2016, 5, 200; doi:10.3390/ijgi5110200
www.mdpi.com/journal/ijgi
ISPRS Int. J. Geo-Inf. 2016, 5, 200
2 of 17
process, gully erosion is generally initiated and accelerated by inappropriate agricultural and human activities [6]. Gully erosion mapping is a crucial step to monitor land degradation and study its current and future local impacts. To date, numerous gully erosion studies have been performed at different scales and with different objectives [7]. For instance, gully location maps at the national scale [8] and gully risk map at regional scale have been obtained [9], the effect of topography on gully distributions [5] and the spatial variations of gully distributions over a large scale have been analyzed [10], gully networks have been defined for small catchments at a medium scale [11], and gully headcut retreat rates at a small scale have been estimated [12]. Various techniques have been applied for measuring, mapping and monitoring gully erosion accordingly. Compared with conventional techniques (e.g., ruler, tape, microtopographic profilers [13], poles, total stations [14], pins [15] and differential GPS [16,17]), which are time-consuming for achieving high accuracy in field surveys at a small scale, the development of remote sensing techniques has provided an efficient method to obtain spatially continuous gully information over large scales for different time periods. Classical aerial photography has been effectively employed for large-scale areas and long-term investigations, but with low spatial and temporal resolution [18,19]. Airborne LiDAR [20–22] and terrestrial laser scanner (TLS) [23–25] derive high resolution and precision data products for precise modeling of land surface. They offer the ability to measure gullies contactless with a high spatial resolution but require significant expertise. Analysis of satellite images integrated with field surveys has proven to be an effective and practical approach for mapping gully erosion over large areas [5]. However, the spatial resolution of satellite images in previous studies was mostly higher than 5 m, which results in omitting a considerable quantity of ephemeral gullies [26] and does not allow for a detailed analysis [27]. In addition, small changes of an individual gully within short time periods are difficult to identify using satellite images [27]. To increase ground resolution for the monitoring of short-term process, lower altitude unmanned aerial platforms, e.g., blimps or kites, are starting to be employed [28,29]. Unmanned Aerial Vehicles (UAVs) have integrated autopilot technology, which allows for semi- or fully autonomous navigation, flight control and image acquisition capabilities [30]. Researchers are beginning to explore the use of UAVs for the acquisition of remote sensing imagery and application in Earth surface analysis with a higher level of detail [31,32]. Several authors have already employed high resolution DSMs of cm-accuracy obtained from UAV-based imagery to monitor and quantify gully erosion [27,33,34]. Moreover, automatic 3D photo-reconstruction techniques have shown great advantages over traditional photogrammetry techniques by making image processing remarkably easier when images are derived from uncalibrated and nonmetric cameras [35]. Compared with laser scanners and rigorous photogrammetric methods, Structure-from-motion (SfM) and multi-view-stereo (MVS) algorithms, which are the generally proposed reconstruction methods, just use consumer-grade cameras and require less expertise [36,37]. Previous work has compared 3D photo-reconstruction with existing 2-D and 3-D field methods (e.g., LiDAR, laser profilometer, total station) for assessing gully erosion with regard to cost, accuracy and effectiveness, revealing the superiority of 3D photo-reconstruction [14,38]. By adopting 3D photo-reconstruction techniques, numerous researchers used images derived from UAV to generate high resolution topographic data and ortho-image for monitoring gully erosion [34,39]. It is still a major challenge in gully erosion research to develop and apply appropriate measuring techniques for monitoring or better understanding the initiation and change of various gully types at various spatial and temporal scales [40]. Most of the previous gully erosion studies were conducted at a single spatial scale. However, rare studies focused on the mapping and monitoring of gullies over multiple spatial scales which would contribute to a better understanding of gully erosion dynamics and their interact with change of gully environments from a comprehensive perspective [41]. This study aims to map and monitor gully erosion over multiple spatial scales using multi-source remote sensing data. High resolution satellite image visual interpretation with field verification was used to map gully
ISPRS Int. J. Geo-Inf. 2016, 5, 200 ISPRS Int. J. Geo‐Inf. 2016, 5, 200
3 of 17 17 of 17
geometric features and evaluate gully erosion at a catchment scale. UAV imagery combined with the UAV imagery combined with the 3D photo‐reconstruction method was employed for gully mapping 3Dat a site scale in further detail. photo-reconstruction method was employed for gully mapping at a site scale in further detail. 2. 2. Materials Materials 2.1.2.1. Study Area Study Area ◦ 80 49”E–126◦ 170 19”E, 44◦ 90 18”N–44◦ 220 20”N), including the middle and The study area (126 The study area (126°8′49″E–126°17′19″E, 44°9′18″N–44°22′20″N), including the middle and upper reaches of the Sancha River basin (Figure located in in Northeast NortheastChina China(Figure (Figure 1a,b), upper reaches of the Sancha River basin (Figure 1c), 1c), is is located 1a,b), 2 2 covering a total area of 163.83 km . . This area is situated at the southeastern edge of the black soil This area is situated at the southeastern edge of the black soil covering a total area of 163.83 km region (Figure 1b) and is covered by typical black soil, meadow soil, albic soil and dark brown soil. region (Figure 1b) and is covered by typical black soil, meadow soil, albic soil and dark brown soil. region a continental climate mean temperature annual temperature of 5.3 °C and annual TheThe region has ahas continental climate with a with meana annual of 5.3 ◦ C and annual precipitation precipitation of 550–600 mm. Long‐term human activities, especially excessive reclamation, resulted of 550–600 mm. Long-term human activities, especially excessive reclamation, resulted in a sloped in a sloped with little vegetation in to the area. Due to the substantial terrain farmland, withfarmland, little vegetation coverage in thecoverage area. Due the substantial terrain undulation, this undulation, this region has suffered from severe soil erosion by water. As one of the most critical and region has suffered from severe soil erosion by water. As one of the most critical and destructive water destructive water erosion types, gully erosion is widely distributed in this area. Hence, the study area erosion types, gully erosion is widely distributed in this area. Hence, the study area is one of the is one of the typical black soil erosion regions of Northeast China. typical black soil erosion regions of Northeast China.
Figure 1. Location of the study area: (a) map of Northeast China; (b) map of the study area, situated Figure 1. Location of the study area: (a) map of Northeast China; (b) map of the study area, situated at theat the southeastern edge of the black soil region; (c) overview of the study area with a detailed view southeastern edge of the black soil region; (c) overview of the study area with a detailed view of the survey site—the detailed RGB‐321 Pleiades‐1A image includes the River Sancha River theof survey site—the detailed RGB-321 Pleiades-1A satellitesatellite image includes the Sancha catchment (12 October (d) the investigated site was used for detailed mapping and the (12 catchment October 2013); and (d) 2013); and the investigated site was used for detailed mapping and the Ground Control Ground Control Points (GCPs) were distributed over the site. Points (GCPs) were distributed over the site.
ISPRS Int. J. Geo-Inf. 2016, 5, 200
4 of 17
ISPRS Int. J. Geo‐Inf. 2016, 5, 200 ISPRS Int. J. Geo‐Inf. 2016, 5, 200 ISPRS Int. J. Geo‐Inf. 2016, 5, 200 ISPRS Int. J. Geo‐Inf. 2016, 5, 200
17 of 17 17 of 17 17 of 17 17 of 17
2.2. Data Sources 2.2. Data Sources 2.2. Data Sources 2.2. Data Sources 2.2. Data Sources The sources of the remote sensing data included satellite imagery and UAV images. Area-wide The sources of the remote sensing data included satellite imagery and UAV images. Area‐wide The sources of the remote sensing data included satellite imagery and UAV images. Area‐wide gully mapping was based on Pleiades-1A imagery (panchromatic sharpened images at 0.7 m resolution The sources of the remote sensing data included satellite imagery and UAV images. Area‐wide The sources of the remote sensing data included satellite imagery and UAV images. Area‐wide gully mapping was based on on Pleiades‐1A imagery (panchromatic sharpened images at at 0.7 0.7 m m gully mapping was based Pleiades‐1A imagery (panchromatic sharpened images fused gully with 2.8 m multi-spectral bands). The image was acquired on 12 October 2013 (Figure 1c). mapping was based on on Pleiades‐1A imagery (panchromatic sharpened images at at 0.7 0.7 m m gully mapping was based Pleiades‐1A imagery (panchromatic sharpened images resolution fused with 2.8 m multi‐spectral bands). The image was acquired on 12 October 2013 resolution fused with 2.8 m multi‐spectral bands). The image was acquired on 12 October 2013 The geometric, radiometric and atmospheric corrections were performed byacquired the data provider, the resolution fused with 2.8 2.8 m multi‐spectral bands). The image was acquired on on 12 12 October 2013 resolution fused with m multi‐spectral bands). The image was October 2013 (Figure 1c). The geometric, radiometric and atmospheric corrections were performed by by the data (Figure 1c). The geometric, radiometric and atmospheric corrections were performed the data Jilin Province Geomatics Center. (Figure 1c). The geometric, radiometric and atmospheric corrections were performed by by the data (Figure 1c). The geometric, radiometric and atmospheric corrections were performed the data provider, the Jilin Province Geomatics Center. provider, the Jilin Province Geomatics Center. The UAV images were acquired in the airborne campaign, which was conducted in October provider, the Jilin Province Geomatics Center. provider, the Jilin Province Geomatics Center. The UAV images were acquired in the airborne campaign, which was conducted in October 2015 The UAV images were acquired in the airborne campaign, which was conducted in October 2015 2015 by using a battery-powered quadrocopter type Phantom 3 Professional (DJI, Shenzhen, China). The UAV images were acquired in the airborne campaign, which was conducted in October 2015 The UAV images were acquired in the airborne campaign, which was conducted in October 2015 by using a battery‐powered quadrocopter type Phantom 3 Professional (DJI, Shenzhen, China). The by using a battery‐powered quadrocopter type Phantom 3 Professional (DJI, Shenzhen, China). The The quadrocopter has four rotors, a weight of 1280 g and a maximum flight time of 23 min. The UAV by using a battery‐powered quadrocopter type Phantom 3 Professional (DJI, Shenzhen, China). The by using a battery‐powered quadrocopter type Phantom 3 Professional (DJI, Shenzhen, China). The quadrocopter has four rotors, a weight of 1280 g and a maximum flight time of 23 min. The UAV was quadrocopter has four rotors, a weight of 1280 g and a maximum flight time of 23 min. The UAV was was equipped with an integrated and stabilized camera. The sensor Sony EXMOR 1/2.3” was utilized quadrocopter has four rotors, a weight of 1280 g and a maximum flight time of 23 min. The UAV was quadrocopter has four rotors, a weight of 1280 g and a maximum flight time of 23 min. The UAV was equipped with an integrated and stabilized camera. The sensor Sony EXMOR 1/2.3″ was utilized for equipped with an integrated and stabilized camera. The sensor Sony EXMOR 1/2.3″ was utilized for for image acquisition. The detailed image acquisition workflow is described in Section 3.2. These UAV equipped with an integrated and stabilized camera. The sensor Sony EXMOR 1/2.3″ was utilized for equipped with an integrated and stabilized camera. The sensor Sony EXMOR 1/2.3″ was utilized for image acquisition. The detailed image acquisition workflow is described in Section 3.2. These UAV image acquisition. The detailed image acquisition workflow is described in Section 3.2. These UAV imagesimage acquisition. The detailed image acquisition workflow is described in Section 3.2. These UAV were used for detailed mapping at a small site. image acquisition. The detailed image acquisition workflow is described in Section 3.2. These UAV images were used for detailed mapping at a small site. images were used for detailed mapping at a small site. images were used for detailed mapping at a small site. Remote sensing data need to be supported and validated with ground truth data, which images were used for detailed mapping at a small site. Remote sensing data need to to be be supported and validated with ground truth data, which is is Remote sensing data need supported and validated with ground truth data, which sensing need to to be supported validated with ground truth data, which is is Remote sensing data need be supported and validated with ground truth data, which is achievedRemote through field data surveys. We attempted toand achieve the following goals through field achieved through field surveys. We attempted to to achieve the following goals through field achieved through field surveys. We attempted achieve the following goals through field achieved through field surveys. We attempted to to achieve the following goals through field achieved through field surveys. We attempted achieve the following goals through field investigation: (1) determine the gully interpretation signs (i.e., possible gully appearance, such as investigation: (1) (1) determine the gully interpretation signs (i.e., possible gully appearance, such as as investigation: determine the gully interpretation signs (i.e., possible gully appearance, such investigation: (1) (1) determine the gully interpretation signs (i.e., possible gully appearance, such as as investigation: determine the gully interpretation signs (i.e., possible gully appearance, such gully size and shape) in the Pleiades images; (2) verify the mapping accuracy and further correct gully size and shape) in in the Pleiades images; (2) (2) verify the mapping accuracy and further correct gully size and shape) the Pleiades images; verify the mapping accuracy and further correct size and shape) in in the Pleiades (2) verify the mapping accuracy further correct size and shape) the Pleiades images; (2) verify the mapping accuracy and further correct errors gully ofgully omission and commission; and (3)images; conduct an UAV airborne campaign andand install Ground errors of omission and commission; and (3) conduct an UAV airborne campaign and install Ground errors of omission and commission; and (3) conduct an UAV airborne campaign and install Ground errors of omission and commission; and (3) conduct an UAV airborne campaign and install Ground errors of omission and commission; and (3) conduct an UAV airborne campaign and install Ground Control Points (Figure 1d). According to the above goals, this study conducted field surveys in May Control Points (Figure 1d). According to the above goals, this study conducted field surveys in May Control Points (Figure 1d). According to the above goals, this study conducted field surveys in May Control Points (Figure 1d). According to the above goals, this study conducted field surveys in May Control Points (Figure 1d). According to the above goals, this study conducted field surveys in May and October 2015. Fieldwork was supported with the Jilin Continuously Operating Reference Station and October 2015. Fieldwork was supported with the Jilin Continuously Operating Reference Station and October 2015. Fieldwork was supported with the Jilin Continuously Operating Reference Station and October 2015. Fieldwork was supported with the Jilin Continuously Operating Reference Station and October 2015. Fieldwork was supported with the Jilin Continuously Operating Reference Station (JLCORS) installed at a Trimble device; the horizontal and vertical positioning accuracy of the device (JLCORS) installed at a Trimble device; the horizontal and vertical positioning accuracy of the device (JLCORS) installed at a Trimble device; the horizontal and vertical positioning accuracy of the device (JLCORS) installed at a Trimble device; the horizontal and vertical positioning accuracy of the device (JLCORS) installed at a Trimble device; the horizontal and vertical positioning accuracy of the device is better than 3 cm and 5 cm, respectively. The gullyThe interpretation signs in thesigns high-resolution satellite is is better than 3 cm and 5 cm, respectively. gully interpretation in in the high‐resolution better than 3 cm and 5 cm, respectively. The gully interpretation signs the high‐resolution better than 3 cm and 5 1). cm, respectively. The gully interpretation signs in in the high‐resolution is better than 3 cm and 5 To cm, respectively. The gully interpretation signs the high‐resolution imagesis were determined (Table verify the accuracy of the area-wide mapping, field validation satellite images were determined (Table 1). To verify the accuracy of the area‐wide mapping, field satellite images were determined (Table 1). To verify the accuracy of the area‐wide mapping, field satellite images were determined (Table 1). To verify the accuracy of the area‐wide mapping, field satellite images were determined (Table 1). To verify the accuracy of the area‐wide mapping, field work was conducted, and gullies located adjacent to the road were identified. validation work was conducted, and gullies located adjacent to the road were identified. validation work was conducted, and gullies located adjacent to the road were identified. validation work was conducted, and gullies located adjacent to the road were identified. validation work was conducted, and gullies located adjacent to the road were identified. Other important geographical condition data data (road, water, residential sites,sites, etc.) were alsoalso Other important geographical condition (road, water, residential etc.) were Other important geographical condition data (road, water, residential sites, etc.) were also Other important geographical condition data (road, water, residential sites, etc.) were also Other important geographical condition data (road, water, residential sites, etc.) were provided by the Jilin Province Geomatics Center. The Digital Elevation Model (DEM) of the 5-m pixel also provided by the Jilin Province Geomatics Center. The Digital Elevation Model (DEM) of the 5‐m pixel provided by the Jilin Province Geomatics Center. The Digital Elevation Model (DEM) of the 5‐m pixel provided by the Jilin Province Geomatics Center. The Digital Elevation Model (DEM) of the 5‐m pixel provided by the Jilin Province Geomatics Center. The Digital Elevation Model (DEM) of the 5‐m pixel size was produced using 1:10,000 scale topographical maps. size was produced using 1:10,000 scale topographical maps. size was produced using 1:10,000 scale topographical maps. size was produced using 1:10,000 scale topographical maps. size was produced using 1:10,000 scale topographical maps. Table 1.Table 1. Interpretation signs: four types of gully appearance in the high‐resolution satellite images Interpretation signs: four types of gully appearance in the high-resolution satellite images and Table 1. Interpretation signs: four types of gully appearance in the high‐resolution satellite images Table 1. Interpretation signs: four types of gully appearance in the high‐resolution satellite images Table 1. Interpretation signs: four types of gully appearance in the high‐resolution satellite images groundand ground photographs of the study area. photographs of the study area. and ground photographs of the study area. and ground photographs of the study area. and ground photographs of the study area. Types of Gully Types of Gully Appearance Appearance Appearance
Types of Gully Appearance Types of Gully Types of Gully Appearance
Ground Photos Ground Photos Ground Photos Ground Photos Ground Photos
Pleiades Images Pleiades Images Pleiades Images Pleiades Images Pleiades Images
Gully‐1: Gully‐1: Ephemeral gully Ephemeral gully Ephemeral gully Ephemeral gully
Gully-1: Ephemeral gully Gully‐1: Gully‐1:
Gully‐2: Small Gully‐2: Small
Gully‐2: Small Gully‐2: Small Gully-2: Small permanent gully permanent gully permanent gully permanent gully permanent gully
ISPRS Int. J. Geo-Inf. 2016, 5, 200
5 of 17
Table 1. Cont. ISPRS Int. J. Geo‐Inf. 2016, 5, 200 ISPRS Int. J. Geo‐Inf. 2016, 5, 200
Types of Gully Appearance ISPRS Int. J. Geo‐Inf. 2016, 5, 200 ISPRS Int. J. Geo‐Inf. 2016, 5, 200
Ground Photos
Pleiades Images
17 of 17 17 of 17 17 of 17 17 of 17
Gully‐3: Large Gully‐3: Large Gully-3: Large Gully‐3: Large Gully‐3: Large permanent gully permanent gully permanent gully
permanent gully permanent gully
Gully‐4: Ramified Gully‐4: Ramified
Gully‐4: Ramified Gully‐4: Ramified Gully-4: Ramified permanent gully permanent gully permanent gully permanent gully permanent gully
3. Methods 3. Methods 3. Methods 3. Methods 3. Methods 3.1. Pleiades‐1A Imagery for Area‐Wide Mapping 3.1. Pleiades‐1A Imagery for Area‐Wide Mapping 3.1. Pleiades‐1A Imagery for Area‐Wide Mapping 3.1. Pleiades‐1A Imagery for Area‐Wide Mapping 3.1. Pleiades-1A Imagery for Area-Wide Mapping Visual interpretation and vectorization were used to obtain gully distribution data of the study Visual interpretation and vectorization were used to obtain gully distribution data of the study Visual interpretation and vectorization were used to obtain gully distribution data of the study Visual interpretation and vectorization were used to obtain gully distribution data of the study Visual interpretation and vectorization were used to obtain gully distribution data of the study area. Table 1 shows four types of possible gullies in the high‐resolution satellite images and ground area. Table 1 shows four types of possible gullies in the high‐resolution satellite images and ground area. Table 1 shows four types of possible gullies in the high‐resolution satellite images and ground area. Table 1 shows four types of possible gullies in the high‐resolution satellite images and ground area. Table 1 shows four types of possible gullies in the high-resolution satellite images and ground photos of the study area. Gully‐1 is typical of ephemeral gullies, which generally have long narrow photos of the study area. Gully‐1 is typical of ephemeral gullies, which generally have long narrow photos of the study area. Gully‐1 is typical of ephemeral gullies, which generally have long narrow photos of the study area. Gully‐1 is typical of ephemeral gullies, which generally have long narrow photosstructures and occur on farmland. Ephemeral gullies are small channels eroded by concentrated flow of the study area. Gully-1 is typical of ephemeral gullies, which generally have long narrow structures and occur on farmland. Ephemeral gullies are small channels eroded by concentrated flow structures and occur on farmland. Ephemeral gullies are small channels eroded by concentrated flow structures and occur on farmland. Ephemeral gullies are small channels eroded by concentrated flow that can be be easily filled by by normal tillage, but reappear the same location by by additional runoff that can easily filled normal tillage, but reappear in the same location additional runoff structures and occur on farmland. Ephemeral gullies are small in channels eroded by concentrated flow that can easily filled normal tillage, but reappear the same location additional runoff that can be be easily filled by by normal tillage, but reappear in in the same location by by additional runoff events [2]. As Gully‐2 shows, the further developed linear gullies are much more deeply incised. The events [2]. As Gully‐2 shows, the further developed linear gullies are much more deeply incised. The that can be easily filled by normal tillage, but reappear in the same location by additional runoff events [2]. As Gully‐2 shows, the further developed linear gullies are much more deeply incised. The events [2]. As Gully‐2 shows, the further developed linear gullies are much more deeply incised. The channels are too deep and wide to level with ordinary farm tillage equipment and are referred to as eventschannels are too deep and wide to level with ordinary farm tillage equipment and are referred to as [2]. As Gully-2 shows, the further developed linear gullies are much more deeply incised. channels are too deep and wide to level with ordinary farm tillage equipment and are referred to as channels are too deep and wide to level with ordinary farm tillage equipment and are referred to as permanent gullies Gully‐3 represents larger and wider permanent gully, which the gully permanent gullies [2]. Gully‐3 represents a larger and wider permanent gully, in which the The channels are too deep[2]. and wide to level witha ordinary farm tillage equipment andin are referred to gully permanent gullies [2]. Gully‐3 represents a larger and wider permanent gully, which the gully permanent gullies [2]. Gully‐3 represents a larger and wider permanent gully, in in which the gully bottom is sparsely covered by plants. The gully headcut and steeper gully walls further decrease in bottom is sparsely covered by plants. The gully headcut and steeper gully walls further decrease in as permanent gullies [2]. Gully-3 represents a larger and wider permanent gully, in which the gully bottom is sparsely covered by plants. The gully headcut and steeper gully walls further decrease in bottom is sparsely covered by plants. The gully headcut and steeper gully walls further decrease in adjacent flat lands. Compared the single gully of of Gully‐3, a ramified gully system with adjacent flat lands. Compared with the single gully Gully‐3, a ramified gully system with bottomthe isthe sparsely covered by plants. The with gully headcut and steeper gully walls decrease in the the adjacent flat lands. Compared with the single gully Gully‐3, a further ramified gully system with the adjacent flat lands. Compared with the single gully of of Gully‐3, a ramified gully system with several branches can be observed in Gully‐4. Between the individual branches, smaller flat parts of several branches can be observed in Gully‐4. Between the individual branches, smaller flat parts of adjacent flat lands. Compared with the single gully of Gully-3, a ramified gully system with several several branches can be observed in Gully‐4. Between the individual branches, smaller flat parts of several branches can be observed in Gully‐4. Between the individual branches, smaller flat parts of the original surface remain, and have even been reclaimed. However, gullies in forests were not the the original surface remain, and have even been reclaimed. However, gullies in forests were not the branches can be observed in Gully-4. Between the individual branches, smaller flat parts of the original the original surface remain, and have even been reclaimed. However, gullies in forests were not the the original surface remain, and have even been reclaimed. However, gullies in forests were not the object of this study since these gullies are difficult to recognize from optical satellite images. object of this study since these gullies are difficult to recognize from optical satellite images. surfaceobject of this study since these gullies are difficult to recognize from optical satellite images. remain, and have even been reclaimed. However, gullies in forests were not the object of this object of this study since these gullies are difficult to recognize from optical satellite images. gullies are mainly discriminated the surfaces they incise according to to their spatial The gullies are mainly discriminated from the surfaces they incise according their spatial study sinceThe these gullies are difficult to recognizefrom from optical satellite images. The gullies are mainly discriminated from the surfaces they incise according their spatial The gullies are mainly discriminated from the surfaces they incise according to to their spatial characteristics, i.e., patterns (drainage), shape and size. However, the gullies are difficult to to characteristics, i.e., patterns (drainage), shape and size. However, the gullies are difficult The gullies are mainly discriminated fromshape the surfaces they incise according to their spatial characteristics, i.e., patterns (drainage), shape and size. However, the gullies are difficult characteristics, i.e., patterns (drainage), and size. However, the gullies are difficult to to differentiate from the surrounding environment based on the spectral properties because the spectral differentiate from the surrounding environment based on the spectral properties because the spectral characteristics, i.e., patterns (drainage), shape and size. However, the gullies are difficult to differentiate differentiate from the surrounding environment based on the spectral properties because the spectral differentiate from the surrounding environment based on the spectral properties because the spectral reflectance between gullies varies markedly over large areas [8,42]. Meanwhile, the spectral reflectance between gullies varies markedly over large areas [8,42]. Meanwhile, the spectral from the surrounding environment based onmarkedly the spectral properties because the spectral reflectance reflectance between gullies varies over large areas [8,42]. Meanwhile, the spectral reflectance between gullies varies markedly over large areas [8,42]. Meanwhile, the spectral properties of of gullies rely on on vegetation cover or or soil, but the spectral values of of the bare soil or or properties gullies rely vegetation cover soil, but the spectral values the bare soil between gullies varies markedly over large areas [8,42]. Meanwhile, the spectral properties of gullies properties gullies rely on vegetation cover soil, but the spectral values the bare soil properties of of gullies rely on vegetation cover or or soil, but the spectral values of of the bare soil or or vegetation within the gully may be the same as those outside. It is gratifying that the shadow cast by vegetation within the gully may be the same as those outside. It is gratifying that the shadow cast by rely onvegetation within the gully may be the same as those outside. It is gratifying that the shadow cast by vegetation cover or soil, but the spectral values of the bare soil or vegetation within the gully vegetation within the gully may be the same as those outside. It is gratifying that the shadow cast by the gully walls contribute to to the distinction of of gullies from their surroundings. Since the incident the gully walls contribute the distinction gullies from their surroundings. Since the incident may be the same as those outside. It is gratifying that the shadow cast bysurroundings. the gully walls contribute the gully walls contribute the distinction gullies from their Since the incident the gully walls contribute to to the distinction of of gullies from their surroundings. Since the incident angle of sunlight varies relatively from the landform surface, shadow cast is visible in high resolution angle of sunlight varies relatively from the landform surface, shadow cast is visible in high resolution angle of sunlight varies relatively from the landform surface, shadow cast is visible in high resolution to the angle of sunlight varies relatively from the landform surface, shadow cast is visible in high resolution distinction of gullies from their surroundings. Since the incident angle of sunlight varies optical satellite images for most gullies. The shadow of of the Sun‐diverted gully walls presents a a optical satellite images for most gullies. The shadow the Sun‐diverted gully walls presents optical satellite images for most gullies. The shadow of the Sun‐diverted gully walls presents optical images for most gullies. The the Sun‐diverted gully walls presents a a relatively fromsatellite the landform surface, shadow cast is shadow visible inof high resolution optical satellite images spectral contrast between the surroundings and the sunlit opposite gully walls [43]. For example, spectral contrast between the surroundings and the sunlit opposite gully walls [43]. For example, spectral contrast between the surroundings and the sunlit opposite gully walls [43]. For example, spectral contrast between the surroundings and the sunlit opposite gully walls [43]. For example, for most gullies. The shadow of the Sun-diverted gully walls presents a spectral contrast between the Gully‐2 is more discernible than Gully‐1 due to the shadowing. Accordingly, the shadow helps to Gully‐2 is more discernible than Gully‐1 due to the shadowing. Accordingly, the shadow helps to Gully‐2 is more discernible than Gully‐1 due to the shadowing. Accordingly, the shadow helps to Gully‐2 is more discernible than Gully‐1 due to the shadowing. Accordingly, the shadow helps to surroundings and the sunlit opposite gully walls [43]. For example, Gully-2 is more discernible than present the linear characteristics and shape of the gullies by highlighting their edges. In addition, the present the linear characteristics and shape of the gullies by highlighting their edges. In addition, the present the linear characteristics and shape of the gullies by highlighting their edges. In addition, the present the linear characteristics and shape of the gullies by highlighting their edges. In addition, the Gully-1 due to the shadowing. Accordingly, the shadow helps to present the linear characteristics and topographical map, hydrographical network map, traffic map and related information contribute to topographical map, hydrographical network map, traffic map and related information contribute to topographical map, hydrographical network map, traffic map and related information contribute to topographical map, hydrographical network map, traffic map and related information contribute to shape recognizing erosion gullies. ofrecognizing erosion gullies. the gullies by highlighting their edges. In addition, the topographical map, hydrographical recognizing erosion gullies. recognizing erosion gullies. network map, traffic map and related information contribute to recognizing erosion gullies. The gully vectorization was performed using ArcGIS 10.0 software. The gully distribution data The gully vectorization was performed using ArcGIS 10.0 software. The gully distribution data The gully vectorization was performed using ArcGIS 10.0 software. The gully distribution data The gully vectorization was performed using ArcGIS 10.0 software. The gully distribution data The gully vectorization was performed using ArcGIS 10.0 software. The gully distribution data included gully length and area. Gullies with width less than 3 pixels were only outlined for length, included gully length and area. Gullies with width less than 3 pixels were only outlined for length, included gully length and area. Gullies with width less than 3 pixels were only outlined for length, included gully length and area. Gullies with width less than 3 pixels were only outlined for length, included gully length and area. Gullies with widthresult, less than 3gully pixels were only outlined for length, notand not area. According to to the field validation the data were modified. The omitted not area. According the field validation result, the gully data were modified. The omitted and not area. According the field validation result, the gully data were modified. The omitted and not area. According to to the field validation result, the gully data were modified. The omitted and committed gullies were included and excluded, respectively. Then, the final gully distribution data committed gullies were included and excluded, respectively. Then, the final gully distribution data committed gullies were included and excluded, respectively. Then, the final gully distribution data committed gullies were included and excluded, respectively. Then, the final gully distribution data were obtained. In the overall assessment and validation of gully erosion, gullies were not classified. were obtained. In the overall assessment and validation of gully erosion, gullies were not classified. were obtained. In the overall assessment and validation of gully erosion, gullies were not classified. were obtained. In the overall assessment and validation of gully erosion, gullies were not classified. To assess gully erosion comprehensively, the indicators of gully density and intensity were adopted. To assess gully erosion comprehensively, the indicators of gully density and intensity were adopted. To assess gully erosion comprehensively, the indicators of gully density and intensity were adopted. To assess gully erosion comprehensively, the indicators of gully density and intensity were adopted.
ISPRS Int. J. Geo-Inf. 2016, 5, 200
6 of 17
area. According to the field validation result, the gully data were modified. The omitted and committed gullies were included and excluded, respectively. Then, the final gully distribution data were obtained. In the overall assessment and validation of gully erosion, gullies were not classified. To assess gully erosion comprehensively, the indicators of gully density and intensity were adopted. Gully density within the study area was defined as the total gully length per area of the whole study area. The gully density distribution was estimated by using the Focal Statistics tool in ArcGIS. The specific steps are as follows: (1) a fishnet polygon containing cells of 5 m × 5 m was created, then the total length per area of each cell was calculated and a value was assigned to the corresponding cell; (2) the polygon was converted into a grid with a 5-m pixel size; and (3) Focal Statistics was applied to calculate the average value of each input cell within a rectangular neighborhood of 100 m × 100 m; thus, the distribution map of gully density was obtained. Similarly, gully intensity was calculated by using the measurement of total gully area per area. Furthermore, the topographic differentiation of gully erosion was analyzed using the DEM and the zonal statistics tool in ArcGIS. 3.2. UAV-Based Remote Sensing for Detailed Mapping A small study site (Figure 1d) in the Sancha River catchment was selected for detailed mapping using UAV, as it includes typical gullies (for example, Gully-4) and is located near the road. The image acquisition workflow is as follows: Firstly, Ground Control Points (GCPs) were distributed over the chosen study site prior to the airborne campaign (Figure 1d). The GCPs were installed and precisely measured with JLCORS, as well as used for georeferencing during further image processing. The geographic coordinate system and projection were set to China Geodetic Coordinate System 2000 (CGCS 2000) and Gauss Kruger, respectively. Secondly, the UAV was operated in the field by a trained operator and controlled autonomously by the autopilot software DJI GO (DJI, Shenzhen, China) and Pix4Dcapture (Pix4d, Lausanne, Switzerland) to follow predefined flight plans for imagery acquisition during takeoff, flight and landing. The flight plans were designed for longitudinal overlap of 80% and lateral overlap of 60% to avoid gaps between single photographs and ensure successful photo-reconstruction. The lens of the camera was set in the 90-degree position, and the flying height was set at 120 m above the ground for the duration of the imaging process. As one of the main aims of this research, the ortho-image mosaic and Digital Surface Model (DSM) were generated through the 3D photo-reconstruction method by new photogrammetry software in an automated way. 3D reconstruction using structure-from-motion (SfM) and multi-view stereo (MVS) techniques was performed for surface geomorphometry reconstruction to generate 3D data from a series of non-calibrated images. In general, the reconstruction workflow includes the processing steps: (1) identification of homologous image points and consequent image matching; (2) reconstruction of the image acquisition configuration, including camera orientation, position and internal camera parameters, as well as corresponding 3D coordinates, with an iterative bundle block adjustment (BBA); and (3) dense matching of the sparse point cloud by forward intersections in space [34,36,44]. In this study, the commercial photogrammetry software, Pix4DMapper (Pix4D, Lausanne, Switzerland), based on SfM and MVS techniques, was used to automatically generate an ortho-mosaic and DSM. In addition, although each image was recorded with the synchronized GPS position of low accuracy, high-precision GCPs were necessary to be included into the processing by manually adding additional tie points and using an automated tie point generation program within Pix4dmapper software. As an important gully indicator, the volume was calculated based on previous studies [27,33]. The 3D polyline of the gully edge was used to create a 3D polygon. We assumed that the previous surface was completely flat between the current gully edges, so the polygon was then transformed to a raster of the original former surface prior to erosion. The gully DSM was further subtracted. The resulting raster contained the height difference between the state before incision and the current state for each raster cell. These values were then multiplied with the raster resolution and summed up, resulting in the gully volume. The calculation of the gully volume was conducted in ArcGIS software, and the method was described in detail by d’Oleire-Oltmanns et al. [27] and Peter et al. [33].
ISPRS Int. J. Geo-Inf. 2016, 5, 200
7 of 17
4. Results 4.1. Spatial Distribution of Erosion Gullies in the Catchment According to visual interpretation of very high resolution satellite images, the status of gully erosion in the whole catchment area was obtained. The statistical results of gully erosion are shown in Table 2. In 2013, there were 1190 erosion gullies in the study area, among which 572 (nearly half of the total) were erosion gullies, with width less than 3 pixels. This result indicated that the gully erosion is still relatively active in the study area. We assumed that these narrow gullies would further develop with intensified erosion without any prevention. The gully density of the whole area was 1.37 km/km2 (gully length per unit area) and the gully intensity was 5434.84 m2 /km2 (gully area per unit area). The total gully area and length were 89.039 hm2 and 224.978 km, respectively. According to the standard for classification and gradation of soil erosion (SL190-2007) issued by the Ministry of Water Resources of China, the gully density of the whole area was classified as slight erosion. Table 2. Status of gully erosion in the Sancha River catchment. Numbers of Gullies
The Total Length (km)
The Total Area (hm2 )
Gully Density of Whole Area (km/km2 )
Gully Intensity of Whole Area (m2 /km2 )
1190
224.978
89.039
1.37
5434.84
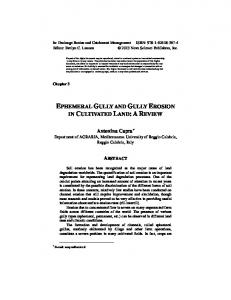
Figure 2 displays the spatial distribution of gully erosion across the Sancha River catchment. Figure 2a illustrates that gullies are widespread across the catchment, especially in the northeastern part. Figure 2b,c shows that the gully density and gully intensity ranged from 0 to 71.99 km/km2 and from 0 to 792,896 m2 /km2 , respectively. The results all indicate that gully erosion in the northeastern part was most serious. However, there are differences between the spatial distribution of gully density and intensity. The high gully intensity generally indicates that the lateral erosion of the gully erosion is significant, which results in notable widening of ditch sides and an increase in the area.
Figure 2. Cont.
ISPRS Int. J. Geo-Inf. 2016, 5, 200 ISPRS Int. J. Geo‐Inf. 2016, 5, 200
8 of 17 17 of 17
Figure 2. The distribution map of: (a) erosion gullies; (b) gully density; and (c) gully intensity in the Figure 2. The distribution map of: (a) erosion gullies; (b) gully density; and (c) gully intensity in the study area. study area.
In the field validation work (Table 3), 20 gullies were observed and later recorded by JLCORS. In the field validation work (Table 3), 20 gullies were observed and later recorded by JLCORS. The indoor study showed that 18 gullies were captured correctly, while a roadside gully was omitted The indoor study showed that 18 gullies were captured correctly, while a roadside gully was omitted and another field path was mistaken for an ephemeral gully. Nevertheless, the overall accuracy of and another field path was mistaken for an ephemeral gully. Nevertheless, the overall accuracy of gully interpretation reached 90%, and the very high resolution (sub‐meter) satellite image showed a gully interpretation reached 90%, and the very high resolution (sub-meter) satellite image showed a strong ability in the detection of various gully types. strong ability in the detection of various gully types. Table 3. Field validation results. Table 3. Field validation results. Validated Gullies Correct Validated Gullies 20 Correct18
20
18
False Accuracy of Visual Interpretation 2 False 90% of Visual Interpretation Accuracy
2
4.2. High‐Resolution Ortho‐Image Mosaic and DSM of a Small Site
90%
A total number of 256 JPEG photos were acquired during the field airborne campaign; 255 out 4.2. High-Resolution Ortho-Image Mosaic and DSM of a Small Site of 256 images were calibrated (99%) and all images were enabled. The ortho‐image mosaic (Figure 3) A total number of 256 JPEG photos were acquired during the field airborne campaign; 255 out of and DSM (Figure 4) were generated for the small study site, covering a total of 13.85 ha. The average 256 images were calibrated (99%) and all images were enabled. The ortho-image mosaic (Figure 3) and ground sampling distance (GSD) of pixels was 4.42 cm. Forty installed GCPs were used for ground DSM (Figure 4) were generated for the small study site, covering a total of 13.85 ha. The average ground control. The root mean square errors (RMSE) of the GCPs were between 0.026 and 0.016 m in the sampling distance (GSD) of pixels Fortydirection. installed GCPs were used for ground control. horizontal directions, and 0.024 was m in 4.42 the cm. vertical A total of 2,622,204 2D keypoint The root mean and square errors3D (RMSE) the used GCPsfor were 0.026 adjustment, and 0.016 mwhile in thethe horizontal observations 899,037 points of were the between bundle block mean reprojection error was evaluated at approximately 0.26 pixel. Table 4 shows the summary of these directions, and 0.024 m in the vertical direction. A total of 2,622,204 2D keypoint observations and outputs for the results obtained in Pix4dmapper software using automatic mode. 899,037 3D points were used for the bundle block adjustment, while the mean reprojection error was The resulting ortho‐image mosaics and DSM reveal the area of agricultural utilization and its evaluated at approximately 0.26 pixel. Table 4 shows the summary of these outputs for the results shaping human agricultural and water erosion in detail. The maize straws with obtained inby Pix4dmapper software activities using automatic mode. accumulation on the flat farmland are visible along with landfill within the headcut. The cultivated The resulting ortho-image mosaics and DSM reveal the area of agricultural utilization and itsland in the bottom of the gully is even distinguishable. In addition, the depression of existing gully shaping by human agricultural activities and water erosion in detail. The maize straws with erosion is highly visible. In addition to the three main gullies, a roadside gully and small rills are accumulation on the flat farmland are visible along with landfill within the headcut. The cultivated
ISPRS Int. J. Geo‐Inf. 2016, 5, 200
17 of 17
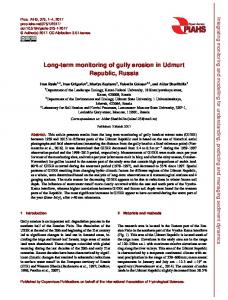
visible. In Figure 4, the light blue part illustrates the lowest area at the Wadi bottom. However, the maximum incision depth of the gullies reaches 10.32 m in the upper leftmost main gully (i.e., Gully‐ ISPRS Int. J. Geo-Inf. 2016, 5, 200 4 mentioned above). The gully volumes were calculated as 68,145 m3, 12,240 m3 and 5405 m3 for the 9 of 17 three main gullies (from north to south in Figure 4, respectively). Meanwhile, a precise and comprehensive 3D model of the gullies was calculated (Figure 5). The enlarged inset shows the 3D land in the bottom of the gully is even distinguishable. In addition, the depression of existing gully structure of the gully sidewall and headcut in detail. The results shown in Figures 3–5 illustrate the erosion is highly addition to thethe three main gullies, a roadside gully and small rillsphoto‐ are visible. high degree visible. of detail Inachievable with method of UAV‐based remote sensing and 3D In Figure 4, the light blue part illustrates the lowest area at the Wadi bottom. However, the maximum reconstruction.
incision depth of the gullies reaches 10.32 m in the upper leftmost main gully (i.e., Gully-4 mentioned Table 4. Summary of the outputs obtained in Pix4dmapper. above). The gully volumes were calculated as 68,145 m3 , 12,240 m3 and 5405 m3 for the three main gullies (fromImagery and Resolution north to south in Figure 4, respectively). Meanwhile, a precise and comprehensive 3D Georeferencing Bundle Block Adjustment Number of Mean of the gully model of the gullies was calculated (Figure 5). The enlarged inset shows the 3D structure Images Area covered GSD Number RMSE (X/Y/Z) Number of 2D keypoint reprojection calibrated (ha) (cm) of GCPs in (m) 3D points sidewall and headcut in detail. The results shown in Figures 3–5 illustrate the high degree of detail observations error (pixels) achievable with of UAV-based sensing and 3D photo-reconstruction. 255 the method 13.85 4.42 40 remote 0.026/0.016/0.024 2,622,204 899,037 0.26
Figure 3. Orthorectified image mosaic of the small study site (31 October 2015). Darker areas within Figure 3. Orthorectified image mosaic of the small study site (31 October 2015). Darker areas the gully system are are withered vegetation. The main gully in the in northern section section is Gully‐4, as within the gully system withered vegetation. The main gully the northern is Gully-4, mentioned above. as mentioned above.
Table 4. Summary of the outputs obtained in Pix4dmapper. Imagery and Resolution Area Images covered calibrated (ha) 255
13.85
Georeferencing
Bundle Block Adjustment
GSD (cm)
Number of GCPs
RMSE (X/Y/Z) in (m)
Number of 2D keypoint observations
Number of 3D points
Mean reprojection error (pixels)
4.42
40
0.026/0.016/0.024
2,622,204
899,037
0.26
ISPRS Int. J. Geo-Inf. 2016, 5, 200 ISPRS Int. J. Geo‐Inf. 2016, 5, 200 ISPRS Int. J. Geo‐Inf. 2016, 5, 200
10 of 17 17 of 17 17 of 17
Figure 4. Digital Surface Model (DSM) of the small study site. It was applied by hill‐shading. Figure 4. Digital Surface Model (DSM) of the small study site. It was applied by hill‐shading. Figure 4. Digital Surface Model (DSM) of the small study site. It was applied by hill-shading.
Figure 5. (a–c). 3D model of the small study site (c). The blue (a); and red (b) enlarged insets show the Figure 5. (a–c). 3D model of the small study site (c). The blue (a); and red (b) enlarged insets show the Figure 5. (a–c). 3D model of the small study site (c). The blue (a); and red (b) enlarged insets show the 3D structure of the gully sidewall and headcut in detail, respectively. 3D3D structure of the gully sidewall and headcut in detail, respectively. structure of the gully sidewall and headcut in detail, respectively.
ISPRS Int. J. Geo‐Inf. 2016, 5, 200
17 of 17
ISPRS Int. J. Geo-Inf. 2016, 5, 200
11 of 17
5. Discussion 5. Discussion 5.1. Visual Pleiades Imagery Interpretation for Gully Erosion Mapping
The Pleiades imagery displayed high feasibility the recognition of various gully types, 5.1. Visual Pleiades Imagery Interpretation for Gully Erosion for Mapping especially ephemeral gullies in this study (e.g., Gully‐1 in Table 1). However, with the enhancement The Pleiades imagery displayed high feasibility for the recognition of various gully types, of satellite image resolution, the phenomena of “noise” and “different objects with the same especially ephemeral gullies in this study (e.g., Gully-1 in Table 1). However, with the enhancement of spectrum” as well as “the same objects with different spectra” increase [45]. In the present study, a satellite image resolution, the phenomena of “noise” and “different objects with the same spectrum” small farm path was easily mistaken for an ephemeral gully because their spectral characteristics and as well as “the same objects with different spectra” increase [45]. In the present study, a small farm path geomorphological structures were similar in the Pleiades imagery. Meanwhile, it is difficult to was easily mistaken for an ephemeral gully because their spectral characteristics and geomorphological distinguish narrow roadside gullies from the road, as they were too similar to be differentiated from structures were similar in the Pleiades imagery. Meanwhile, it is difficult to distinguish narrow roadside the imagery. Nevertheless, the obtained interpretation result was satisfactory due to the high gullies from the road, as they were too similar to be differentiated from the imagery. Nevertheless, the accuracy (Table 3). However, achieving the satisfactory result was time consuming and required a obtained interpretation result was satisfactory due to the high accuracy (Table 3). However, achieving certain expertise. According to previous studies, with respect to high spatial resolution satellite the satisfactory result was time consuming and required a certain expertise. According to previous images (such as Pleiades‐1A), although the visual interpretation of gully erosion with field studies, with respect to high spatial resolution satellite images (such as Pleiades-1A), although the verification achieved much higher accuracies [8,46], (semi‐)automatic mapping of gullies at a regional visual interpretation of gully erosion with field verification achieved much higher accuracies [8,46], scale or larger scales showed great potential for obtaining a general statement of the distribution of (semi-)automatic mapping of gullies at a regional scale or larger scales showed great potential for gullies to a wider extent [43,47,48]. obtaining a general statement of the distribution of gullies to a wider extent [43,47,48]. The higher spatial resolution of satellite images made it possible to identify gullies with complex The higher spatial resolution of satellite images made it possible to identify gullies with complex surroundings as well as with a wide range of factors that control the development and distribution surroundings as well as with a wide range of factors that control the development and distribution of gully erosion [49,50]. The topographic differentiation characteristics of gully erosion at a large scale of gully erosion [49,50]. The topographic differentiation characteristics of gully erosion at a large were obvious (see Figure 6). Figure 6a illustrates a layered distribution of gully erosion in the vertical scale were obvious (see Figure 6). Figure 6a illustrates a layered distribution of gully erosion in direction. This result indicates that the slope land between geomorphic types of lower elevations (e.g., the vertical direction. This result indicates that the slope land between geomorphic types of lower valley plain) and higher elevations (e.g., hill) is more conducive to the formation and development elevations (e.g., valley plain) and higher elevations (e.g., hill) is more conducive to the formation and of gully erosion due to a longer slope and larger catchment area [5]. Figure 6b shows that gully development of gully erosion due to a longer slope and larger catchment area [5]. Figure 6b shows density and intensity all increase first and then decrease as the slope increases. Although the steeper that gully density and intensity all increase first and then decrease as the slope increases. Although slope will increase the shear force of the soil particles [51], the slope is not the main factor restricting the steeper slope will increase the shear force of the soil particles [51], the slope is not the main factor the form of erosion gully, which was more affected by slope length, catchment area, slope shape and restricting the form of erosion gully, which was more affected by slope length, catchment area, slope other terrain factors [52] when the slope was greater than six degrees. The relation between slope shape and other terrain factors [52] when the slope was greater than six degrees. The relation between aspect and gully erosion was analyzed (Figure 6c). The results indicate that the gully erosion on slope aspect and gully erosion was analyzed (Figure 6c). The results indicate that the gully erosion windward slopes (S, SSW, SW, WSW, and W) was greater than on leeward slopes because the on windward slopes (S, SSW, SW, WSW, and W) was greater than on leeward slopes because the prevailing southwest winds result in stronger rainfall erosivity on windward slopes than on leeward prevailing southwest winds result in stronger rainfall erosivity on windward slopes than on leeward slopes. Furthermore, the difference between gully density and intensity on various terrain factors slopes. Furthermore, the difference between gully density and intensity on various terrain factors should be given further consideration. should be given further consideration.
Figure 6. Cont.
ISPRS Int. J. Geo-Inf. 2016, 5, 200 ISPRS Int. J. Geo‐Inf. 2016, 5, 200
12 of 17 17 of 17
Figure 6. Topographic differentiation of gully erosion: (a) elevation; (b) slope; and (c) slope aspect. Figure 6. Topographic differentiation of gully erosion: (a) elevation; (b) slope; and (c) slope aspect.
5.2. Assessment of UAV Remote Sensing and 3D Reconstruction 5.2. Assessment of UAV Remote Sensing and 3D Reconstruction Numerous studies studies already already illustrated illustrated that that the the low-altitude low‐altitude UAV UAV photogrammetry photogrammetry and and 3D 3D Numerous photo‐reconstruction method showed the definite advantage in the achievable detail with very high photo-reconstruction method showed the definite advantage in the achievable detail with very resolution [27,34,39,53]. The extremely detailed measurements were were generally obtained on a on sub‐ high resolution [27,34,39,53]. The extremely detailed measurements generally obtained a decimeter level, which is comparable to TLS [14]. TLS is often used as high quality reference spatial sub-decimeter level, which is comparable to TLS [14]. TLS is often used as high quality reference spatial dataset toto assess different field methods for measuring gully due to its high dataset assess different field methods for measuring gully erosion dueerosion to its high accuracy [54,55]. accuracy [54,55]. In this study, accurate TLS or LiDAR are unavailable. In other words, the spatially In this study, accurate TLS or LiDAR are unavailable. In other words, the spatially continuous precise continuous precise ground truth data are unavailable as a reference for the chosen study site. Thus, ground truth data are unavailable as a reference for the chosen study site. Thus, the traditional accuracy the traditional accuracy assessment is impossible, as already illustrated by Harwin and Lucieer [56]. assessment is impossible, as already illustrated by Harwin and Lucieer [56]. This study used the This study used the high‐precision GCPs as independent checkpoints to assess the accuracy automatically high-precision GCPs as independent checkpoints to assess the accuracy automatically (see Table 4) (see Table 4) and the same assessment method is also applied by d’Oleire‐Oltmanns et al. [27]. Therefore, and the same assessment method is also applied by d’Oleire-Oltmanns et al. [27]. Therefore, the the resulting accuracy of the derived products is considered to be reliable. Note that the obtained resulting accuracy of the derived products is considered to be reliable. Note that the obtained value value the gully should volume not should not be asregarded a precise absolute erosion amount. The for the for gully volume be regarded a preciseas absolute erosion amount. The quantification quantification values obtained at multiple periods should be a good estimation of the magnitude of values obtained at multiple periods should be a good estimation of the magnitude of erosion-induced erosion‐induced change [34]. Moreover, the manual digitizing of the gully edge influences the accuracy of the volumes and defining the location of the gully edge still remains a challenge [57].
ISPRS Int. J. Geo-Inf. 2016, 5, 200
13 of 17
change [34]. Moreover, the manual digitizing of the gully edge influences the accuracy of the volumes 17 of 17 the gully edge still remains a challenge [57].
ISPRS Int. J. Geo‐Inf. 2016, 5, 200 and defining the location of
5.3. Comparison and Combination of Satellite Imagery and UAV Remote Sensing 5.3. Comparison and Combination of Satellite Imagery and UAV Remote Sensing Even though the very high resolution Pleiades-1A satellite imagery has significantly improved Even though the very high resolution Pleiades‐1A satellite imagery has significantly improved the identification of gully erosion, it does not allow for a more detailed analysis of an individual the identification of gully erosion, it does not allow for a more detailed analysis of an individual gully gully compared with UAV imagery. For instance, of corn straw mulch bufferwithin withinthe thegully gully compared with UAV imagery. For instance, the the use use of corn straw mulch buffer headcut is is aa simple gully prevention measure in sloping farmland in thein black soil region headcut simple and and common common gully prevention measure in sloping farmland the black soil of Northeast China [58]. Pleiades-1A with 0.7 m does not provide more detailed information about the region of Northeast China [58]. Pleiades‐1A with 0.7 m does not provide more detailed information corn straws within the gully headcut. However, the corn straw mulch is visible in the ortho-image about the corn straws within the gully headcut. However, the corn straw mulch is visible in the ortho‐ derived from UAV (0.042 m) (Figure 7). According to the enlarged view of the UAV image (the lower image derived from UAV (0.042 m) (Figure 7). According to the enlarged view of the UAV image (the right of Figure 7), we can see the vegetation in the bottom clearly, and even distinguish the active gully lower right of Figure 7), we can see the vegetation in the bottom clearly, and even distinguish the headcut, which was eroding the farmland. active gully headcut, which was eroding the farmland.
Figure 7. Comparison of the satellite image (12 October 2013; left) and UAV image (31 October Figure 7. Comparison of the satellite image (12 October 2013; left) and UAV image (31 October 2015; 2015; right). right).
In addition to the gully length and width, the gully volume is also an important factor for the In addition to the gully length and width, the gully volume is also an important factor for the determination determinationof ofsediment sedimentyield yieldfrom fromgully gully erosion. erosion. The Thevery veryhigh highresolution resolutionDSM DSMderived derivedfrom from UAV‐based remote sensing sensing and photo‐reconstruction for quantification gully UAV-based remote and 3D3D photo-reconstruction was was used used for quantification of gullyof volumes volumes in detail (Figure 4). In contrast, the resolution of the available DEM, i.e., 5 m × 5 m resolution, in detail (Figure 4). In contrast, the resolution of the available DEM, i.e., 5 m × 5 m resolution, is too is too coarse and not does not this allow this degree of Meanwhile, detail. Meanwhile, it is difficult to gully extract gully coarse and does allow degree of detail. it is difficult to extract volumes volumes from the single Pleiades imagery, and stereoscopic Pleiades images are not available in this study. In addition, the 3D model provided more details about the 3D structure of the gully sidewall and headcut (Figure 5), but 3D information was lacking in the Pleiades image. The high resolution and precision of the data products derived from UAV enable detailed 2D and 3D analysis, which is not possible at the satellite scale level.
ISPRS Int. J. Geo-Inf. 2016, 5, 200
14 of 17
from the single Pleiades imagery, and stereoscopic Pleiades images are not available in this study. In addition, the 3D model provided more details about the 3D structure of the gully sidewall and headcut (Figure 5), but 3D information was lacking in the Pleiades image. The high resolution and precision of the data products derived from UAV enable detailed 2D and 3D analysis, which is not possible at the satellite scale level. The previous gully mapping and monitoring studies were generally conducted at a single spatial scale to achieve a certain goal. Meanwhile, the data types achieved from different scales were too complex to be integrated properly. However, UAV-based remote sensing provides a valuable intermediate scale between the satellite scale and field scale [27]. The UAV-based remote sensing data can provide detailed 2D and 3D analysis of an individual gully at a small site scale, which is not possible at the satellite scale level. The satellite image can provide the surrounding environment of the individual gully. The obtained distribution data of various types of gullies at a large scale can be used for analyzing how the topographic factors control the formation and development of gully erosion. The two sources of remote sensing data can compare and complement each other at multiple scales. Although gully erosion mapping and monitoring were conducted at a single time in this study, small changes of an individual gully within short time periods can already be monitored by applying short term UAS-based remote sensing [34]. In addition, the regional variation of the spatial distribution of erosion gullies over decades can also be analyzed by using satellite images [10]. The combined approach will be continued to become a regular monitoring for gully erosion. Numerous gully erosion studies around the world have been performed to monitor or better understand the initiation and development of various gully types at various temporal and spatial scales [4,7,20,27,34]. Compared with a single scale, the approach based on multi-source remote sensing data over multiple scale levels to combine the very detailed field scale and the larger scale level can help to elucidate the erosion process and its relationship with the environment at different spatial and temporal scales from a comprehensive perspective. 6. Conclusions The present study was one of the first to attempt to map and monitor gully erosion over multiple scales by combining satellite and UAV imagery. At the catchment scale, the sub-meter images show strong ability in the recognition of various gully types and obtained satisfactory results. The gully distribution of the whole Sancha River catchment was derived, and the topographic differentiation characteristics of gully erosion over a large scale suggested that the gully erosion was stronger on windward sunny slopes than on leeward slopes and mainly occurred at middle elevations. When the slope was greater than six degrees, the slope was not the main factor restricting gully erosion. At a more detailed site scale, UAV imagery combined with 3D photo-reconstruction provided DSM and ortho-image data at a centimeter level as well as a 3D model. The resulting products revealed the area of agricultural utilization and its shaping by human agricultural activities and water erosion in detail and also provided the gully volume. However, detailed 2D and 3D analysis were lacking at the satellite scale level. Using the Sancha River catchment as the study area, we illustrated that using multi-source remote sensing data, including satellite and UAV imagery simultaneously, results in an effective assessment of gully erosion over multiple scales. The combined mapping approach will be continued to regularly monitor the area and aid in further understanding the erosion process and its relationship with the environment from a comprehensive perspective. The work offers guidance for policy makers to develop sustainable comprehensive soil and water conservation management plans in the study area. Acknowledgments: This research was funded by the National Natural Science Foundation of China (No. 41271416; 41301467, and 41601458) and the Project 2016213 supported by the Graduate Innovation Fund of Jilin University. The authors would like to thank the Jilin Province Geomatics Center and its director Zheng Wang for their support with the fieldwork.
ISPRS Int. J. Geo-Inf. 2016, 5, 200
15 of 17
Author Contributions: Ranghu Wang, Shuwen Zhang and Jiuchun Yang designed the research; Ranghu Wang and Luoman Pu processed and analyzed the satellite data; Ranghu Wang, Luoman Pu, Chaobin Yang, Jing Chen, Cong Guan, Qing Wang and Dan Chen collected the UAV data; Ranghu Wang and Xuejia Sang completed the 3D reconstruction; and Ranghu Wang wrote the paper and Bolin Fu assisted the revision. Conflicts of Interest: The authors declare no conflict of interest.
References 1. 2. 3.
4. 5.
6. 7.
8. 9. 10. 11.
12. 13. 14. 15. 16. 17. 18. 19.
20. 21.
Luffman, I.E.; Nandi, A.; Spiegel, T. Gully morphology, hillslope erosion, and precipitation characteristics in the Appalachian Valley and Ridge province, southeastern USA. Catena 2015, 133, 221–232. [CrossRef] Poesen, J.; Nachtergaele, J.; Verstraeten, G.; Valentin, C. Gully erosion and environmental change: Importance and research needs. Catena 2003, 50, 91–133. [CrossRef] Liu, B.; Yan, B.; Shen, B.; Wang, Z.; Wei, X. Current status and comprehensive control strategies of soil erosion for cultivated land in the northeastern black soil area of China. Sci. Soil Water Conserv. 2008, 6, 1–8. (In Chinese) Hu, G.; Wu, Y.; Liu, B.; Yu, Z.; You, Z.; Zhang, Y. Short-term gully retreat rates over rolling hill areas in black soil of Northeast China. Catena 2007, 71, 321–329. [CrossRef] Zhang, S.; Li, F.; Li, T.; Yang, J.; Bu, K.; Chang, L.; Wang, W.; Yan, Y. Remote sensing monitoring of gullies on a regional scale: A case study of Kebai region in Heilongjiang Province, China. Chin. Geogr. Sci. 2015, 25, 602–611. [CrossRef] Kakembo, V.; Rowntree, K.M. The relationship between land use and soil erosion in the communal lands near Peddie town, Eastern Cape, South Africa. Land Degrad. Dev. 2003, 14, 39–49. [CrossRef] Gomez-Gutierrez, A.; Conoscenti, C.; Angileri, S.E.; Rotigliano, E.; Schnabel, S. Using topographical attributes to evaluate gully erosion proneness (susceptibility) in two Mediterranean basins: Advantages and limitations. Nat. Hazards 2015, 79, S291–S314. [CrossRef] Roux, N.M.; Le, J.J. Gully location mapping at a national scale for South Africa. S. Afr. Geogr. J. 2012, 94, 208–218. Eustace, A.H.; Pringle, M.J.; Denham, R.J. A risk map for gully locations in central Queensland, Australia. Eur. J. Soil Sci. 2011, 62, 431–441. [CrossRef] Yan, Y.C.; Zhang, S.W.; Yue, S.P. Application of corona and spot imagery on erosion gully research in typical black soil regions of Northeast China. Resour. Sci. 2006, 27, 650–656. (In Chinese) Perroy, R.L.; Bookhagen, B.; Asner, G.P.; Chadwick, O.A. Comparison of gully erosion estimates using airborne and ground-based LiDAR on Santa Cruz Island, California. Geomorphology 2010, 118, 288–300. [CrossRef] Wu, Y.; Zheng, Q.; Zhang, Y.; Liu, B.; Cheng, H.; Wang, Y. Development of gullies and sediment production in the black soil region of Northeastern China. Geomorphology 2008, 101, 683–691. [CrossRef] Casali, J.; Loizu, J.; Campo, M.A.; De Santisteban, L.M.; Alvarez-Mozos, J. Accuracy of methods for field assessment of rill and ephemeral gully erosion. Catena 2006, 67, 128–138. [CrossRef] Castillo, C.; Perez, R.; James, M.R.; Quinton, J.N.; Taguas, E.V.; Gomez, J.A. Comparing the accuracy of several field methods for measuring gully erosion. Soil Sci. Soc. Am. J. 2012, 76, 1319–1332. [CrossRef] Ionita, I. Gully development in the Moldavian Plateau of Romania. Catena 2006, 68, 133–140. [CrossRef] Wu, Y.; Cheng, H. Monitoring of gully erosion on the Loess Plateau of China using a global positioning system. Catena 2005, 63, 154–166. [CrossRef] Hu, G.; Wu, Y.Q.; Liu, B.Y.; Zhang, Y.G.; You, Z.M.; Yu, Z.T. The characteristics of gully erosion over rolling hilly black soil areas of Northeast China. J. Geogr. Sci. 2009, 19, 309–320. [CrossRef] Vandekerckhove, L.; Poesen, J.; Govers, G. Medium-term gully headcut retreat rates in Southeast Spain determined from aerial photographs and ground measurements. Catena 2003, 50, 329–352. [CrossRef] Bouchnak, H.; Felfoul, M.S.; Boussema, M.R.; Snane, M.H. Slope and rainfall effects on the volume of sediment yield by gully erosion in the Souar lithologic formation (Tunisia). Catena 2009, 78, 170–177. [CrossRef] James, L.A.; Watson, D.G.; Hansen, W.F. Using LiDAR data to map gullies and headwater streams under forest canopy: South Carolina, USA. Catena 2007, 71, 132–144. [CrossRef] Jackson, T.J.; Ritchie, J.C.; White, J.; Leschack, L. Airborne laser profile data for measuring ephemeral gully erosion. Photogramm. Eng. Remote Sens. 1988, 54, 1181–1185.
ISPRS Int. J. Geo-Inf. 2016, 5, 200
22. 23.
24. 25.
26. 27. 28. 29. 30.
31.
32. 33.
34. 35. 36. 37. 38. 39. 40. 41.
42. 43.
16 of 17
Armston, J.; Disney, M.; Lewis, P.; Scarth, P.; Phinn, S.; Lucas, R.; Bunting, P.; Goodwin, N. Direct retrieval of canopy gap probability using airborne waveform LiDAR. Remote Sens. Environ. 2013, 134, 24–38. [CrossRef] Goodwin, N.R.; Armston, J.; Stiller, I.; Muir, J. Assessing the repeatability of terrestrial laser scanning for monitoring gully topography: A case study from Aratula, Queensland, Australia. Geomorphology 2016, 262, 24–36. [CrossRef] Kociuba, W.; Janicki, G.; Rodzik, J. 3D laser scanning as a new tool of assessment of erosion rates in forested loess gullies (case study: Kolonia Celejów, Lublin Upland). Ann. UMCS 2014, 69, 107–116. [CrossRef] Kociuba, W.; Kubisz, W.; Zagorski, P. Use of terrestrial laser scanning (TLS) for monitoring and modelling of geomorphic processes and phenomena at a small and medium spatial scale in polar environment (Scott River—Spitsbergen). Geomorphology 2014, 212, 84–96. [CrossRef] Li, H.; Zhang, X.; Liu, S.; Yury, K.; Kateryna, I.; Li, X.; Chen, Q. Evolvement of gully erosion in village scale in the typical black soil area. Sci. Soil Water Conserv. 2012, 10, 21–28. (In Chinese) D’Oleire-Oltmanns, S.; Marzolff, I.; Peter, K.D.; Ries, J.B. Unmanned aerial vehicle (UAV) for monitoring soil erosion in Morocco. Remote Sens.-Basel 2012, 4, 3390–3416. [CrossRef] Marzolff, I.; Poesen, J. The potential of 3d gully monitoring with GIS using high-resolution aerial photography and a digital photogrammetry system. Geomorphology 2009, 111, 48–60. [CrossRef] Ries, J.B.; Marzolff, I. Monitoring of gully erosion in the Central Ebro Basin by large-scale aerial photography taken from a remotely controlled blimp. Catena 2003, 50, 309–328. [CrossRef] Hugenholtz, C.H.; Whitehead, K.; Brown, O.W.; Barchyn, T.E.; Moorman, B.J.; LeClair, A.; Riddell, K.; Hamilton, T. Geomorphological mapping with a small unmanned aircraft system (sUAS): Feature detection and accuracy assessment of a photogrammetrically-derived digital terrain model. Geomorphology 2013, 194, 16–24. [CrossRef] Haas, F.; Hilger, L.; Neugirg, F.; Umstädter, K.; Breitung, C.; Fischer, P.; Hilger, P.; Heckmann, T.; Dusik, J.; Kaiser, A. Quantification and analysis of geomorphic processes on a recultivated iron ore mine on the Italian island Elba using long-time ground-based LiDAR and photogrammetric data by an UAV. Nat. Hazards Earth Syst. Sci. 2015, 3, 6271–6319. [CrossRef] D’Oleire-Oltmanns, S.; Eisank, C.; Dragut, L.; Blaschke, T. An object-based workflow to extract landforms at multiple scales from two distinct data types. IEEE Geosci. Remote Sens. 2013, 10, 947–951. [CrossRef] Peter, K.D.; d’Oleire-Oltmanns, S.; Ries, J.B.; Marzolff, I.; Hssaine, A.A. Soil erosion in gully catchments affected by land-levelling measures in the Souss Basin, Morocco, analysed by rainfall simulation and UAV remote sensing data. Catena 2014, 113, 24–40. [CrossRef] Stocker, C.; Eltner, A.; Karrasch, P. Measuring gullies by synergetic application of UAV and close range photogrammetry—A case study from Andalusia, Spain. Catena 2015, 132, 1–11. [CrossRef] Snavely, N.; Seitz, S.M.; Szeliski, R. Photo tourism: Exploring photo collections in 3D. ACM Trans. Graph. 2006, 25, 835–846. [CrossRef] Furukawa, Y.; Ponce, J. Accurate, dense, and robust multiview stereopsis. IEEE Trans. Pattern Anal. Mach. Intell. 2007, 32, 1362–1376. [CrossRef] [PubMed] Castillo, C.; James, M.R.; Redelmacías, M.D.; Pérez, R.; Gómez, J.A. SF3M software: 3-D photo-reconstruction for non-expert users and its application to a gully network. Soil 2015, 1, 583–594. [CrossRef] Gomez-Gutierrez, A.; Schnabel, S.; Berenguer-Sempere, F.; Lavado-Contador, F.; Rubio-Delgado, J. Using 3D photo-reconstruction methods to estimate gully headcut erosion. Catena 2014, 120, 91–101. [CrossRef] Eltner, A.; Baumgart, P.; Maas, H.G.; Faust, D. Multi-temporal UAV data for automatic measurement of rill and interrill erosion on loess soil. Earth Surf. Process. Landf. 2015, 40, 741–755. [CrossRef] Poesen, J. Challenges in gully erosion research. Landf. Anal. 2011, 17, 5–9. Smith, M.W.; Vericat, D. From experimental plots to experimental landscapes: Topography, erosion and deposition in sub-humid badlands from structure-from-motion photogrammetry. Earth Surf. Process. Landf. 2015, 40, 1656–1671. [CrossRef] King, C.; Baghdadi, N.; Lecomte, V.; Cerdan, O. The application of remote-sensing data to monitoring and modelling of soil erosion. Catena 2005, 62, 79–93. [CrossRef] D’Oleire-Oltmanns, S.; Marzolff, I.; Tiede, D.; Blaschke, T. Detection of gully-affected areas by applying object-based image analysis (OBIA) in the region of Taroudannt, Morocco. Remote Sens.-Basel 2014, 6, 8287–8309. [CrossRef]
ISPRS Int. J. Geo-Inf. 2016, 5, 200
44.
45. 46. 47.
48. 49. 50. 51. 52. 53.
54. 55.
56. 57. 58.
17 of 17
Eltner, A.; Kaiser, A.; Castillo, C.; Rock, G.; Neugirg, F.; Abellan, A. Image-based surface reconstruction in geomorphometry–merits, limits and developments of a promising tool for geoscientists. Image 2015, 3, 1445–1508. [CrossRef] Wang, Q.; Xu, J.; Chen, Y.; Li, J.; Wang, X. Influence of the varied spatial resolution of remote sensing images on urban and rural residential information extraction. Resour. Sci. 2012, 34, 159–165. (In Chinese) Shruthi, R.B.V.; Kerle, N.; Jetten, V.; Abdellah, L.; Machmach, I. Quantifying temporal changes in gully erosion areas with object oriented analysis. Catena 2015, 128, 262–277. [CrossRef] Wang, T.; He, F.H.; Zhang, A.D.; Gu, L.J.; Wen, Y.M.; Jiang, W.G.; Shao, H.B. A quantitative study of gully erosion based on object-oriented analysis techniques: A case study in Beiyanzikou catchment of Qixia, Shandong, China. Sci. World J. 2014, 2014, 417325. [CrossRef] [PubMed] Hughes, A.O.; Prosser, I.P. Gully erosion prediction across a large region: Murray-Darling Basin, Australia. Soil Res. 2012, 50, 267–277. [CrossRef] Mousazadeh, F.; Salleh, K.O. The influence of lithology and soil on the occurrence and expansion of gully erosion, Toroud Basin—Iran. Procedia Soc. Behav. Sci. 2014, 120, 749–756. [CrossRef] Mousazadeh, F.; Salleh, K.O. Factors controlling gully erosion development in Toroud Basin—Iran. Procedia Soc. Behav. Sci. 2014, 120, 506–512. [CrossRef] Ranzi, R.; Le, T.H.; Rulli, M.C. A RUSLE approach to model suspended sediment load in the Lo river (Vietnam): Effects of reservoirs and land use changes. J. Hydrol. 2012, 422–423, 17–29. [CrossRef] Wang, W.; Zhang, S.; Fang, H. Coupling mechanism of slope-gully erosion in typical black soil area of Northeast China. J. Nat. Resour. 2012, 27, 2113–2122. (In Chinese) Mancini, F.; Dubbini, M.; Gattelli, M.; Stecchi, F.; Fabbri, S.; Gabbianelli, G. Using unmanned aerial vehicles (UAV) for high-resolution reconstruction of topography: The structure from motion approach on coastal environments. Remote Sens.-Basel 2013, 5, 6880–6898. [CrossRef] Hofle, B.; Griesbaum, L.; Forbriger, M. GIS-based detection of gullies in terrestrial LiDAR data of the Cerro llamoca peatland (Peru). Remote Sens.-Basel 2013, 5, 5851–5870. [CrossRef] Kociuba, W.; Janicki, G.; Rodzik, J.; Stepniewski, K. Comparison of volumetric and remote sensing methods (TLS) for assessing the development of a permanent forested loess gully. Nat. Hazards 2015, 79, S139–S158. [CrossRef] Harwin, S.; Lucieer, A. Assessing the accuracy of georeferenced point clouds produced via multi-view stereopsis from unmanned aerial vehicle (UAV) imagery. Remote Sens.-Basel 2012, 4, 1573–1599. [CrossRef] Evans, M.; Lindsay, J. High resolution quantification of gully erosion in upland peatlands at the landscape scale. Earth Surf. Process. Landf. 2010, 35, 876–886. [CrossRef] Wen, L.; Zheng, F.; Shen, H.; Gao, Y. Effects of corn straw mulch buffer in the gully head on gully erosion of sloping cropland in the black soil region of Northeast China. J. Sediment. Res. 2014, 6, 73–80. (In Chinese) © 2016 by the authors; licensee MDPI, Basel, Switzerland. This article is an open access article distributed under the terms and conditions of the Creative Commons Attribution (CC-BY) license (http://creativecommons.org/licenses/by/4.0/).