The Mamu Formation overlies the Nkporo Shale without evidence of break in sediment. The type locality is along Mamu River in Enugu area of eastern Nigeria.
OKEREKE / International Journal of Engineering Research and Applications (IJERA) ISSN: 2248-9622 www.ijera.com Vol. 2, Issue 3, May-Jun 2012, pp.1955-1967
Mapping Gully Erosion Using Remote Sensing Technique: A Case Study Of Okigwe Area, Southeastern Nigeria OKEREKE, C. N.,ONU, N.N., AKAOLISA,C.Z.,IKORO,D.O., IBENEME,S.I.,UBECHU,B.(MRS), CHINEMELU,E.S. .(MRS) & AMADIKWA,L.O. GEOSCIENCES RESEARCH TEAM, DEPARTMENT OF GEOSCIENCES, FEDERAL UNIVERSITY OF TECHNOLOGY, OWERRI, IMO STATE, NIGERIA
Abstract The study area – Okigwe and its environs, Southeastern Nigeria is located on latitudes 5 045 ́ N-6000 ́ N and longitudes 7015 E ́ -7030 E ́ . The aim of the study is to integrate the remote sensing data of the study area, identify the drainage and lineament patterns/trends and their relationship and contribution to the development of gully erosion in the study area. Gully erosion is the most obvious form of soil erosion in southeastern Nigeria mainly because of the remarkable impressions the gullies make which are also visible manifestation of the physical loss of land due to erosion. These gullies are described in terms of shape (U and V-shaped), dimension and size (small, medium and large). The gullies are mainly U-shaped with depths varying from 3.5m to 400m, widths between 4.2m and 5,700m and lengths between 32m and 7,100m. The very great depths of these gullies and the failure of some control measures strongly suggest that they may result from interplay of exogenic and endogenic forces. Here, the landsat thermatic Mapper TM data of parts of Okigwe was studied with the objective of identifying the structures associated with the area and to infer their influence on gully erosion initiation and propagation. The landsat TM data was processed using ILWIS 3.2 Academic and ERDAS softwares. Results obtained from the structural analysis revealed numerous lineaments at several parts of the satellite image. The Rose diagram showed that the strikes and lengths of the observed lineaments were in two dominant structural trends, that is, in the NE-SW and NW-SW directions. The Digital Elevation Model (DEM) and NDVI data revealed a correlation of low values with areas of high gully erosion susceptibility. There is also a relationship between the drainage, lineament density and gully erosion in the study area. Finally, a correlation was found to exist between the lineament trend and the strike directions of most erosion gullies in the area indicating structural control of gully initiation in the area. Key words: Gully erosion, Okigwe area, lineament, drainage, structural analysis, structural trends
1. Introduction Soil erosion is the physical removal of materials (soil particles) from one place to another. It is an accelerated process under which soil is bodily displaced and transported away faster than it can be formed. Soil erosion is caused by the action of water and wind. Rain striking the ground helps to break soil particles loose and then runoff carry away loosened soil. Soil erosion agents can also be anthropogenic factors. Erosion physically removes materials (soil) in place after weathering (breakdown of rock or mineral materials) have broken them down into smaller pieces which are movable. Soil erosion starts with rainfall droplets dislodging particles of soil, removing them and eventually depositing them at a new location different from the original site. The erosion problems of an area is subjected to certain factors which include the geology, land use act, geomorphology, climate, soil texture, nature and bio diversity of the area. It constitutes the major ecological problems in the south eastern states of Nigeria. Imo State has the fifth highest concentration of active gully sites in Nigeria. Gully erosion is however the most prominent feature in the landscape of Imo State and every community in the State has a tale of woe as a result of ever increasing gullies. Gully erosion is a highly visible form of soil erosion or an antecedent of the removal of soil by running water that affects soil productivity, restricts land use and can threaten roads, fences and buildings. According to Feliciano (2008), gully erosion is an incised cut step sided channel, with an eroding head cut and slumping sidewalls. Gully itself is a relatively deep vertical walled channel recently formed within alley where no well defined channel previously existed (Beths, 1993). These develop because of a decrease in the erosion resistance of the land surface or increase in the erosion forces acting on the land surface. As water channeled across unprotected land, it washes away the soil along the drainage lines.
1955 | P a g e
OKEREKE / International Journal of Engineering Research and Applications (IJERA) ISSN: 2248-9622 www.ijera.com Vol. 2, Issue 3, May-Jun 2012, pp.1955-1967 The aim of the study is to integrate the remote sensing data of the study area, identify the drainage and lineament patterns/trends and their relationship and contribution to the development of gully erosion in the study area. Southeastern Nigeria is a typical erosion region in the country. The presence of gully sites is one of the hazardous features that characterize Imo State and several other eastern states adjoining it (Ofomata,1985). A conservative assessment shows the distribution of known gully sites in different stages of development as follows, Abia (300), Anambra (700), Ebonyi (250),Enugu (600),Imo (450) (Igbokwe et al (2003) and Egboka (2004)). However, investigations carried out by Egboka and Nwankwo (1982) have shown that the primary causes of gully genesis and growth in the area lies in the hydrogeological and geotechnical properties of the complex aquifer system underlying the areas. The high hydrostatic pressure in the aquifer produces a reduction in the effective strength of the unconsolidated lease sands in the walls of the gullies leading to intense erosion. The erosion is followed by mass movements and sediment removal by flood flows.
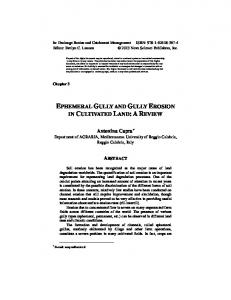
1.2 Geology Of The Study Area The study area – Okigwe area, Southeastern Nigeria is located on latitudes 5 045 N ́ -6000 N ́ 0 0 and longitudes 7 15 ́ E-7 30 ́ E and with an altitude of about 300m and above. Soils of the area are derived from false bedded sandstones (Ajali Formation) of the Maastrichtian geologic era and proximal to the upper coal measures (Nsukka Formation) of the Danvan geologic era. Okigwe has humid tropical climate, having a mean annual rainfall of 2250mm and a mean annual temperature range of 270-280C (FEDALR, 1985). Orographic rainfall is common in the area occupying over 25km2 land area, and the windward side of hills receive more rainfall than the leeward landscape. It has a sparsely vegetated shrubby rainforest with windward portions of hills having taller and varied plant species occurring in district tiers. The Mamu Formation overlies the Nkporo Shale without evidence of break in sediment. The type locality is along Mamu River in Enugu area of eastern Nigeria. The Mamu Formation contains a distinctive assemblage of shale, mudstone and shaly sand, with coal-seams at several horizons. The sandstones which are fine to medium grained and white or yellow in colour are normally well-bedded, although cross-bedding may be seen in places. The shale and mudstone
Fig. 1: Geological map of study area
1956 | P a g e
OKEREKE / International Journal of Engineering Research and Applications (IJERA) ISSN: 2248-9622 www.ijera.com Vol. 2, Issue 3, May-Jun 2012, pp.1955-1967 are dark blue or gray and grade into sandstones (Reyment,1964). The shale frequently alternate with thin band and lenses of sandstone to form a characteristic striped rock. The intercalated shale are of marine origin with a lot of ammonities (Reyment,1964). Carbonaceous material is present in varying amounts and occurs at streak on the bedding or the sandstones or as irregular ramifications. Gray mudstones with scattered plant impression grade into highly carbonaceous shale. Thin lenses of shaly coal occur at numerous horizons. The different rock types alternate with another in beds which are few centimeters to several metres thick. Ajali Sandstone overlies the Mamu Formation. The type locality is at Ajali River in Enugu area. The higher slope of the Enugu escarpment consist of Ajali sandstone with thickness of about 450 meters (Reyment, 1965). The formation continues into the former Idoma and Igala division where it also forms the higher slopes of the escarpment and underlies a considerable stretch of country further west. It underlies a belt of country on the dip-slope of Awgu Cuesta (Reyment, 1965). In the southern part of the Mamu river, the formation thins rapidly, until over the axis of the Anticlinorium (Reyment, 1962). The thickness is only about 200 metres at Uturu in Abia State, Nigeria. On the south eastern limb of the Afikpo syncline, the Ajali Sandstone cap the ridge between Nguru and Arochukwu (Kogbe 1975, Reyment 1962). The Ajali Sandstone consist of thick friable, poorly sorted sandstone, typically white in colour, but sometimes iron stained (Reyment, 1962). A marked banding of coarse and fine layers is displayed. The sand grain and fragment are sub-angular, with a sparse cement made up of white clay. It is overlain by considerable thickness of red earth, which consist of red sands, formed by the weathering and ferroginisation of the shale occur at intervals, increasing in number toward the base (Reyment,1965). Adeleye and Dessauvagie (1970), reported the presence of marine fossils (mostly gastropods and oysters) of probably Maestrichtian age. The Ajali Sandstone was deposited during a regressive phase. The type locality of the Nsukka Formation is Nadu River, 14km north of Nsukka in southeastern Nigeria. The formation was formally known as the Upper Coal Measures (Tattam, 1944, Reyment and Barber, 1956). It is overlain by the Palaeocene Imo shale and lies conformably on the Ajali Sandstone in southeastern Nigeria. There is a broad stretch as far as the west of the Udi plateau. In the Okigwe division of south-eastern Nigeria, the basal beds dip at 3° to 4° towards west or south west and form the line of prominent hills along the eastern margin of the outcrop. The basal bed are also exposed in the upper reaches of the south-westerly flowing tributaries of the Imo river. The Nsukka Formation transgresses directly into the Precambriam in the Okitipupa area of western Nigeria. In the Okitipupa area, the Nsukka Formation consist of sandstone, shale, occasional calcareous sandstone and sandy shale with plant remains. Thin coal seams have been found in a tributary of Owan river. Throughout Nsukka, Udi and Awgu area, the lithology of the formation consist of an alternating succession of sandstone, dark shale and sandy shale, with thin coal seams in places. In these areas the basal sandstone of Nsukka Formation has a thickness of about 15m. In Okigwe area, the Nsukka Formation has no coal present but consist of medium to coarse grained yellow sandstone with bands of shale and sandy shale. There is thin band of limestone which outcrops south of the Okigwe-Owerri road. The basal beds consist of coarse-to-fine grained sandstone which dip 30 to 40 towards west or southwest. The section in the Enem river along Uturu road comprises one decimeter of fossilferous limestone interbedded with sandstone, shale and sandy shale. The beds are mainly coarse ferroginised sandstone and sometimes cross bedded. The Nsukka Formation is about 350 metres thick. There are bands of limestone which occur toward the top of the Nsukka Formation. The limestone contain oyster shells and veinella undata (corad), which suggests an upper Cretaceous age (Reyment, 1965). The Nsukka Formation consist of deposit of proto-Niger delta, which advanced rapidly southward in the Anambra basin and the Afikpo syncline (Kogbe,1975). The formation ranges from Maestrichtian to probably lower Palaeocene and was deposited during a transgressive phase (Kogbe, Calvez, Mehes, Salami, 1975). Hence, the Nsukka Formation is underlain by the Ajali Sandstone. The Campano Maastrichtian in south eastern Nigeria begins with dark gray, often friable, shales with occasional thin beds of limestone and sandstone. This part of the sequence belongs to the Nkporo Formation, the Owelli Sandstone, Enugu shale and Asata shale are lateral equivalents of the Nkporo Formation. These inner basin sediments are all of shallow water origin and there are frequent sharp face changes. The broad, shallow sea gradually swallowed further and coal-accumulating conditions resulted. The basal part of the coal measure sequence, previously known as the “Lower Coal Measures” but now known as the Mamu Formation contains marine intercalations composed of ammoniferous shales (Rayment, 1964). The coal being part of the sequence consists of predominantly fresh water and low salinity sandstones, shales, mudstones and sandy shales, coal seams occur at several levels. Excellent
1957 | P a g e
OKEREKE / International Journal of Engineering Research and Applications (IJERA) ISSN: 2248-9622 www.ijera.com Vol. 2, Issue 3, May-Jun 2012, pp.1955-1967 exposures of the Mamu Formation can be seen along the Enugu Onitsha road at the Milliken Hill just on the outskirts of Enugu. The Mamu Formation overlain by the Ajali Formation with its type locality along the valley of the Ajali River near Enugu. This formation was previously known as the false Bedded sandstone and consist of thick friable, poorly sorted sandstones typically white in colour but sometimes iron-stained. A marked bordering of coarse and fine layers is displaced. The sand grains and large fragments are sub angular, with a sparse cement of white clay. Large scale, cross bedding is characteristic, the Ajali Formation consists of thin bands of white mudstone and shale occurring at intervals and increasing in number towards the base. The Ajali Formation is often overlain by a considerable thickness of red earth which consists of red, earthy sands formed by the weathering and ferruginisation of the formation. The Imo Formation consists of thick clayey shale, fine textured, dark grey to bluish grey with occasional admixture of clay and stone and thin band carbonized plant remains may be locally common and the formation becomes more sandy towards the top where it may consist of an alternation of bands of sandstone and shale.
2. Methodology The reconnaissance survey of the selected gully erosion sites were carried out on 20th August 2011. This survey involves a multiple stops at the individual gully sites, observations, visual analysis of outcrops. The Global Positioning System (GPS) was used to measure the coordinates of some gully sites as shown below.
1958 | P a g e
OKEREKE / International Journal of Engineering Research and Applications (IJERA) ISSN: 2248-9622 www.ijera.com Vol. 2, Issue 3, May-Jun 2012, pp.1955-1967 Site Locations Location 1: Okigwe Umuahia Road Latitude: 50 49 N ́ Longitude: 70 20 ́E Elevations: 154m Orientation of gully: NE
–
Location 2: Umuowaibu Latitude: 50 53 N ́ Longitude: 70 18 ́E Elevations: 151m Orientation of gully: NE
Location 3: Eke Ibu I Latitude: 50 55 ́N Longitude: 70 17 ́E Elevations: 158m Orientation of gully: SW
2.1.Data Processing The landsat data used were acquired from the National Space Research and Development Centre Agency (NSRDA). The image was obtained using Landsat ETM sensor with band combination 2, 3 and 4 with a resolution of 30m. The following color codes were used, red for vegetation, black for rock outcrops, gray/white for bare/exposed surfaces and blue for water bodies. The processing of the landsat images were done using ILWIS 3.2 Academic and ERDAS imaging softwares. These softwares have the capacities of carrying out various data enhancement techniques such as linear enhancement, statistical analysis, principal component analysis and normalized difference vegetation index. The image enhancement operations were carried out for better visual interpretation, to reduce noise distortion in the image prior to a multi-band image classification and to detect line features in the satellite image to aid structural interpretation. The images were Geo-referenced to a universal transverse Mercator (UTM) grid using the softwares to allow compatibility and comparison with other data sets. 3. Discussion Of Result A comprehensive data processing and reduction were carried out on the landsat data and the following maps were generated: Digital Elevation Model (DEM) map, lineament and lineament density map, the Normalized Difference Vegetation Index (NDVI), the False Colour Composite Maps and the Rose Diagram. The output of NDVI is a measure of vegetation richness of an area. Values of NDVI can range from -1.0 to 1.0, but values less than zero typically do not have any ecological meaning. Low NDVI values mean there is little difference between the red and near infra-red (NIR) signals. This happens when there is little photosynthetic activity, or when there is just very little NIR light reflectance (that is, water reflects very little NIR light from the NDVI of + 0.30 to – 0.38, which shows unhealthy vegetation. The area were much earlier in time protected by dense forest which the inhabitants removed in the process of urbanization and agricultural activities leading to an exposure of the fragile soil to the heavy downpour and concentrated runoff of the area. The high speed of the soil surface runoff culminates in rapid washing away of the soil surface weakening the soil strata which is the chief cause of gullies in the area. This fact is attested to by the findings of Egboka and Nwankwo 1985, Nwajide 1977, Igbokwe 2003 and Akamigbo 1988. Mathematical formular for NDVI calculation on per pixel basis NDVI = NIR – RED NIR + RED where NIR is the near infrared band value for a cell and RED is the red band value for the cell. NDVI can be calculated for any image that has a red and a near infrared band. The biophysical interpretation of NDVI is the fraction of absorbed photosynthetically active radiation. Many factors affect NDVI values like plant photosynthetic activity, total plant cover, biomass, plant and soil moisture and plant stress, because of this, NDVI is correlated with many ecosystem attributes that are of interest to researchers and managers (example, net primary productivity, canopy cover, bare ground cover). Also, because it is a ratio of two bands, NDVI helps compensate for difference both in illumination within an image due to slope and aspect and differences between images due to time of day or season when the images were acquired. Thus, vegetation indices like NDVI make it possible to compare images overtime to look for ecologically significant charges.
1959 | P a g e
OKEREKE / International Journal of Engineering Research and Applications (IJERA) ISSN: 2248-9622 www.ijera.com Vol. 2, Issue 3, May-Jun 2012, pp.1955-1967 2
1
2 2 2 2
3
4
5
Plate 1: Active gully in Umuowaibu Plate 2: Road destroyed by gully in Umuowaibu 1 village Plate 3: U-shaped gully in Umuowaibu Plate 4: V-shaped gully in Umuowaibu Plate 5: Gully site in Ekeibu The Normalized Difference Vegetation Index (NDVI) is an index of plant “greenness” or photosynthetic activity, and is one of the most commonly used vegetation indices. Vegetation indices are based on the observation that different surfaces reflect different types of light. Different photosynthetically active vegetation, in particular, absorbs most of the red light that hits it while reflecting much of the near infrared light. Vegetation that is dead or stressed
1960 | P a g e
OKEREKE / International Journal of Engineering Research and Applications (IJERA) ISSN: 2248-9622 www.ijera.com Vol. 2, Issue 3, May-Jun 2012, pp.1955-1967 reflects more red light and less near infrared light. Likewise, non-vegetated surfaces have a much more even reflectance across the light spectrum.
Fig. 3: The Normalized Difference Vegetation Index (NDVI) of the study area Figure 4 shows the topographic roughness and geomorphology of the study area. The DEM is employed for structural geologic and tectonic interpretations such as locality faults, drainage pattern, geomorphology, lineaments and the boundary between geologic units,etc. The DEM of the study area shows the elevation differences and a quick estimation of the geomorphology of the area. From the DEM map, the area is characterized by a rugged topography. The difference in elevation of the area is not consistent. The south western part of the area is on a high elevation ranging from 57-417 meters which is the highest peak in the area, the central part is red, green has an average elevation of 215-282 meters above sea level and it is observed to be trending NW-SE. The north eastern part has elevation of 57-215 meters above sea level. The elevation of the area is increases from south to north and characterized by low hills with steep slopes which when correlated with the intense rainfall can be a causative factor of gully erosion in the area.
1961 | P a g e
OKEREKE / International Journal of Engineering Research and Applications (IJERA) ISSN: 2248-9622 www.ijera.com Vol. 2, Issue 3, May-Jun 2012, pp.1955-1967
Fig. 4: The Digital Elevation Model (DEM) of Okigwe Colour and colour tone are the brightness levels in digital images. The reflection of colour tones of different materials on the earth helps in distinguishing surface materials and their boundries. In this study, there are three colour composite images with RGB, R=Red, G=Green, B=Blue bands of landsat TM multispectral image respectively. The mid infrared portion of the spectrum is sensitive to active vegetation, water bodies and soil moisture. The composite image provides a naturalistic and earth view of the study area. In the RGB 752, 542, 275 false coloured composite maps, the green areas represents the active vegetation while the blue areas represents the waters, the grey areas represents the ground surface or bare rocks. The composite images reveal the drainage pattern of the study area to be dendritic. The dendritic drainage pattern of the area trends in the NE-SW direction (Figure 8) is associated with trench branching tributaries joining the main stream at acute angle and this pattern shows up on homogeneous, uniform soil and rock materials mostly in soft sedimentary rocks and old dissected coastal plains (Howard, 1967). The dendrite pattern reveals a lithological, structural and topographical homogeneity of the study area. This occurs on homogenous gentle, uniformly sloping sedimentary surfaces whose main collector streams may indicate a fault or fracture. The geological interpretation of the landsat imagery revealed a number of lineaments and mega- lineaments over 15km in size trending in the NE-SW, much less in NW-SE & N-S. The trend surface analysis in relation with the interpreted lineaments show that the dominant structural
1962 | P a g e
OKEREKE / International Journal of Engineering Research and Applications (IJERA) ISSN: 2248-9622 www.ijera.com Vol. 2, Issue 3, May-Jun 2012, pp.1955-1967
Fig. 5: RGB 752: False coloured Composite Image of the Study Area
Fig. 6: RGB 543: False coloured Composite Image of the Study Area
1963 | P a g e
OKEREKE / International Journal of Engineering Research and Applications (IJERA) ISSN: 2248-9622 www.ijera.com Vol. 2, Issue 3, May-Jun 2012, pp.1955-1967
Fig. 7: RGB 275: False coloured Composite Image of the Study Area trend is in the NE-SW direction which corresponds to the major lineament trend of the Anambra basin. This also shows that the area has a rugged topography and it is partly deformed by tectonic activities. The lineament trends are in line with the results of previous works which suggested that the south eastern part of Nigeria has a complex network of fractures trending NE-SW, NW-SE, N-S and E-W (Udoh, 1988, Chukwuike, 1977). The lineament trends corresponding to faults, geologic boundaries, folds and tectonically related joints in the area cause the ruggedness of the topography which the south eastern Nigeria has been interpreted to be a basic, associated with two major fault lines trending NE-SW and NW-SE (Ehirim, and Ebeniro, 2008). These findings show that the area is affected by tectonic activities and the effect of these tectonic activities on the geologic formation of the area is responsible for the increasing gully and landsliding in the study area. Results from the lineament analysis revealed that the lineament trend in the area correlated well with the measured strokes of the geologic formations. Similarly, a correspondence was found to exist between the lineament map, drainage density and occurrence of gullies and landslides. Lineament features are the surface expression of fractures affecting the bedrock. It is also defined as the most favourable structural conditions in control of various mineral deposits. These features are clearly discernable on aeromagnetic maps and landsat images. It often indicates the form and position of individual folds, faults, joints, veins, lithologic contact and other geologic features. Lineament analysis helps to reveal zones of fracture concentration and identification of surface features. Linear features as seen on satellite images are usually the results of aligned morphologic rock or topographic relief of the basement. The measured variation are interpreted in terms of the probable distribution of magnetic materials below the surface, which in turn is the basis for inferences about the probable geologic condition. Geomorphologists dealing with remote sensing applications have studied stream drainage patterns and their relationships to terrain conditions. Many have deduced different rock properties and structures using topographic relief interpretation from the imagery. They have illustrated and quantified relationships among selected rock properties, topographic and stream drainage patterns (Konecny, 2002). Stream drainage density in eroding rock landscapes can be explained by a function of rock resistance to weathering, topography and climate. Rock resistance to both chemical and mechanical weathering is an important factor in explaining drainage patterns. In terms of topography, higher relief creates a finer textured drainage as observed in the study. It is the amount of protective vegetation cover, which can be correlated to temperature and precipitation that significantly controls erosion and drainage density. The softer rock, such as shale areas, have higher drainage densities in drier climates
1964 | P a g e
OKEREKE / International Journal of Engineering Research and Applications (IJERA) ISSN: 2248-9622 www.ijera.com Vol. 2, Issue 3, May-Jun 2012, pp.1955-1967 than wetter climates. The protection of the rock and soil surface by vegetation compensates for the increase in precipitation. Stream drainage density usually indicates the porosity and permeability of the underlying materials. Materials with good permeability generally have a medium to coarse drainage density. Such materials include sandstones, terrace gravels, limestones, volcanic ashes and sand dunes. Stream drainage density also shows that fine grained or impermeable materials have little moisture on the surface. This moisture does not infiltrate and must run off on the surface. Stream drainage patterns can reveal large-scale coarse structure of underlying rocks, for example, stream drainage patterns with numerous straight parallel or sub-parallel segments can indicate extensive jointing on dipping bedded or foliated rocks. Consistent angular relationships between stream elements indicate fractures. Co-centre drainage shows doming of layered sequence of rock related to intrusion or folding. Radial drainage shows doming, volcanic activity, or small resistant cylindrical intrusions in less resistant rocks. Well-developed dendritic drainage patterns without well developed parallel element suggest a uniform stratum without abundant discontinuities. This can consist of sedimentary, igneous, or metamorphic rocks or sheets of relatively uniform glacial or alluvial materials. Distributed channel patterns indicate alluvial fans, pediments, or deltas and they are usually associated with an abrupt decrease in stream velocity. Extensive drainage channels indicate strong foliation, dipping sequence of resistant and nonresistant rocks, or strong unidirectional fracturing. The shapes of the main channels in the stream drainage area also provide clues about the geological structures. For instance, braided channels indicate easily erodable coarse-grained materials while meandering channels indicate medium to fine grained materials. Consistently, narrow and straight channels indicate resistant materials, but abrupt changes in channels indicate changes in geological structures. Extreme changes in channel types indicate changes in the materials that make up the bank. The main channel in the drainage area having discontinuities indicates cracks (breaks and fractures) and or faults as well as unconformities.
Fig. 8: Lineament and Drainage Map of the Study Area
1965 | P a g e
OKEREKE / International Journal of Engineering Research and Applications (IJERA) ISSN: 2248-9622 www.ijera.com Vol. 2, Issue 3, May-Jun 2012, pp.1955-1967
Fig.9: Lineament Density Map of the Study Area N
Axial (non-polar) data; No. of Data = 104; Sector angle = 10°; Scale: tick interval = 5% [5.2 data]; Maximum = 20.2% [21 data]; Mean Resultant direction = 034-214; [Approx. 95% Confidence interval = ±14.7°]
Fig.10: Rose Diagram of the study Area showing the dominant lineament trends
4. Conclusion General conclusion can be drawn from this study that remote sensing techniques (landsat thematic imagery) are applicable in gully identification and characterization with high and desirable levels of accuracy. The processed data reveal several lineaments striking predominantly in NE- SW and NW-SE directions corresponding to the major lineament trend of the Anambra basin and the orientation of gullies in the study area. The study revealed that the inherit susceptibility of the study area to gully erosion is derived from the effects of activities on the geologic formations of the area which is characterized by poor geotechnical properties based on previous studies in south eastern Nigeria as a whole. Nwajide, 1977, Egboka, 1984, Hiram and Ebeniro, 2006,
1966 | P a g e
OKEREKE / International Journal of Engineering Research and Applications (IJERA) ISSN: 2248-9622 www.ijera.com Vol. 2, Issue 3, May-Jun 2012, pp.1955-1967 Akpokodje, Olarunfemi and Etu- Effeodor, 1986 have shown that Anambra basin, Ajali- false bedded sandstone, Nsukka and Imo Formations are dominant geologic formations in the area characterized by poor geotechnical properties, low vegetation cover and agricultural exposure and weakening of the soil strata authenticate the fact that significant relationships exist between vegetation types, topography, geologic formations, soil characteristics (physical and chemical) and gully formation and development in the area.
Recommendations
Since the groundwater is slightly acidic, acid resistant construction materials should be used.
The affected areas should be reclaimed by extensive afforestation and other agricultural programmes.
Major dewatering schemes at strategic locations should be developed and the pumped water could be treated for use. The dewatering should be on a continous basis.
Post- Control Measure
An Environmental monitoring center should be set up at Okigwe to monitor the control measures and collect relevant information for future analysis.
References Egboka, B.C.E and Okpoka, J.C. (1984). “Gully Erosion in the Agulu-Nanka Region of Anambra State, Nigeria” International Association of Hydrological Sciences. Publ. No. 144:335-347. Egboka, B.C.E and Nwankwor, H.I. (1982). The Hydrogeological and geotechnical parameters as Causative Agents in the Generation of Erosion in the Rain Forest Belt of Nigeria. J. Afr. Earth. Sci. 3(4), 417-425. Ehirim C.N and Ekeocha N.E. (2009). Anisotropic Type Determination and Soil structure Evaluation in parts of the Gully erosion zones of S.E Nigeria using Azimuthal-Offset Resistivity Sounding Technique and Erodibility Characterization. Ehirim, C.N. and Ebeniro, J.O. (2006). “Tectonic Trends Delineated from Drainage Lineament Analysis and Azimuthal Resistivity Survey: A case study of South Eastern Nigeria Gully Erosion Belt”. Global Journal of Pure and Applied Sciences 4(1): 21-28. Ekeochoa, N.E. (2008). Physical Characteristics of Soils at Gully Erosion Sites in Parts of Southeastern Nigeria Scientia Africana I. pp. 104 – 112. Floyd, B. (1965). Soil Erosion and Deterioratic in South Eastern Nigeria. The Nigerian Geography Journal 18(1) pp 33-44. Hydson, N.W (1957). Erosion Control Research – Progress, Southwastern Nigeria. Hydson, N.W. (1957) Erosion Control Research – progress Reports on Experiments in Henderson Research Station 1953-56, Rhodesia Agric J. 54 (4): 297-323. Igbokwe et al (2003, Egboka (2004). Distribution of Gully Sites in Southeastern Nigeria. Igbokwe J. (2004). “Gully Erosion Mapping /Monitoring in parts of Southeastern Nigeria”. Presentation on Gully Erosion. www.erosion.com. Igbokwe, J.I., Ojiako, J.C. and Nnodu V.C. (2003). Monitoring Characterization and Controlling of Flood water Erosions using Remote Sensing techniques. Proceeding of the Technical Session of 38 th Annual conference of Nigerian Institution of Surveyors, Lokoja, Nigeria, Pp. 73-79. Jeje L.K. and Agu S.N. (1982). Runoff and Soil loss from Erosion Plots in the Area in Southwestern Nigeria Geo. Eco. Trop: 16(3),. 161-181. Kogbe, C.A. (1989). Geology of Nigeria (ed). Rock View (Nigeria) limited Zaramaganda, Jos, Nigeria Konecny, G. (2002) Development and State of the Arts of Remote Sensing in Remote Sensing for Resource Development and Environment Management edited by Damen, M.C.J. Smits. G and Vertappen H.T., Balkema, Rotterdam Vol. 3, pp. 969 – 972. Nwajide, S.C. and Hoque M. (1979). Gully processes in Southeastern Nigeria. The Nigerian Field Journal pp. 44(2), 64-74. Ofomata, G.E. (1985). Factors of Soil erosion in Enugu Area of Nigeria. The Nigerian Geography Journal 8(1). Pp. 45-59. Okigwe, Nigeria. The Place and the People July 23, (2011). http://www.Imo State.gov.ng.
1967 | P a g e