© 1999 Nature America Inc. • http://genetics.nature.com
review
Exploring the new world of the genome with DNA microarrays Patrick O. Brown1,3 & David Botstein2
© 1999 Nature America Inc. • http://genetics.nature.com
Departments of 1Biochemistry and 2Genetics, and the 3Howard Hughes Medical Institute, Stanford University School of Medicine, Stanford, California 94305, USA. e-mail:
[email protected]
Thousands of genes are being discovered for the first time by sequencing the genomes of model organisms, an exhilarating reminder that much of the natural world remains to be explored at the molecular level. DNA microarrays provide a natural vehicle for this exploration. The model organisms are the first for which comprehensive genome-wide surveys of gene expression patterns or function are possible. The results can be viewed as maps that reflect the order and logic of the genetic program, rather than the physical order of genes on chromosomes. Exploration of the genome using DNA microarrays and other genome-scale technologies should narrow the gap in our knowledge of gene function and molecular biology between the currently-favoured model organisms and other species.
The genome project has revitalized exploration in biological research. Not long ago, it was possible for biologists to imagine that the genes that had been discovered via mutations, selections and cloning schemes represented a good approximation of the total universe of genes, and that the proteins already discovered on the basis of their abundance, location, or activity well represented the total universe of proteins. One of the great contributions of the genome project has been to show us what a small part of this world was really known to us, and how much of this world remains to be explored. In April 1996, the complete sequence of the yeast genome confronted us with the fact that yeast contain approximately 6,200 ‘real’ genes, as judged from open reading frames, for only one quarter of which could we hazard a guess regarding function1 (http://www.ncbi.nlm.nih.gov/ Entrez/Genome/org.html). The tens of thousands of partial human cDNA sequences representing previously unseen genes have had a similar humbling effect2. Although we may have suspected its existence, the actual discovery of this genetic terra incognita has jolted biology much as the discovery of America jolted Europe 500 years agoshowing us how much of the world is beyond the frontier—mysterious, tantalizing and unexplored. Exploring the genome and the natural world with DNA microarrays Exploration means looking around, observing, describing and mapping undiscovered territory, not testing theories or models. The goal is to discover things we neither knew or expected, and to see relationships and connections among the elements, whether previously suspected or not. It follows that this process is not driven by hypothesis and should be as model-independent as possible (see page 54 of this issue (ref. 3)). We should use the unprecedented experimental opportunities that the genome sequences provide to take a fresh, comprehensive and openminded look at every question in biology. If we succeed, we can expect that many of the new models that emerge will defy conventional wisdom. Exploring and surveying are best done systematically. The genome, representing the complete blueprint of the organism, is the natural bounded system in which to conduct this exploration. The completion of the genomic sequences of ‘model nature genetics supplement • volume 21 • january 1999
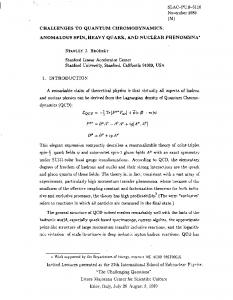
organisms’ (currently the eukaryotes Saccharomyces cerevisiae and Caenorhabditis elegans, as well as dozens of bacterial species) provides us with such complete blueprints (http://www.ncbi.nlm. nih.gov/Entrez/Genome/org.html). These genome sequences have not only made a new era of exploration imperative, but, providentially, they have also made it possible. DNA microarrays provide a simple and natural vehicle for exploring the genome in a way that is both systematic and comprehensive4–10. The power and universality of DNA microarrays as experimental tools derives from the exquisite specificity and affinity of complementary base-pairing. We are provided thereby with an instant experimental handle on DNA or RNA unlike any we possess for any other biological molecules. A DNA copy of an individual gene provides a nearly ideal reagent for specific and quantitative detection and measurement of the sequence of the gene, even in an extremely complex mixture. For this reason, the sequence information provided by the genome project has had an instantaneous impact on experimental biology. The method used in our labs is simple to describe (complete details and protocols are available, http://cmgm.stanford.edu/ pbrown). Briefly, arrays of thousands of discrete DNA sequences (for example, all of the 6,200 known and predicted genes of S. cerevisiae) are printed on glass microscope slides using a robotic ‘arrayer’ (ref. 5; see also, pages 10 (ref. 11) and 15 (ref. 12) of this issue). To compare the relative abundance of each of these gene sequences in two DNA or RNA samples (for example, the total mRNA isolated from two different cell populations; Fig. 1), the two samples are first labelled using different fluorescent dyes (say, a red dye and a green dye). They are then mixed and hybridized with the arrayed DNA spots. Use of differentially labelled mixtures avoids most of the complications of hybridization kinetics; we always measure the ratio. After hybridization, fluorescence measurements are made with a microscope that illuminates each DNA spot and measures fluorescence for each dye separately; these measurements are used to determine the ratio, and in turn the relative abundance, of the sequence of each specific gene in the two mRNA or DNA samples. There are, of course, other microarray systems and methods, most notably the oligonucleotide arrays developed by Affymetrix6,7,13, which differ in many details but share the essential simplicity of this experimental design. 33
review
© 1999 Nature America Inc. • http://genetics.nature.com
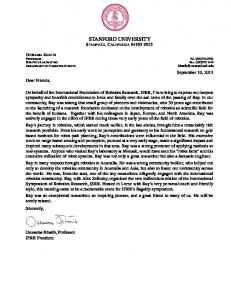
mRNA
TEP1 cDNA
© 1999 Nature America Inc. • http://genetics.nature.com
DNA microarray Fig. 1 Gene expression analysis using a DNA microarray. In this illustration, mRNA samples from vegetative and sporulating yeast cells are compared. The total pool of messenger RNA from each cell population is used to prepare fluorescently labelled cDNA by reverse transcription in the presence of fluorescently labelled nucleotide precursors. To allow direct comparison of the abundance of each gene in the two samples, the two samples are labelled with different fluorsin this example, a red fluor for the mRNA from sporulating yeast and a green fluor for the mRNA from the vegetative yeast cells. The two fluorescently labelled cDNAs are then mixed and hybridized with a DNA microarray in which each yeast gene is represented as a distinct spot of DNA. Irrespective of their fluorescent labels, the cDNA sequences representing each individual transcript hybridize specifically with the corresponding gene sequence in the array. Thus, the relative abundance in sporulating as compared with vegetative yeast cells of the transcripts from each gene is reflected by the ratio of ‘red’ to ‘green’ fluorescence measured at the array element representing that gene. For example, the greater relative abundance of the TEP1 mRNA in the sporulating cells results in a high ratio of red-labelled to green-labelled copies of the corresponding cDNA, and an equivalent ratio of red to green signal hybridized at the array element composed of DNA from TEP1.
The properties of genes that can be explored and exploited using DNA microarrays are diverse. For each property we explore, the challenge is simply to find an experimental method that turns that property into the basis for differential fractionation of DNA or RNA sequences. This is trivial when the property is differential expression at the mRNA level comparing the relative abundance of mRNA from each gene is simply a matter of measuring the differential hybridization to a DNA microarray of fluorescently labelled cDNAs prepared from two mRNA samples.Other properties require less direct approaches5,14–17. We have found, however, that many of the most important attributes of genes, ranging from their transcription and translation, to the subcellular localization of their products, to their genotype, to their mutant phenotypes, can be studied conveniently and economically on a genome-wide basis using DNA microarrays. Fast, cheap and easy to control Several features of DNA microarray technology make it particularly well suited to exploratory research. (i) It is (relatively) cheap: the capital cost for building both an arrayer and scanner is now less than $60,000, and the marginal cost per copy of the yeast genome microarray is currently about $20. Ongoing development efforts in academic and commercial labs and competition among commercial suppliers should continue to bring the cost down. Thus, if we are curious about a process, or a mutant phenotype, we can easily just ‘take a look’ without agonizing over cost. (ii) It is flexible and universal: as we continue to learn more about additional genomes, we need to be able to convert the information into tools for exploration quickly and inexpensively. In addition 34
to more than a thousand arrays of the complete yeast genome, we have already printed hundreds of copies each of arrays of more than 95% of all the predicted genes of Mycobacterium tuberculosis, all the predicted genes of Escherichia coli, 3,000 Drosophila melanogaster genes, thousands of C. elegans genes, over 14,000 human genes, all cytomegalovirus genes and over 3,000 Plasmodium falciparum genes (unpublished data). (iii) It is fast: the total time currently required to print 150 copies of an array of 12,000 genes is now about a day. (iv) It is user-friendly: the convenient, solid, open format of the microscope slide, the non-radioactive, non-toxic, low-volume (10 µl) hybridization solution and the comforting knowledge that the arrays are cheap and easily replaced all make everyone using the system feel comfortable performing the exploratory, adventurous experiments that we think are called for in this phase of the genome project. Using DNA microarrays to study gene expression on a genomic scale The study of gene expression on a genomic scale is the most obvious opportunity made possible by complete genome sequences of the model organisms, and experimentally the most straightforward. Four characteristics of the regulation of gene expression at the level of transcript abundance account for the great value and appeal of genome-wide surveys of transcript levels. First, it is eminently feasible DNA microarrays make it easy to measure the transcripts for every gene at once (much as we might wish to be able to measure the abundance of the final products of every gene, or better still the biochemical activity of the products of every gene, there is no practical generic tool for doing so…yet). The second reason is the tight connection between the function of a gene product and its expression pattern. As a rule, each gene is expressed in the specific cells and under the specific conditions in which its product makes a contribution to fitness. Just as natural selection has precisely tuned the biochemical properties of the gene product, so it has tuned the regulatory properties that govern when and where the product is made and in what quantity. The logic of natural selection, as well as experimental evidence, provides part of the basis for our belief that there is a sensible link between the expression pattern and the function of its gene product. Thirty years of molecular biology have provided numerous examples of genes that function under specific conditions and whose expression is tightly restricted to those conditions. The generality and exquisite precision of this link is revealed by a global examination of the expression patterns of all the genes of yeast, as described below. Third, promoters function as transducers, responding to inputs of information about the identity, environment and internal state of a cell by changing the level of transcription of specific genes. Thus, as we learn what information is transduced by the promoter of each gene, we can begin to read this information from the profile of transcripts, easily obtained using a DNA microarray. Fourth, the set of genes expressed in a cell determine what the cell is made of, what biochemical and regulatory systems are operative, how the cell is built and what it can and cannot do. As we learn to infer the biological consequences of specific features of gene expression patterns using our growing knowledge of the functions of individual sets of genes, we can use microarrays as ‘microscopes’ to see a comprehensive, dynamic molecular picture of the living cell. A new kind of map In the past two years, we and others have studied the expression patterns of all the yeast genes, in a wide variety of circumstances, using microarray hybridization8,9,18–22. As every gene in the yeast genome can be represented on the microarrays, the picture of gene expression that emerges is comprehensive. nature genetics supplement • volume 21 • january 1999
review
© 1999 Nature America Inc. • http://genetics.nature.com
a b
c
d
© 1999 Nature America Inc. • http://genetics.nature.com
e f g
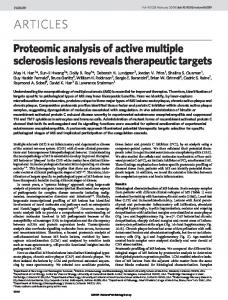
Fig. 2 A gene expression map of the yeast genome. In this illustration, only the 2,473 named genes with known putative functions are displayed. a, This geneexpression map has the form of a table, in which the rows correspond to each of the 2,473 genes and the columns represent experimental measurements of transcript levels for each of the genes. The genes were placed in an order determined by similarities in their expression patterns using a hierarchical clustering algorithm22. This order is unrelated to their order in the physical or genetic map of the yeast genome. The abundance of each transcript in each experimental measurement, relative to a reference specific to each experiment, is represented by a colourred for relatively increased expression, green for relatively diminished expression. The saturation of either colour reflects the magnitude of the difference in expression level. This map represents data from eight separate time series of gene expression in the yeast S. cerevisiae as indicated by the labels at the top of the figures: Alpha, CDC15 and Elu refer to observations of the mitotic cell cycle in cells synchronized by α-factor arrest, by a conditional cdc15 mutation, or by centrifugal elutriation, respectively19,20; SPO refers to a sporulation timecourse17; H, D and C refer time courses of gene expression following heat shock, treatment with dithiothreitol and cold shock, respectively; DX indicates a series of observations during the diauxic shift8. A total of 79 measurements are represented for each gene. b,c,d,e,f,g, Groups of transcriptionally coregulated and functionally related genes discussed in the text are shown.
Although there is a sense in which microarray hybridization might be thought of as a simple scaling up (in numbers), miniaturization (in size and sample requirements) and automation of hybridization measurements that have been standard for many years, data sets produced in this way have emergent properties: when the body of expression data is large enough, and only then, the patterns and systematic features become apparent and we begin to build an integrated picture of the whole system. In many ways the effect of scale here is analogous to the difference between a complete, densely marked genetic map and a handful of isolated genetic markers. There are fundamental differences between traditional genetic maps and the new genomic maps of gene expression or function. There is a natural logical framework on which to build conventional genetic maps, with natural ideas of order (the linear order of genes on a DNA molecule), and natural metrics for distance, whereas no such pre-existing framework exists for this new kind of map. To build useful maps representing the global program of gene expression, it has therefore been necessary to develop new approaches to finding and displaying the systematic features inherent in large sets of global gene expression data. Making these new kinds of functional maps involves two steps. First, the data are organized by, for example, hierarchical clustering algorithms, parameterizations or profiling methods to find inherent orderly features. Second, the ordered tables of data produced by nature genetics supplement • volume 21 • january 1999
these methods are displayed graphically using a naturalistic representation of the huge volumes of quantitative data, in a way that allows biologists to assimilate the patterns of gene expression both on a broad scale (overview of the choreography) and fine scale23 (gene by gene). An early example of such a functional map (Fig. 2) was made using a hierarchical clustering strategy to group genes on the basis of similarity in their patterns of expression23. All the yeast genes with functional annotation in the Saccharomyces Genome Database24 at the time of analysis (2,467 of the roughly 6,220 protein-encoding genes in the yeast genome) are displayed. For simplicity, this map was built using only a small fraction of the genome-wide expression data currently on hand data from yeast cells during the mitotic cell cycle21, sporulation18, the diauxic shift8 and following shock with heat, cold and reducing agents (P. Spellman et al., unpublished data). One of the most useful features of a map of this kind is the extent to which, although based entirely on observations of transcriptional regulation, it reflects information about gene function and even physical association of gene products. Numerous clusters of co-expressed genes, representing diverse expression patterns across even this limited set of conditions, are strikingly coherent in their cellular functions (Fig. 2b−g). The genes in the most extensive cluster (Fig. 2g) are all strongly downregulated in response to starvation and ‘shock’. This cluster 35
review Alpha
© 1999 Nature America Inc. • http://genetics.nature.com
cdc15
cdc28
Elu
M/G1
G1
S
© 1999 Nature America Inc. • http://genetics.nature.com
G2
M
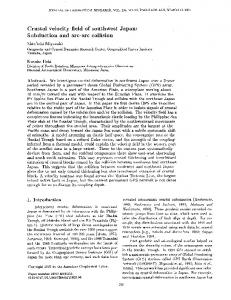
Fig. 3 The yeast cell-cycle ‘phaseogram’; gene expression during the yeast cell cycle. The expression patterns of the 800 cell-cycle regulated yeast genes identified by Spellman et al. are shown21. The display convention is the same as that used in Fig. 2. In all cases, red indicates an increase in mRNA abundance, whereas green indicates a decrease in abundance, relative to an unsynchronized cell population. The genes are placed in order according to the cell-cycle phase at which their transcripts were most abundant. The coloured bars on the top of the figure indicate progression through the cell cycle, whereas the coloured bars on the side of the figure indicate the phase at which transcripts for each group of genes reached their maximum levels (M/G1, yellow; G1, green; S, purple; G2, red; M, orange). Four different procedures were used to synchronize cells: α factor arrest (‘Alpha’), arrest with a conditional cdc15 mutation (‘cdc15’), arrest with a conditional cdc28 mutation (‘cdc28’) and centrifugal elutriation (‘elu’). The results for cdc28-synchronized cells were from Cho et al.20.
is dominated by more than 100 cytoplasmic ribosomal proteins and other genes (such as elongation factors) involved in translation. Genes encoding components of the mitochondrial translation apparatus show a distinctly different pattern, shared with some of the genes involved in respiration (Fig. 2d), and subtly different from the pattern shared by a large cluster of coordinately expressed genes involved in mitochondrial ATP synthesis (predominantly members of the F1F0 ATPase complex) and electron transport (Fig. 2e). Co-expression of genes encoding the components of molecular complexes, like the ribosome (Fig. 2g), the proteasome (Fig. 2b), or the nucleosome (Fig. 2f), was particularly precise. In addition, there are many examples of co-expressed genes whose products work in concert, but not, as far as we know, in protein complexes, such as genes encoding numerous glycolytic enzymes (Fig. 2c). Transcriptional co-regulation, which can now be easily recognized by genome-wide transcriptional profiling, can therefore tell us about physical or functional connections between gene products. Using the framework provided by genes whose activities and associations are known, we find that, on the basis of their expression pattern, many as yet uncharacterized genes fall into clusters with the genes of known function. These novel genes are now already implicated by co-regulation, and invite further characterization to establish their functional role(s). Surveying and cataloguing with DNA microarrays A natural kind of exploration with DNA microarrays is the comprehensive cataloguing of genes that have a characteristic 36
regulatory pattern. Several examples of this type of experiment have now been published8,9,18,20,21. In one, more than a thousand genes whose transcript levels change significantly during meiosis and spore morphogenesis were identified and classified according to the detailed temporal pattern of their expression14. Many of these genes were previously uncharacterized, and most had never been recognized to have a role in sporulation. Three genes that were indicted on the basis of their expression during sporulation were tried by deletion analysis, and all three were convictedin each case the deletion mutants were found to have sporulation defects. A second example of this kind of exploration is a comprehensive survey of genes that vary in their transcript level according to the stage of the yeast cell cycle20,21. This same fundamentally important process was studied independently by two groups using different microarray methods the Affymetrix oligonucleotide arrays20 and ‘home-made’ printed DNA microarrays21. Four different methods for synchronization of cells in culture were used, and the results analysed by both a Fourier algorithm to assess periodicity and an algorithm that measured similarity to profiles of genes known to be cell-cycle regulated. The result identified 800 cell-cycle regulated genes (Fig. 3), most of which had not previously been characterized in this way21. To characterize the regulatory networks that control gene expression, a natural experimental design is to use DNA microarrays to examine what happens to the expression of every single gene when a candidate regulatory gene is mutated8,17,20,21. The power of this strategy has already been established, and there is little doubt that in the next few years, as the comprehensive yeast gene mutation and mis-expression projects converge with DNA microarray surveys of global gene expression, we will have a detailed picture of the global effects on gene expression of mutations in essentially every yeast gene.
Model organisms, sequenced genomes and the rest of the natural world The established model organisms (yeast, nematode, more than a dozen bacteria and, soon, the fly) are also the first for which comprehensive genome-wide surveys of expression patterns or gene function are possible, simply because their complete genome sequences are available. Furthermore, as we have described, the insights we gain from patterns of gene expression are built on a foundation of knowledge of the many genes that have already been characterized in these well-studied organisms. Thus, some observers (including a reviewer of this paper) subscribe to the idea that characterization of gene expression patterns will be much less valuable in non-model organisms, even those for which substantial DNA sequence information is available. Nothing could be further from the truth; on the contrary, we believe that efficient, large-scale exploration using DNA microarrays and other genome-scale technologies will rapidly narrow the gap in knowledge of gene function and molecular biology between the model organisms and their less-favoured brethren. There are two reasons for this. First, for many genes, the rate of evolution with respect to both sequence and function has been so slow that characterization of function in one organism may well suffice for many or all. For instance, when the complete set of proteins encoded by yeast and nematode are compared, fully 40% of the 6,200 yeast genes had, by sequence analysis alone, clear orthologues in the worm, so that the function of nearly 20% of the proteins encoded by the worm could be nature genetics supplement • volume 21 • january 1999
© 1999 Nature America Inc. • http://genetics.nature.com
© 1999 Nature America Inc. • http://genetics.nature.com
guessed at simply by knowing the function of the yeast orthologue25. Similar arguments and estimates have been made relative to human genes26. This indicates that clusters of co-expressed genes in a pathogenic microorganism, in humans, or in any organism of interest will very often contain at least some genes that encode proteins with orthologues that have been characterized in some other organism (typically one or more of the models). In most cases, this kind of information will suffice to begin a rapid boot-strapping process by which the function of the clustered genes can be determined more directly in the organism of interest. It is important to note, however, that in spite of the crucial role it can have in analysis and intepretation of results, DNA sequence information is not required to make and use DNA microarrays. Indeed, most of the human genes whose expression has been studied using DNA microarrays are currently defined only by partial EST sequences27. The second reason is that it is now readily feasible to use DNA microarrays to survey and analyse patterns of gene expression directly in pathogens and human cells, just as we described above. Not only will the clusters of co-expressed genes identified in those surveys frequently include orthologues of genes characterized in other systems, but the patterns of expression will often suffice to begin de novo discovery of potential gene functions: one set of genes will be associated with stress response; another set with reponsiveness to a hormone, yet another set will be associated with neoplasia. Overlaps and connections among these patterns will provide further insights, and very rapidly the process of discovery via gene expression pattern will lead to the generation of hypotheses that can be tested in the non-model organism directly. We are persuaded that the ability to observe the behaviour of many genes at a time is the main immediate benefit of genome sequencing. Indeed, we believe that ability to study, in ordinary laboratories, thousands of genes simultaneously using genome1. Goffeau, A. et al. Life with 6000 genes. Science 274, 563–567 (1996). 2. Deloukas, P. et al. A physical map of 30,000 human genes. Science 282, 744–746 (1998). 3. Bassett, D.E. Jr, Eisen, M.B. & Boguski, M.S. Gene expression informatics—it’s all in your mine. Nature Genet. 21, 51–55 (1999). 4. Schena, M. et al. Quantitative monitoring of gene expression patterns with a cDNA microarray. Science 270, 467–470 (1995). 5. Shalon, D., Smith, S.J. & Brown, P.O. A DNA micro-array system for analyzing complex DNA samples using two-color fluorescent probe hybridization. Genome Res. 6, 639–645(1996). 6. Pease, A.C. et al. Light-generated oligonucleotide arrays for rapid DNA sequence analysis. Proc. Natl Acad. Sci. USA 91, 5022–5026 (1994). 7. Lockhart, D.J. et al. Expression monitoring by hybridization to high-density oligonucleotide arrays. Nature Biotechnol. 14, 1675–1680 (1996). 8. DeRisi, J.L., Iyer, V. & Brown, P.O. Exploring the metabolic and genetic control of gene expression on a genomic scale. Science 278, 680–686 (1997). 9. Wodicka, L. et al. Genome-wide expression monitoring in Saccharomyces cerevisiae. Nature Biotechnol. 15, 1359–1367 (1997). 10. Lashkari, D.A. et al. Yeast genome microarrays for parallel genetic and gene expression analysis of the yeast genome. Proc. Natl Acad. Sci. USA 94, 13057–13062 (1997). 11. Duggan, D.J., Bittner, M., Chen, Y., Meltzer, P. & Trent, J. Expression profiling using cDNA microarrays. Nature Genet. 21, 10–14 (1999). 12. Cheung, V.G. et al. Making and reading microarrays. Nature Genet. 21, 15–19 (1999). 13. Lipshutz, R.J., Fodor, S.P.A., Gingeras, T.R. & Lockhart, D.J. High density synthetic oligonucleotide arrays. Nature Genet. 21, 20–24 (1999). 14. Shoemaker, D.D. et al. Quantitative phenotypic analysis of yeast deletion mutants
nature genetics supplement • volume 21 • january 1999
review
scale methods such as microarray hybridization will be the hallmark of post-genome biological research. Having more data is good Although we have emphasized studies of transcriptional programs, it is important to remember that DNA microarrays can be equally well used to survey the entire genome for any functional attribute of a DNA sequence that can provide a means for fractionation of genomic DNA or RNA into physically separate pools. Thus, we can expect functional genomic maps in the coming years to include information on transcription, translation, subcellular localization, mutant phenotype, genotypic variation, replication, recombination, protein DNA interactions and more. The exploration of the new world of the genome will present a novel challenge to scientific publishing. Conventional journals have evolved to publish papers that have a ‘bottom line’. In a typical genomic exploration of the kind for which microarrays were designed, reducing the results to a few ‘bottom lines’ would be like representing human anatomy with a stick figure. Clearly, a fundamentally new kind of scientific publication is needed (http://xxx. lanl.gov). For the moment, our own group has been addressing this problem in three ways: first, we provide complete data tables whenever we submit publications so that the journals can provide them to readers; second, we ‘self-publish’ by means of our own web sites, which provide searchable databases and visualization tools so that anybody can find out what we learned about any gene of interest; and third, we provide all the data to the relevant genomic databases, such as the Saccharomyces genome database (ref. 24). We believe that publishing these descriptive data is as essential a part of the process of genomic exploration as the publication of maps and journals was to the lasting value of the expedition of Lewis and Clarke. A fresh approach to scientific publication may be one of the next critical advances in the post-genome era.
15. 16. 17. 18. 19. 20. 21. 22. 23. 24. 25. 26. 27.
using a highly parallel molecular bar-coding strategy. Nature Genet. 14, 450–456 (1996). Cho, R.J. et al. Parallel analysis of genetic selections using whole genome oligonucleotide arrays. Proc. Natl Acad. Sci. USA 95, 3752–3757 (1998). Nelson, S. et al. Genomic mismatch scanning: a new approach to genetic linkage mapping. Nature Genet. 4, 11–18 (1993). Winzeler, E.A. et al. Direct allelic variation scanning of the yeast genome. Science 281, 1194–1197 (1998). Chu, S. et al. The transcriptional program of germ cell development in budding yeast. Science 282, 699–705 (1998). Marton, M.J. et al. Drug target validation and identification of secondary drug target effects using DNA microarrays. Nature Med. (in press). Cho, R.J. et al. A genome-wide transcriptional analysis of the mitotic cell cycle. Mol. Cell. 2, 65–73 (1998). Spellman, P.T. et al. Comprehensive identification of cell-cycle regulated genes in Saccharomyces cerevisiae. Mol. Biol. Cell. 95, 14863–14868 (1998). Hauser, N.C. et al. Transcriptional profiling on all open reading frames of Saccharomyces cerevisiae. Yeast 14, 1209–1221 (1998). Eisen, M. et al. Cluster analysis and display of genome-wide expression patterns. Proc. Natl Acad. Sci. USA (in press). Cherry, J.M. et al. SGD: Saccharomyces Genome Database. Nucleic Acids Res. 26, 73–79 (1998). Chervitz, S.A. et al. Comparing the complete protein sets of worm and yeast: orthology and divergence. Science (in press). Botstein, D. et al. Yeast as a model organism. Science 277, 1259–1260 (1998). Iyer, V.R. et al. The transcriptional program in the response of human fibroblasts to serum. Science (in press).
37