Handling Live Sensor Data on the Semantic Web Bachelor Thesis of
Thomas Hummel Submitted on the 16 July, 2012 At the Faculty of Economics and Business Engineering Institute of Applied Informatics and Formal Description Methods (AIFB)
Reviewer: Advisor:
Prof. Dr. Rudi Studer Dr. Andreas Harth
Duration: 16 April, 2012 – Home address: Kaiserstuhlstraße 13 79359 Riegel Germany
16 July, 2012 Study address: Pfinztalstraße 65 76227 Karlsruhe Germany
KIT – University of the State of Baden-Wuerttemberg and National Laboratory of the Helmholtz Association
www.kit.edu
iii
Declaration of Academic Integrity I hereby declare that this bachelor thesis has been written only by the undersigned and without any assistance from third parties. Furthermore, I confirm that no sources have been used in the preparation of this thesis other than those indicated in the thesis itself.
............................................... Location/Date/Signature
iii
v
Abstract - English The increased linking of objects in the Internet of Things and the ubiquitous flood of data and information require new technologies in data processing and data storage in particular in the Internet and the Semantic Web. Because of human limitations in data collection and analysis, more and more automatic methods are used. Above all, these sensors or similar data producers are very accurate, fast and versatile and can also provide continuous monitoring even places that are hard to reach by people. The traditional information processing, however, has focused on the processing of documents or document-related information, but they have different requirements compared to sensor data. The main focus is static information of a certain scope in contrast to large quantities of live data that is only meaningful when combined with other data and background information. The paper evaluates the current status quo in the processing of sensor and sensor-related data with the help of the promising approaches of the Semantic Web and Linked Data movement. This includes the use of the existing sensor standards such as the Sensor Web Enablement (SWE) as well as the utilization of various ontologies. Based on a proposed abstract approach for the development of a semantic application, covering the process from data collection to presentation, important points, such as modeling, deploying and evaluating semantic sensor data, are discussed. Besides the related work on current and future developments on known difficulties of RDF/OWL, such as the handling of time, space and physical units, a sample application demonstrates the key points. In addition, techniques for the spread of information, such as polling, notifying or streaming are handled to provide examples of data stream management systems (DSMS) for processing real-time data. Finally, the overview points out remaining weaknesses and therefore enables the improvement of existing solutions in order to easily develop semantic sensor applications in the future.
v
vi
Abstract - Deutsch Die zunehmende Vernetzung von Objekten zum Internet der Dinge und die ubiquit¨are Flut von Daten und Informationen erfordern neue Technologien in der Datenverarbeitung und Datenhaltung unter insbesondere auch im Internet und dem semantischen Web. Aufgrund der menschlichen Grenzen in Datenerfassung und -auswertung werden immer mehr automatische Verfahren verwendet. Vor allem sind diese Sensoren im weiteren Sinne sehr genau, schnell und vielf¨ altig einsetzbar und k¨onnen zudem eine kontinuierliche ¨ Uberwachung auch an f¨ ur Menschen schwer zug¨anglichen Stellen erm¨oglichen. Die traditionelle Informationsverarbeitung hat sich allerdings auf die Verarbeitung von Dokumenten oder dokumenten¨ ahnlichen Informationen konzentriert, die jedoch andere Anforderungen als Sensordaten besitzen. Im Vordergrund steht hier vor allem die statische und abgegrenzte Information im Gegensatz zu großen Mengen von live Daten, die nur durch die Verbindung mit anderen Daten und bestehendem Wissen Aussagekraft erlangen. Die Arbeit evaluiert den aktuellen Status Quo bei der Verarbeitung von Sensor- und sensor¨ahnlichen Daten durch die vielversprechenden Ans¨atze des semantischen Web und der Linked Data-Bewegung. Dies beinhaltet den Umgang mit den bisherigen Sensor-Standards wie dem Sensor Web Enablement (SWE) oder der Nutzung verschiedener Ontologien. Anhand einer vorgeschlagenen abstrakten Vorgehensweise zur Entwicklung einer semantischen Anwendung, von der Datensammlung zur Pr¨asentation, werden wichtige Punkte wie die Modellierung, die Bereitstellung und das Auswerten semantischer Sensordaten diskutiert. Begleitend zu der Zusammenstellung von wichtigen Arbeiten zu aktuellen und zuk¨ unftigen Entwicklungen in Bezug auf bekannte Schwierigkeiten von RDF/OWL, wie der Handhabung von Zeit und Raum oder physikalischen Einheiten, veranschaulicht eine Beispielanwendung die wichtigsten Punkte. Dar¨ uber hinaus werden Techniken zur Verbreitung der Daten wie Polling, Notifying oder Streaming diskutiert, um schließlich auf Beispiele von Data Stream Management Systems (DSMS) zur Verarbeitung von Echtzeitdaten einzugehen. ¨ Letztendlich zeigt der umfassende Uberblick dieser Arbeit verbliebene Schw¨achen auf und erm¨oglicht somit die Verbesserung existierender L¨osungen, um in Zukunft einfach funktionale semantische Sensoranwendungen entwerfen zu k¨onnen.
vi
Preface This document is part of the bachelor thesis of Thomas Hummel at the Karlsruhe Institute of Technology1 . Additionally a demo implementation2 for research purposes was implemented and a presentation for the members of the Institute of Applied Informatics and Formal Description Methods (AIFB)3 of the Faculty of Economics and Business Engineering4 is obligatory for the final assignment. Thomas Hummel attended courses in the field of Business Engineering5 at the Karlsruhe Institute of Technology. These contained amongst others: Knowledge Management, Semantic Web Technologies I&II and Service Analytics. Furthermore he worked as a student assistant at the Research Center for Information Technology (FZI)6 in the Information Process Engineering Division7 , covering topics such as the Semantic MediaWiki8 or Business Wikis. The advisor of the work is Dr. Andreas Harth9 and the reviewing professor is Prof. Dr. Rudi Studer10 , both active researchers in the Semantic Web context. More information on their publications and projects can be found on the referenced websites.
1
Karlsruhe Institute of Technology (KIT): http://www.kit.edu/ Demo implementation: http://projects.hummel-universe.net/semanticsensorwerb 3 Institute of Applied Informatics and Formal Description Methods (AIFB):http://www.aifb.kit.edu/ 4 Faculty of Economics and Business Engineering: http://www.wiwi.kit.edu 5 Business Engineering: http://www.wiwi.kit.edu/english/studienProgWiing.php 6 Research Center for Information Technology (FZI): http://fzi.de/index.php/en 7 Information Process Engineering Division: http://fzi.de/index.php/en/research/ research-divisions/information-process-engineering-ipe 8 Semantic MediaWiki: http://semantic-mediawiki.org/ 9 Dr. Andreas Harth: http://www.aifb.kit.edu/web/Andreas_Harth/en 10 Prof. Dr. Rudi Studer: http://www.aifb.kit.edu/web/Rudi_Studer/en 2
vii
Contents
1. Introduction 1.1. About the topic . . . . . . . . . . . . . . . . . . . . . . . . . . . . . . . . . . 1.2. Research Questions . . . . . . . . . . . . . . . . . . . . . . . . . . . . . . . . 1.3. Structure of the document . . . . . . . . . . . . . . . . . . . . . . . . . . . .
1 1 3 3
2. Sensors, Sensor Data and the World Wide 2.1. Definition . . . . . . . . . . . . . . . . 2.2. Main Characteristics of a Sensor . . . 2.3. Short Classification of Sensors . . . . . 2.4. Use Cases for Sensors on the Web . . 2.5. Existing Sensor Standards . . . . . . .
. . . . .
5 5 5 6 7 8
Web . . . . . . . . . . . . . . . . . . . .
. . . . .
. . . . .
. . . . .
. . . . .
. . . . .
. . . . .
. . . . .
. . . . .
. . . . .
. . . . .
. . . . .
. . . . .
. . . . .
. . . . .
. . . . .
. . . . .
3. Sensor Data in the Semantic Web and Linked (Open) 3.1. Target . . . . . . . . . . . . . . . . . . . . . . . . . 3.2. Semantic Technologies . . . . . . . . . . . . . . . . 3.3. Existing Approaches and Ontologies . . . . . . . . 3.3.1. Sensor Ontologies . . . . . . . . . . . . . . . 3.3.2. APIs . . . . . . . . . . . . . . . . . . . . . . 3.3.3. Summary . . . . . . . . . . . . . . . . . . .
Data . . . . . . . . . . . . . . . . . . . . . . . .
. . . . . .
. . . . . .
. . . . . .
. . . . . .
. . . . . .
. . . . . .
. . . . . .
. . . . . .
. . . . . .
. . . . . .
9 9 10 11 11 12 12
4. Example – Aviation Weather Data 4.1. Data set . . . . . . . . . . . . . . . . . . . . . . . 4.1.1. Requirements . . . . . . . . . . . . . . . . 4.1.2. NOAA and the Aviation Weather Center 4.1.3. Meteorological Airfield Report . . . . . . 4.1.4. Aircraft reports . . . . . . . . . . . . . . . 4.2. Other Data Sources . . . . . . . . . . . . . . . .
. . . . . .
. . . . . .
. . . . . .
. . . . . .
. . . . . .
. . . . . .
. . . . . .
. . . . . .
. . . . . .
. . . . . .
. . . . . .
. . . . . .
. . . . . .
. . . . . .
. . . . . .
13 13 13 14 14 15 15
5. General approach and structure of code 5.1. Modular structure of code . . . . . . 5.2. Stakeholders . . . . . . . . . . . . . . 5.3. Defining targets . . . . . . . . . . . . 5.4. Example . . . . . . . . . . . . . . . .
. . . .
. . . .
. . . .
. . . .
. . . .
. . . .
. . . .
. . . .
. . . .
. . . .
. . . .
. . . .
. . . .
. . . .
. . . .
. . . .
17 17 18 19 20
6. Collecting and Modeling Sensor Data 6.1. Collecting . . . . . . . . . . . . . . . . . . . . . . 6.1.1. File . . . . . . . . . . . . . . . . . . . . . 6.1.2. Database . . . . . . . . . . . . . . . . . . 6.1.3. Web Service . . . . . . . . . . . . . . . . . 6.1.4. Other Services . . . . . . . . . . . . . . . 6.2. Modeling . . . . . . . . . . . . . . . . . . . . . . 6.2.1. Adressing the Limitations of RDF/OWL .
. . . . . . .
. . . . . . .
. . . . . . .
. . . . . . .
. . . . . . .
. . . . . . .
. . . . . . .
. . . . . . .
. . . . . . .
. . . . . . .
. . . . . . .
. . . . . . .
. . . . . . .
. . . . . . .
. . . . . . .
21 21 21 22 22 22 22 22
ix
. . . .
. . . .
. . . .
. . . .
. . . .
. . . .
x
Contents 6.2.2. Location . . . . . . . . . . . . . . . . . 6.2.3. Time . . . . . . . . . . . . . . . . . . . 6.2.4. Units . . . . . . . . . . . . . . . . . . 6.2.5. Document Information . . . . . . . . . 6.2.6. Multidimensional Data and Statistics 6.2.7. Ontology Engineering . . . . . . . . . 6.3. Conversion . . . . . . . . . . . . . . . . . . . 6.3.1. Annotation of existing Data . . . . . . 6.3.2. Conversion into Triple Format . . . . 6.3.3. Database Mapping . . . . . . . . . . . 6.4. Example . . . . . . . . . . . . . . . . . . . . . 6.4.1. Data Source Analysis . . . . . . . . . 6.4.2. Modeling . . . . . . . . . . . . . . . . 6.4.3. Conversion Method . . . . . . . . . . .
7. Accessing the Data 7.1. APIs . . . . . . . . . . . . . . 7.2. Static Data Access . . . . . . 7.2.1. Polling . . . . . . . . . 7.3. Live Data Access . . . . . . . 7.3.1. Notifying . . . . . . . 7.3.2. Streaming . . . . . . . 7.4. Storage . . . . . . . . . . . . 7.4.1. Direct Conversion . . 7.4.2. File . . . . . . . . . . 7.4.3. Database/Tripe Store 7.5. Example . . . . . . . . . . . .
. . . . . . . . . . . . . .
. . . . . . . . . . . . . .
. . . . . . . . . . . . . .
. . . . . . . . . . . . . .
. . . . . . . . . . . . . .
. . . . . . . . . . . . . .
. . . . . . . . . . . . . .
. . . . . . . . . . . . . .
. . . . . . . . . . . . . .
. . . . . . . . . . . . . .
. . . . . . . . . . . . . .
. . . . . . . . . . . . . .
. . . . . . . . . . . . . .
. . . . . . . . . . . . . .
. . . . . . . . . . . . . .
. . . . . . . . . . . . . .
. . . . . . . . . . . . . .
24 24 24 24 25 25 25 25 25 25 25 25 26 26
. . . . . . . . . . .
. . . . . . . . . . .
. . . . . . . . . . .
. . . . . . . . . . .
. . . . . . . . . . .
. . . . . . . . . . .
. . . . . . . . . . .
. . . . . . . . . . .
. . . . . . . . . . .
. . . . . . . . . . .
. . . . . . . . . . .
. . . . . . . . . . .
. . . . . . . . . . .
. . . . . . . . . . .
. . . . . . . . . . .
. . . . . . . . . . .
. . . . . . . . . . .
. . . . . . . . . . .
. . . . . . . . . . .
. . . . . . . . . . .
29 29 29 29 30 30 31 31 31 32 32 32
8. Querying and Visualizing 8.1. Handling Semantic Sources . . . . . . . . 8.1.1. Data at Rest . . . . . . . . . . . . 8.1.2. Data in Motion . . . . . . . . . . . 8.2. Elementary Applications . . . . . . . . . . 8.3. Preferable Mashups for (moving) Sensors 8.4. Example . . . . . . . . . . . . . . . . . . .
. . . . . .
. . . . . .
. . . . . .
. . . . . .
. . . . . .
. . . . . .
. . . . . .
. . . . . .
. . . . . .
. . . . . .
. . . . . .
. . . . . .
. . . . . .
. . . . . .
. . . . . .
. . . . . .
. . . . . .
. . . . . .
. . . . . .
35 35 35 36 36 37 38
9. Evaluation 9.1. Describing sensors in RDF/XML . . . . 9.2. Describing measurements in RDF/XML 9.3. Live data handling . . . . . . . . . . . . 9.4. Developer benefits . . . . . . . . . . . . 9.5. Stakeholder benefits . . . . . . . . . . . 9.6. Example evaluation/Lessons learned . .
. . . . . .
. . . . . .
. . . . . .
. . . . . .
. . . . . .
. . . . . .
. . . . . .
. . . . . .
. . . . . .
. . . . . .
. . . . . .
. . . . . .
. . . . . .
. . . . . .
. . . . . .
. . . . . .
. . . . . .
. . . . . .
. . . . . .
41 41 41 42 42 42 43
. . . . . . . . . . .
. . . . . . . . . . .
. . . . . . . . . . .
. . . . . . . . . . .
. . . . . . . . . . .
. . . . . . . . . . .
. . . . . .
10.Conclusion
45
Bibliography
47
Appendix A. METAR Field Description . . . . . . . . B. PIREP Field Description . . . . . . . . C. RDF-Conversion Properties Sample File D. KML-Output Properties Sample File . .
x
. . . .
. . . .
. . . .
. . . .
. . . .
. . . .
. . . .
. . . .
. . . .
. . . .
. . . .
. . . .
. . . .
. . . .
. . . .
. . . .
. . . .
. . . .
. . . .
. . . .
51 51 53 56 57
Contents E. F.
xi
Instructions for Generation of Kml files . . . Time Measurements of Example Application F.1. Conversion of CSV to RDF . . . . . . F.2. Generation of KML files . . . . . . . .
xi
. . . .
. . . .
. . . .
. . . .
. . . .
. . . .
. . . .
. . . .
. . . .
. . . .
. . . .
. . . .
. . . .
. . . .
. . . .
. . . .
. . . .
58 61 61 63
1. Introduction 1.1. About the topic We all live in a highly development world with uncountable numbers of information and communication technology. At the moment there does not seem to be an end in sight. Moreover, the spread of mobile computers like smartphones and tablets is increasing. With those devices not only the processing power comes to the daily lives but sensors as well. People are able to track their life and organizations tend to collect loads of data in their warehouses. In 1999 the Businessweek published an article with the title: The earth will don an electronic skin [Gro99]. They say that the skin “processes immense amounts of data on temperature, pressure, humidity, and texture. It registers movement in the air, gauges the size of objects by the distance between points of contact, alerts us to danger, and prepares us for pleasure.” Furthermore they predict that the 21th century will bring an electronic skin to the world that “consists of millions of embedded electronic measuring devices: thermostats, pressure gauges, pollution detectors, cameras, microphones, glucose sensors, EKGs, electroencephalographs. These will probe and monitor cities and endangered species, the atmosphere, our ships, highways and fleets of trucks, our conversations, our bodies–even our dreams.” According to them, there will be a change in life for each human being that nobody can really think of today. The system will not be replace the people, but it will consist of some necessary intelligence, that is able to filter relevant information and to adapt new situations automatically. One important step is that the information in the world wide web will be processable by machines, that they can communicate with each other and that they can detect connect different sources automatically. There are efforts in reasoning, data mining and data analysis. Even though these parties share a common vision, the short term goals are very different but the each party might benefit of the other approaches. The traditional objectives in programming and data management primarily handle information that has been created by people. It may be texts, tables or pictures. That information is useful only for humans on the other side, because it is extremely complicated for machines to retrieve information from unstructured data. At this point the Semantic Technologies try to fill the gap. Enriching the existing data with semantic metadata enables machines to detect relations between resources and can
1
2
1. Introduction
infer implicit knowledge out of it. Data Mining techniques might enable machines to access even some form of unstructured data and they get even better if they have a good base of existing knowledge to detect parallels and related information. Thinking of automated systems autonomous actions can be processed in various ways. Data can be aggregated, examined and evaluated and might much more valuable in the future. People can be informed about abnormal events or they can get a better overview than before. According to Kevin Ashton, called the inventor of the term Internet of Things, people concentrated on writing ideas into the web up to now. [Ash09] These thoughts and information are supposed to be less important for our daily lives compared to things. We cannot eat bits and they do not give heat in the winter. People gather information about things but unfortunately they have limited time and may not be accurate enough to track everything. Therefore the scope of the existing technologies has to be extended. Sensors can monitor objects instead of humans, they can produce data more accurate, faster, always and nearly everywhere. That means that there are amounts of data that top everything that is existing at the moment and the data will be produced live and has to be handled in (nearly) realtime. Furthermore the description of the data producers should be good enough to evaluate the value of data or to find related sensors that produce similar data. In the vision of the electronic skin sensors might even form dynamic autonomous networks and can react on environmental changes. As Research in the field of the Semantic Web treats in large parts the handling of information that is produced by humans, the existing technologies do not always match with the requirements for machine data processing. For example, regarding the position of an information in space and time, there are many problems to handle that in owl. Triples do exist or do not exist, but they have no timestamp. Sensor data is relevant for specific locations or regions and the new triples can refer to another location each instant of time. Furthermore query languages like SPARQL do not support time or location parameters. Additionally, even if a Linked Data stream would exist, what is not really supported by traditional architectures like REST, many Linked Data parsers and reasoners are not able to process the data, not even talking about steaming that processed data again. But the first step is to provide the data in formats that can be used for information retrieval systems: Developing sensor ontologies and spread their use is a major task. Secondly existing non-semantic data has to be converted or annotated to extend the global data basis. This data has to be transferred throughout the web and most probably be stored for future access. Finally there have to be applications that create value out of the data and produce new knowledge or help humans with that task. And the machines should be able to assist humans in the real world with knowledge they retrieve from the world wide web. As there is no overview about what is relevant for handling sensor data in the Semantic Web and many projects are currently active, this thesis gives an overview on the the latest approaches in research about semantifying the world wide web. Therefore the traditional sensor data published by organizations all over the world will be connected with the new technologies even though many approaches fit for the traditional information handling as well. In the end the state of the art will have been evaluated in the sense of current possibilities because it is common sense that the vision of the electronic skin with its artificial intelligence is far away from reality at the moment - and maybe even in the future.
2
1.2. Research Questions
3
A position paper covering many of the relevant Linked Data parts but not the sensor data is Linked Stream Data: A Position Paper [SC09]. They list some other related articles.
1.2. Research Questions Referring to the title Handling Live Sensor Data on the Semantic Web that includes publishing, integrating and visualizing of sensor data in combination with Linked Data, there are at least three important aspects to cover: How to handle ... • ... sensor data. What types of (traditional) sensors can be identified? What do they have in common? Can they be classified somehow? What future development can be forecasted? • ... the Semantic Web. What kinds of representation do we need? How can you link the sensor data? Are there sensor ontologies and how expressive are they? • ... live data. How to handle live data in the Semantic Web? What solutions exist? Can one reach nearly real-time? • ... the combination of all? What is important in the development process? Which parts should be focused on? Because of the focus on the combination of all elements, this document will provide a sample proceeding on developing a semantic web application that handles sensor data. However, the live data plays an essential role because of the lack of research in that area. Furthermore there are other important aspects such as spatial or temporal data that are closely related to the common use cases of sensor data. Nonetheless this work cannot cover the basics of semantic web technologies such as RDF or OWL. Some references for important basic knowledge will be provided but the readers should be familiar with some of the fundamentals. For practical studies and a demo project, data of the NOAA’s Aviation Weather Center11 is utilized.
1.3. Structure of the document This document starts with an introduction that points out the significance of providing sensor data in the web. This topic is treated mainly in the first two chapters: Chapter 2: Sensors, Sensor Data and the World Wide Web gives a simple overview over sensors that could be possibly linked now or in the future and in what field of usage the data would be useful. This will include also some concrete examples as well. Chapter 3: Sensor Data in the Semantic Web and Linked (Open) Data presents a look into the existing Semantic Web. What (public) data is there already present and what ontologies have been developed already to describe sensors and sensor data. After that a sample application will be developed alongside the general theoretical research results to give a glance at what can be realized in reality and to give a little motivation to future semantic content providers. 11
NOAA’s Aviation Weather Center: http://www.aviationweather.gov/
3
4
1. Introduction
Chapter 4: Example – Aviation Weather Data provides a short introduction to the demo application. Furthermore the tools used are presented in a short overview. The following chapters will contain the theoretical findings alongside to the main development steps of our example. Chapter 5: General approach and structure of code treats the proposed basic approach and explains the general modular structure of a semantic web application handling sensor data. Chapter 6: Collecting and Modeling Sensor Data starts with identifying and analyzing sensor data and the conversion to an appropriate RDF output. Difficulties in the several steps will be adressed and solutions will be provided. Chapter 7: Accessing the Data goes on with one of the main challenges of this work: the data access. How do you provide live data in the semantic web? Do you want to use Polling, Notifications or Streams? Which approach is best for which solution? Chapter 8: Querying and Visualizing should bring down the whole example to a round figure. For that reason a small example of how to use the new data was developed – data will be queried and some visuals will be created out of it. In the end the results will be examined and an evaluation on some important points as well as an outlook will be given. Chapter 9: Evaluation reflects the main results of the whole process, in particular on how good sensors and measurements can be described in RDF/XML, the complexity of development in general and the different stakeholder benefits. Furthermore some lessons learned will be pointed out. Chapter 10: Conclusion is meant to be a summary of the state of the art and gives a prognosis of the trend.
4
2. Sensors, Sensor Data and the World Wide Web 2.1. Definition There are several definitions for sensors; most often they describe the observation of “a physical quality (temperature, depth, etc) of a feature (a lake) and report observations”[CHN+ 09] but in a looser way one could also refer to “a data source which produces a sequence of data items over time”[LPH09]. In [HPST09] a sensor is only seen as a certain procedure to produce data. Those loose definitions, however, do not focus on the ’classical’ view of a sensor as a physical device that measures a single physical quantity. In fact, there may be several use cases where the measured data is already aggregated in a virtual sensor like a platform or digital mashup with several physical sensors that act as a single sensor. Furthermore non-physical measurements like CPU load, GPS or even camera pictures can be addressed with the latter definition. This allows the utilization of many sensors with similar features and characteristics. Nonetheless, the main focus in this work will be on the observations of physical devices that measure physical quantities. It is is easier to concentrate on a restricted set of items, even if most of the characteristics equal the nature of the extended second sensor definition.
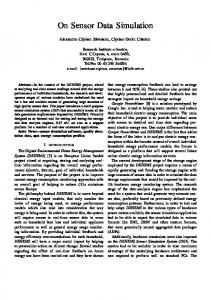
2.2. Main Characteristics of a Sensor Overall there are two main elements a sensor consists of: First there is the sensing device or platform and its specification and secondly there are the measurements and observations of this sensor basis, both often referred to as sensor data. See for example the specifications for a temperature sensor by AADI in figure 2.1 for measuring the water temperature. If someone is searching for a sensor that can be used in a specific environment the operating temperature, operating depth or the dimensions may be important. For someone who deals with the measured data it may be more useful to use information about the resolution or accuracy of the generated data. In general the information relevant for future utilization of the generated observation data is the location of the sensor. Even if the location in restricted environments can be very detailed and complex, this thesis will concentrate on the geo-referenced information only.
5
6
2. Sensors, Sensor Data and the World Wide Web
Figure 2.1.: AADI Temperature Sensor 4880/4880R However, it is be possible that the location is changing over time, for example when the sensor is attached to a car. Then the positions can be seen as an additional measurement and must be observed. Very important for analyzing the data beyond that are the instants of time when the observation was made, since time is used most often as a dimension for evaluating or visualizing data. Furthermore, most measured values, especially physical, are useless without the corresponding units (unless one is in a separated environment). These three main attributes should be kept in mind when working with sensor measurements and observations. In some cases the influence of accuracy is very important, too; in particular when there are scientific evaluations. Here considering a possible change of the accuracy under certain circumstances is important. If one assumes the correct implementation and use of the sensor, most of the other technical details tend to be redundant. It may be useful to keep operating ranges or response times in mind.
2.3. Short Classification of Sensors The classification of sensors in a holistic way is cumbersome and will not lead to a huge improvement in handling sensor data. Nonetheless, there are some points that might be good to know.
6
2.4. Use Cases for Sensors on the Web
7
First of all there is the accessibility of the data: Are specifications and measurements publicly available or is there restricted access because of privacy, security or commercial purpose? Directly connected to that question is the second point: Which role plays the sensor owner? Is it a scientific organization, a company or even a private person? This gets even more complicated if one goes into usage rights an licenses.This often depends from the field of application like described in a classification scheme derived from a Hitachi Research Laboratory communication[Whi87]. Automotive, Energy, Health or Transportation are mentioned, for example. Weather measurements are an example for globally publicly available data whereas positions of mobile phones may be difficult to collect. In this thesis there are two additional characteristics that play a significant role, as mentioned in the previous section: Does the sensor move or is it geographically fixed? And how important are fast update rates or is it a real-time sensor?
2.4. Use Cases for Sensors on the Web Publishing sensor data in digital formats for further processing with Information and Communication Technology is a common use case. Therefore an easy way is using the world wide web that allows remote control of sensors as well as an automated aggregation of measurement data. Automated actions on behalf of specific events are far from vision. Some people tend to speak of the Internet of Things (see 1.1 About the topic) that tracks products with RFID codes and sensor data. If we had some automatism, things could be identified by machines and collect data about them with sensors, technology would be able to notify us about necessary repair or help us to use resources more effective and efficient. And the global trend is following these ideas: On this years CeBIT trade show, one of the largest computer expos in the world, one main topic has been the smart home. The five subtopics are Home Automation, Home Networks, Home Entertainment, Smart Grid/Energy Management and Home Appliances/Design12 . Especially the influences of the Smart Grid will be interesting in the future, because machines will be able to use energy when its cheapest or when regenerative energy can be used. Another use case of the ambient assistant living solutions would be the automatic opening of the windows for air refreshment and closing them when it begins to rain. Moreover, a third example is the opening of the garage when one comes home by car and after that the front door unlocks automatically as well. Automated systems in cars are another recent topic in the news in Europe. From 2015 onwards every new car should contain an automated emergency call system, named eCall. In the case of an accident, the system will automatically send necessary information via internet to the ambulance13 . And this is only a start: The car 2 car communication consortium14 is trying to achieve standards in inter-vehicle communication systems for safety, ecological and efficiency reasons. Regardless of these interesting designs and developments much data is generated already. Navigation systems collect data of velocities or routes and share them amongst each other, 12
CeBIT Smart Home http://www.cebit.de/en/about-the-trade-show/programme/cebit-life/ smart-home 13 heise.de: eCall http://www.heise.de/newsticker/meldung/eCall-Auto-Notruf-soll-ab-2015-fuer-Pkwverbindlich-werden-1631991.html 14 car 2 car communication consortium http://www.car-to-car.org/
7
8
2. Sensors, Sensor Data and the World Wide Web
to avoid traffic jams or inform the driver about security risks. Indeed, traffic jams are sometimes detected due to mobile phone devices and their movements in certain regions15 . The last example topic will be the private use of sensor data. People are able to track their sports activities with their smartphones16 , share their weight/muscle amount on fitness networks17 or let their apps automatically post music, pictures, activities or locations to the world wide web1819 . There are many more samples, but these show several aspects of sensor categories, data that may never be published for free or data that might become very important in the future. What semantifying of the data can achieve, will be discussed in the later.
2.5. Existing Sensor Standards Concerning the combination of sensors and their integration into the web, there is mainly one standard used: The Sensor Web Enablement (SWE)20 by created by the Open Geospatial Consortium (OGC), a member of the w3c. They define five main fields developed relying on standards of the IEEE or other organizations to enhance the creation of reusable technologies. Observations & Measurements (O&M) - “The general models and XML encodings for observations and measurements.” Sensor Model Language (SensorML) - “standard models and XML Schema for describing the processes within sensor and observation processing systems.” PUCK - “Defines a protocol to retrieve a SensorML description, sensor ’driver’ code, and other information from the device itself, thus enabling automatic sensor installation, configuration and operation.” Sensor Observation Service (SOS) - “Open interface for a web service to obtain observations and sensor and platform descriptions from one or more sensors.” Sensor Planning Service (SPS) - “An open interface for a web service by which a client can 1) determine the feasibility of collecting data from one or more sensors or models and 2) submit collection requests.“ Descriptions taken from http://www.opengeospatial.org/ogc/markets-technologies/swe
Concerning the topic of existing live data systems, the inproceeding Providing near Realtime Traffic Information within Spatial Data Infrastructures [MSZ09] seems to be interesting. They state that “Service Oriented Architectures (SOA) constitute the main paradigm for developing GI21 applications nowadays”. In this case the SOS is used.
15
Bild der Wissenschaft - Mit Handys gegen den Stau http://www.bild-der-wissenschaft.de/bdw/ bdwlive/heftarchiv/index2.php?object_id=31994303 16 Android App Sports Tracker http://www.androidpit.de/de/android/market/apps/app/com. sportstracklive.android.ui.activity.lite/SportsTracker-by-STL 17 Health Graph API http://blog.runkeeper.com/new-feature/health-graph 18 Google+ Party Mode http://support.google.com/plus/bin/answer.py?hl=en&answer=2618786 19 Pearson: Using Facebook and Spotify togetherhttp://www.quepublishing.com/articles/article. aspx?p=1833572&seqNum=2 20 OGC - Sensor Web Enablement http://www.opengeospatial.org/ogc/markets-technologies/swe 21 Editors Note: GI = Geographic Information
8
3. Sensor Data in the Semantic Web and Linked (Open) Data First of all semantic technologies are just another kind of handling data and their success depends on how widely they are used. Nonetheless, there are some difficulties with traditional file or data formats and content handling that are addressed with semantics. This chapter will also give a short introduction on the technologies and will then focus on existing sensor ontologies.
3.1. Target Without describing semantic technologies in detail this section treats some basics, since they are relevant for the whole work and addresses the question whether we actually need semantics or not. According to [Pil10] “the main limitation for a concrete realization of Sensor Web appears the lack of standardization that make the interoperability among systems a hard challenge also considering the functional interoperability environment provided by last generation web services”. Traditionally the structure of a file (binary or csv) or its syntax (xml) is used to access the contents and extract or transform the data. The description of the data can be found in specification documents that have to be written and maintained for every data format and the tools have to be customized for exactly that formats. With the use of some standardized xml-documents data exchange in selected fields is becoming easier. Nonetheless, it even may be very complicated to merge two standards. The semantic technologies try to add a meaning to every resource, regardless on the position in a hierarchy or structure of a file. One often talks about Linked Data, because the main idea is to describe data with the help of other data that is described already. This avoids redundancy and leads to more efficient ways of working. On the one hand, a data provider can concentrate on the core data and on the other hand a data consumer does not need to handle several different data formats. Additionally the semantics can be processed by machines, in comparison to specifications in pdf format, and the use of crawlers provides the opportunity of collecting more informative or additional data.
9
10
3. Sensor Data in the Semantic Web and Linked (Open) Data
Even if machines are not able to understand the data they can detect correlations and infer hidden knowledge. With the help of some custom algorithms they sometimes even seem to understand the data and can perform useful actions. Besides wonders in artificial intelligence, one can imagine many ways of data selection, data preparation or data presentation, ranging from dynamically faceted searches to the analysis of complex, previously unknown, connections in the data.
3.2. Semantic Technologies In this thesis the selected semantic web technologies defined by the w3c are RDF and OWL.It is assumed that the reader has some basic knowledge of them, otherwise more detailed information can be found in [HKR09] or [HFBPL09], for example. RDF and OWL share many common characteristics so that this thesis tries to handle them as one technology whenever possible. Concerning a special use case one might need the expressivity of OWL Full or the clarity of RDF combined with the different inference possibilities. Some difficulties in relation to the usage with sensor data come up when trying to model events in time and space, two of the important values describing a measurement. The traditional handling of the data works well when describing single facts. One example might be something like ex:AngelaMerkel rdf:type ex:Bundeskanzler Here the problem is that Angela Merkel is only Bundeskanzlerin (federal chancellor) of a certain country (Germany) and for a certain time interval (since 2005 until now). Bundeskanzler could fit as well to the head of states of Austria or Switzerland or historic German federations and is not intended to describe only the current persons in charge but also the former people in charge. This however can not easily be modeled in a simple triple. There are several possible solutions, some described in chapter 6 (Collecting and Modeling Sensor Data). If one would just collect data for a certain field one could work with that, for example with some more detailed properties like ex:presidentOfTheUS, but if it comes to data in motion like you have with sensor data, every new statement is only usable with the related observation time and sometimes location. Hence a solution has to be found. Unit handling is another difficult aspect of current standards. At the moment there is official support for xml-schema datatypes but it lacks physical units. Some solutions will be presented as well in chapter 7 (Accessing the Data). One additional fact that every developer or modeler should bear in mind is the open world assumption and the non-unique name assumption, maybe in combination with blank nodes. This is important for modeling and even more necessary to consider when debugging unexpected behavior when reasoning. Especially blank nodes can be problematic in inference whereas one should keep in mind that URIs describing a resource are only allowed to describe a single resource whereas two different URIs do not necessarily refer to distinct resources. Thus using resolvable URIs as recommended there might be the necessity to distinguish the URIs somehow, for example by the use of OWL2 keys.
10
3.3. Existing Approaches and Ontologies
11
3.3. Existing Approaches and Ontologies Since the years around 2005 experts have tried to develop approaches to semantify the sensor data. In the state of the art two main approaches are used to describe sensor data: Annotating existing formats or converting to raw RDF/OWL triples. Most often the annotation is used when working with already standardized conventional formats, especially the Sensor Web Enablement (SWE) xml-files. Languages used for that are for example XLink or RDFa that can link to semantic web ontologies and therefore enable the Linked Data functionality. A short example of annotation is provided in the following code-example of [SHS08]. Listing 3.1: Example for Annotating SWE-XML with RDFa 2008−03−08T05:00:00
3.3.1. Sensor Ontologies Of course one needs a sensor ontology as well and the expressivity depends on it mainly. Nonetheless there are some difficulties when describing more complex data in comparison to a total conversion that does not require a predefined structure and can also use other source formats. Concerning the existing ontologies there are many different targets as well. The main difference seems to be the description of sensors and networks in contrast to observations and measurements. Pileggi is proposing A Noval Domain Ontology for Sensor Networks [Pil10] that provides the ability of describing detailed sensor characteristics like the location of a sensor host, the sensor in relation to the host and the possible change of these positions over time. Additionally one could define communication modes or energy supply as well as the nature of the sensors itself (multisensors). This could be used when searching for sensors for a certain purpose. A outstanding approach in describing the structure of sensor networks is done with the SWAMO Ontology that is intended to create intelligent agents “for collaboration between multiple sensor systems”[UPWS11]. Observations and Measurements as defined in the SOS are implemented very minimalistic “for minimal compliance with the standard”. Eleven sensor ontologies from 2009 or older have been evaluated by Compton et al. [CHN+ 09] in range and expressivity as well as reasoning and search technology. According to them “the state of the art is some way from the the vision for semantic networks”. This is reasoned especially because of the lack of ontologies that cover most aspects of sensor data including measurement data. The most advanced ontologies in that category seem to be CSIRO [CNTT09, NC09] and OntoSensor with a slightly different focus. A combination of them is said to represent the current level of expressive capability for semantic sensors. Most evaluated ontologies used a sensors perspective and are missing observation models. Besides OntoSensor the ontologies Avancha [APJ04] seems to provide a useful base of observation handling including data/observation features, accuracy and support for units. They also propose the results of Florian Probst who concentrated on semantifying the observation and measurement standards of the OGC. [Pro06, Pro08] Many of the authors of the existing ontologies formed an Incubator group at the w3c to develop a new ontology, the SSN-XG[CBB+ 12] ontology that is used nowadays by many new projects and might be the future de-facto standard ontology for sensor networks,
11
12
3. Sensor Data in the Semantic Web and Linked (Open) Data
because of their spread and closeness to the SWE standards. A sample definition of an accelerator device is shown in the following code listing: Listing 3.2: Example of a SSN-XG device description (RDF/OWL) Accelerometer is a subclass of sensing devices which measures acceleration. The individual describing a physical quality ”acceleration” is defined in the imported MyMobileWeb ontology of measurement units. To align the MyMobileWeb ontology with the SSN ontology, the class muo:PhysicalQuality from the MyMobileWeb ontology is defined as a subclass of the class ssn: Property.
According to [TCL11] the SSN-XG ontology design offers four identfiable perspectives: • “Sensors, with a focus on what senses, how it senses, and what is sensed;” • “Data, with a focus on observations and metadata;” • “Systems, with a focus on systems of sensors; and” • “Features, with a focus on physical features, properties of them, what can sense them, and what observations of them are made.”
3.3.2. APIs Finally there is still the question of how to access the data in the ontologies. SemSOS [HPST09] is following the existing standards and tries to combine the existing service API with a semantic backend. This means that traditional queries like “DescribeSensor”, “GetObservation” and “GetCapabilities” are transformed into SPARQL queries to retrieve the information out of the knowledgebase. The response is using the standard xml-schema for observations and measurements and is semantically annotated with XLink, using a self-developed O&M-OWL-Ontology. In 2011 Page et al. [PFN+ 11] proposed a prototype of a Web API relying on REST and Linked Data principles in combination with the SSN-Ontology. The High-Level API for Observations (HLAPI)-platform allows to provide several representations and serializations of the data, including non-semantic formats, and supports several additional URIs like /latest or /summary for special requests.
3.3.3. Summary Summarized the way of annotating existing structures like SWE might lead to fast results. Using traditional semantic web methods, however, might keep the interoperability between different fields better what is very important in that environment. Some important aspects on the modeling will be discussed in chapter 6 (Collecting and Modeling Sensor Data) whereas the discussion about accessing is dealt with in chapter 7 (Accessing the Data). In particular there will be the question on how to implement live transfer of data.
12
4. Example – Aviation Weather Data Example The focus of this chapter lies on the demo web application that contains some example implementations of the topics covered in this thesis. In detail the decision for the sensor data of NOAA’s aviationweather.gov will be provided combined with a description of the data sources. Concrete implementations will be presented in the following chapters that discuss the theoretical solutions first and an applied solution afterwards.
4.1. Data set 4.1.1. Requirements For most developers the following requirements will be obsolete, because they will use a predefined data set. However, for demonstration purposes some characteristics of the data are important: Use publicly available data Everybody should have the opportunity to follow the steps throughout the whole application. Especially the processed data should be accessible, for example reuse of code for training purposes is facilitated. Use simple data Easy understandable data reduces unnecessary complicated code structures in the example code and the reader can focus on the important points. Moreover, if the data is self-explanatory, one does not need much effort to understand the examples. Use data that is expandable Since this is a semantic web topic, most data will be linked and enriched with other data sources. Demo data should provide the ability to create easy usage scenarios and mashups. In case of the sensor data one could determine some additional statements: Use sensor data with at least one measurement unit The purpose of sensors is to provide measurements. Even in a sample application the handling of the different formats and units should be mentioned. Use frequently updated data An additional characteristic of sensor-measurements is that they happen several times and the observation time matters most often. Therefore a timestamp would be useful and, furthermore, the performance topics can be treated. This also leads to thoughts about the necessity of live or even real-time usage of the data.
13
14
4. Example – Aviation Weather Data
Use geo-located sensors or data The location of the measurement is important in many cases. Geo-location will suit for many scenarios in an open system. Moreover the usage of moving sensors adds another interesting fact to be concerned.
4.1.2. NOAA and the Aviation Weather Center The National Oceanic and Atmospheric Administration (NOAA)22 of the United States Department of Commerce does research in many fields of oceans, atmosphere and the climate. One department called the National Weather Service (NWS)23 operates the Aviation Weather Center24 . This center provides forecasts and warnings for the global aviation and publishes several measurements that focus on temperature, wind speeds, icing, visibility and many more. Furthermore the data is used by pilots for their pre-flight briefings.[U.S12] Since the weather is probably one of the most topics spoken of, it is predestined for demo data. Furthermore one can think of a huge amount of usage scenarios. Therefore two datasets have been chosen: the METAR data and the aircraft reports. Each of the data sets will be described more detailed in the following sections. Both data sets have in common that they contain time stamps as well as geo-coordinates for each measurement. Even if the observation intervals can be irregular the latest data is updated every five minutes and can be accessed as csv- or xml-file. The dataserver 25 contains descriptions about all offered data sets and queries for historic data as well as current data files26 . For further reference, the Aironautical Information Manual covers huge parts of the data pilots use and create [U.S12].
4.1.3. Meteorological Airfield Report The Meteorological Airfield Report (METAR) is a standardized format for local reports or local special reports (SPECI) of weather observations and forecasts. Standards and regulations necessary for global aviation are set by the International Civil Aviation Organization (ICAO)27 , an agency of the United Nations (UN). A METAR report represents an hourly observation of a specific site regarding several climatic conditions manually or automated. Most often the location is an airport, represented by its ICAO-Code. the measurements are published as custom string that contains further information about location, observation time, temperature, wind speed and many more. However, in this example a preprocessed csv-file is used - the detailed field description can be found in the Appendix (Table A.1). (See also [U.S05] and [U.S12]) Important aspects for utilization of this data source in the example are: • ICAO airport codes are widely used, so further information about airports like departure times or encyclopedic facts could be aggregated. • The sensors are not moving but are fixed to a certain location. This allows the easy monitoring of a specific place over time. Furthermore it might facilitate geographic searches in the data. 22
NOAA:http://www.noaa.gov/ NWS: http://weather.gov/ 24 Aviation Weather Center: http://aviationweather.gov/ 25 Dataserver: http://www.aviationweather.gov/adds/dataserver 26 Current data files: http://www.aviationweather.gov/adds/dataserver/current 27 ICAO: http://www.icao.int/ 23
14
4.2. Other Data Sources
15
• Many applications can be found that allow analysis of METAR data and can serve as model for useful semantic mashups. See NOAA’s Java Tool or Meterradar.com The current data set, with observations of the past hour, contains relative constantly more than 4000 measurements of different airports with 44 possible single data values. Hence around 350 new measurements are added in every update interval.
4.1.4. Aircraft reports The second data source for the demo application are the aircraft reports that contain either Pilot Weather Reports (PIREPs) or Aircraft Reports (AIREPs). The data of these reports must only be published if there are special conditions like thunderstorms, turbulences, bad visibility or dramatic changes in weather conditions. The reported string fields differ slightly from the METAR fields and more details on the preprocessed format structure can be found in the Appendix (Table B.2). (See also [U.S98] and [U.S12]) Important aspects for utilization of this data source are: • Aircrafts are moving objects (with an additional altitude) that make great demands on the processing application. Maybe even the tracking of a specific aircraft would be possible. • The data is as easy to interpret as the METAR data. However, a real-life task would be the automatic generation of warnings for aviation. • Many observations are sent in the region between Canada and Greenland over the North Atlantic Ocean. Here the use of spatial queries could be interesting. The current data set, with observations of the past ninety minutes, contains highly fluctuating numbers of measurements but during the last analyses always significantly below 1000, because they are requested or transmitted most often only in special situations. Thus one can state that there will be less than 100 new measurements on average every update interval. In contrast to the METAR data the appearance of the same sensor/aircraft multiple times has a higher probability.
4.2. Other Data Sources Another marine example is provided with the data of http://www.marinetraffic.com: ”‘The system is based on AIS (Automatic Identification System). As from December 2004, the International Maritime Organization (IMO) requires all vessels over 299GT to carry an AIS transponder on board, which transmits their position, speed and course, among some other static information, such as vessel’s name, dimensions and voyage details.”’ One is allowed to query every two minutes while the received data is updated in their system in real time.
15
5. General approach and structure of code In this chapter some fundamental procedures on how to develop a semantic web application will be presented. Firstly there will be a short explanation of the proposed structure of implementations and secondly there will be listed some possible stakeholders. After that some fundamental questions for preparing a semantic web project and finally the decisions in our sample program are mentioned.
5.1. Modular structure of code Semantic web technologies with their standardized exchange formats make it easy to work with modular software. On the one hand this enables software developers to use several distinct programming languages as well as platforms that fit best for the particular task. For example one could use Python to process text sources and use Java for the RDF handling, as in the tutorial by Bob DuCharme[DuC10]. On the other hand the development process can focus on single modules. Therefore agile software development practices suit very good and can provide quick results as well as constantly expendable fragments of the application. The proposal of a theoretical structure of a sensor data processing semantic web application is shown in the following schema. Thus three main modules can be identified in figure 5.1: data collection, data access and further processing of the data. Data storage may be seen as module number four but it is not necessary in all cases. Every module will be discussed in detail in the corresponding chapter. Literature researches propose very similar structures: Hebeler et al. propose an architecture diagram for aggregating disparate data sources with the layers “Data sources”, “RDF Interfaces”, “Domain Translation” and “Knowledgebase” [HFBPL09, p. 468]. This model is a subset of the newly proposed modules “Collecting” and “Storing” and may be convenient for some use cases. Additionally the focus on aggregating different sources in one model and would perfectly fit in the new modules of the further processing. An additional architecture is proposed for the Linked Sensor Middleware by Le Phouc et al. [LPNMQXH11]
17
18
5. General approach and structure of code
Figure 5.1.: Proposed modular structure for a semantic sensor data web application
5.2. Stakeholders This abstract architecture proposal is very flexible and is good for a step-by-step or partially implementation of the modules. There are many different stakeholders that might not be interested in implementing a holistic application. Case 0: Sensor Data Provider A data provider maintains sensors and owns the data sources. Most often the data is used for internal use and therefore prepared for that purpose. Existing data formats tend to not containing semantics or semantic annotations. Sensor Data Provider are typically scientific or governmental organizations, because they publish their data to the web. (e.g. NOAA28 Dealing with all possible sensor owners these might as well be organizations or even private persons. Case 1: Semantic (Sensor) Data Provider Adding semantics to the sensor data is the task of a semantic data provider. The better they work together with the sensor owners, the more accurate the results will be. Most sensor data provider fear the complexity of annotating or converting their data, because effort increases with complexer sensor structures and dependencies. Modeling depends not only on the input data, possible use cases have to be sorted out to find appropriate ontologies and other Linked Data to map with. Designing models that fit to the data and choosing the correct ontologies is one of the most time consuming tasks. However, the interlinked data serves as basis for further processing. The better the data is presented, the more valuable it will be. Nowadays many conversions are done by the semantic web community and corresponding research institutes. Nonetheless, in the future sensor owners might publish their data as RDF/OWL right away. Case 3: Data Manager Working with the data requires storage and access strategies in order to facilitate to generate knowledge out of several sources. Data Manager try to collect data from several sources, create mappings between ontologies and resources and store the data in customized databases for quick access. Different accessing and querying possibilities enable programmers to use the best way to get the data, without the need of searching for data that matches the existing one. Dbpedia29 could be seen as data manager, since it collects data from the various Wikipedias and links different topics. Most often famous content provider serve as starting points for crawls since many ontologies try to reuse the terms and models. A 28 29
NOAA http://noaa.gov.us Dbpedia http://dbpedia.org
18
5.3. Defining targets
19
data manager could also aggregate thematic data to reduce the effort for individuals to crawl the web on specific topics. Case 4: Data Analyst Many developers use existing data and, except for quality and trust, they do not care about the sources and the steps done before. They rely on the division of labor and their task is to create results from the data. Thus they would like to choose their querying method and process, enrich or evaluate the received data. This group of the stakeholders generates new knowledge and is therefore very important. They sometimes use complex data mining and knowledge retrieval methods and should generate additional value. Therefore the data basis must be good enough. These examples of stakeholders are stereotypes and make discussions about the importance of different modules easier - they are most often not distinct actors. Even though, this example shows the common ground each stakeholder works with: Ontologies and data exchange formats as well as the APIs to access data. This means that the modeling of the data is one of the most important steps in the whole process. Bad models will lead to bad results. Reusing popular ontologies will facilitate the reuse of the data by others. Of quite similar importance are the exchange formats. Since there are many standardized formats like RDF/XML or query-languages like SPARQL, a stakeholder should not have problems handling it. Nonetheless, the data access can be more complex. Using RESTful web applications is an easy step whereas the use of services, especially to handle live data, can be an intricate structure. Especially for sensor data scenarios the live aspect is very important and the presence of new data must be communicated fast enough. At the moment there exist no de-facto standards in the semantic web environment. Some possible solutions are discussed in the chapter 7 (Accessing the Data), but they often do require a customized interface.
5.3. Defining targets In the following chapters several implementation-approaches of each modul will be discussed. Depending on the goals there are different ways that seem useful. However, there are some very important questions one should bear in mind before implementing an application in addition to the stereotypes defined in the section before. Despite of the general discussion for and against semantic technologies, one could mention the following categories of questions: • Scope of the data – How many measurements will be generated? – How often are there new measurements? – Is it useful to enrich data with important information at the beginning? • Usage of the data – Will the data be used in a whole most probably or will there be many customized queries on parts of the data? – Will a client access the data once or is continuous access important? – Is it important to keep a history of the data or is there a high significance of the latest measurements only?
19
20
5. General approach and structure of code • Time, effort and expenses – How detailed and accurate should the data be mapped? (Units, Accuracies, Dependencies, ...) – How much manual interaction should be needed for reasoning and inferring? – How much load does the content providing architecture stand?
Example
5.4. Example A short overview about the general tools used for developing will be shown here. Specific libraries or tools will be mentioned in the corresponding chapter. Credits go to all the developers and supporters of the various utilities, even those not mentioned here. Java is used in throughout the whole application. A mixture of programming languages in reality is possible and might be useful to use the different strengths. https://www.java.com/ Eclipse is the main IDE for developing the application. http://www.eclipse.org/ Notepad++ suits perfectly for smaller tasks. http://notepad-plus-plus.org/ GIT/TortoiseGit is used for version control. Hosted on bitbucket. http://git-scm.com/ https://code.google.com/p/tortoisegit/ https://bitbucket.org/ Dropbox helps for files not under version control. https://www.dropbox.com/ Google App Engine with the local Jetty server serves as gate to the web. Eclipse integration is available beside loads of documentation. https://developers.google.com/appengine/ TEXnicCenter and LYX are used for the thesis. http://www.texniccenter.org/ http://www.lyx.org/ JabRef collects all the useful references to literature. http://jabref.sourceforge.net/ Not to forget all the boards, tutorials and examples in the web. One important destination probably is stackoverflow.com.
20
6. Collecting and Modeling Sensor Data
Whether or not there is a physical sensor it is assured that there is already some sensor data existent in a proprietary format. This chapter deals with the handling of the data source as well as the modeling of the data for the following conversion.
Figure 6.1.: Schematic view of the module Collecting and Modeling
6.1. Collecting In the first step of a semantic sensor web application the data has to be collected. There are basically three different types of sources that one could have to handle: Files, databases and (web) services, either with semantics or without and either static or live. It is assumed for this section that there is not RDF/OWL source data. The question about the semantics gets relevant in the Querying and Visualizing chapter, even though it might already be relevant at this point in reality.
6.1.1. File A file source is most often updated in a certain interval and has to be polled each time. Sometimes a modified-since header or an expiration-header can reduce traffic as well as the use of a notification-service could do. More about that can be found in the following chapter. Another characteristic of files is that always the whole file has to be transmitted and most often even the new (live) data is appended to the existing file.
21
22
6. Collecting and Modeling Sensor Data
6.1.2. Database Databases provide the possibility to filter for useful data and reduce load with customized queries. Most often a result can be provided in various formats, sometimes there is even the possibility to avoid converting the whole data and use a connector that allows SPARQL queries on the relational database (see section 6.3 Conversion). Apart from that the most effort is the database query with SPAQRL, SQL or another query language.
6.1.3. Web Service The handling of web services depends on their architecture and API. Sometimes it is possible to request a response-format that can be converted easily later on. Very interesting is the possibility of streaming even though this requires a more complex structure. It even might be one of the fundamental sensor data processing requirements.
6.1.4. Other Services Depending on how the data of the sensors is distributed one might need special protocols or architectures. Especially when there is no sensor middleware and the devices are sending their data on a low-level basis. In all cases it is good to avoid too much load on the source servers. Sometimes they have to block clients for that. Giving the application a meaningful identifier and providing contact information would be a nice touch.
6.2. Modeling In the second step the measurements are modeled. Depending on the sensor ontology that has been chosen for modeling the sensor features there are many preferred modeling techniques for the measurements as well. Sometimes sensor ontologies provide support for modeling observations, but depending on the topic one might want to link as well to existing ontologies, like weather or even dbpedia. Some ontologies address important aspects and difficulties of the modeling in a certain way. Here some solutions are presented in a detached form that cover the basic problems of the expressivity in RDF/OWL as determined in chapter 3 (Sensor Data in the Semantic Web and Linked (Open) Data).
6.2.1. Adressing the Limitations of RDF/OWL In general the problems of time and space and units have have to be covered, because each new measurement will be done in a new environment. However, handling those issues can be complicated. 6.2.1.1. N-ary Properties A heavily discussed solution in many other use cases, as well, is the use of n-ary predicates that can contain more information than a regular triple. For example one could define with some sort of annotations or a special syntax: ex:sensor ex:hasTemperature "10"^^xsd:Double @unit(ex:celsius) @time(2012-01-01) @latlong(10,51) that – for example there were some approaches in the Semantic Desktop community30 . See also 31 30 31
Semantic Desktop Nepomuk http://www.semanticdesktop.org/ontologies/ Defining N-ary Relations on the Semantic Web http://www.w3.org/TR/swbp-n-aryRelations/
22
6.2. Modeling
23
6.2.1.2. Blank Nodes A solution that definitely works is the use of blank nodes for a measurement. A benefit is indeed that blank nodes are seen as distinct resources. Unfortunately adding information to that node later is difficult and so is reasoning and querying. If the structure is known, however, most actions are possible. A code example could look like this: Listing 6.1: Example measurement using blank nodes (Turtle) ex:sensor ex:hasMeasured [ ex:hasTime ”2012−01−01”ˆˆxsd:datetime; geo:lat ”55”; geo:long ”55”; ex:hasTemperatureCelcius ”105”; ]
6.2.1.3. EventWeb Not significantly different is the idea of the EventWeb. Here the measurement event itself is in the focus of the design and brings some benefits. The Eventweb[Jai08, SP08] focuses primarily on a happening at a certain time or time frame and location. The view on the data is more in the way people’s mind works and less object orientated. Assuming that a single measurement is seen as an event, because of the “eventdriven nature of sensor readings”[PFN+ 11], there is no problem with adding relevant data to that event. Exchanging the blank node with a unique URI, one could model something like the following: Listing 6.2: Example measurement using EventWeb-desgin (Turtle) ex:measurementEvent12345 ex:hasTime ”2012−11−10T090807”ˆˆxsd:datetime; geo:lat ”55”; geo:long ”55”; ex:hasTemperatureCelcius ”105”; ex:hasWindSpeedMph ”22”; ex:wasPerformedBy ex:sensorXxX;
The URI for that event allows automatic reasoning as well as the possibility to resolve that URI to receive all existing information. Depending on the generation of the URI (random or semantic), it would be possible to add data parallel or in distributed architectures, although the further processing should not rely on the name of the URI, since URIs should not contain information read by machines. Future additions are also possible, for example quality control remarks or inferring results. A human-friendly URI could be something like http://example.org/id/measurements/2012/01/01_15h34m12s, but this should only simplify life for the developers. Quite often the measurement data is the most used data and therefore the nature of the sensors are not relevant. This design integrates good into the existing structures and technologies. Depending on the scenarios one might want to define that each measurement is different from the others, referring to the non-existing Unique Name Assumption. A great amount of observation and measurement ontologies use the Eventweb style but restrict every event to a single physical measurement. Then one could avoid properties with the unit encoded in the name and add something like ex:measurementEvent12345 ex:hasUnit ex:Celcius.
23
24
6. Collecting and Modeling Sensor Data
6.2.2. Location Regardless to where location information is written, however, there are some additional aspects that are important. Not all measurements refer to one point. Think of a basin with a temperature that is identical in the whole basin. One might want to describe this with the help of a geometric form, e.g. a polygon, then a more detailed model might be useful. Thinking of future queries it might even be useful to use a descriptive format even for points (e.g. geo:Point). If furthermore, by accident, two or more Points are added to a measurement resource, the allocation of the corresponding latitude and longitude is impossible. See also the w3c basic wgs84 geo vocabulary32 , NEOGEO 33 or GeoRSS34 . Especially when handling with altitudes there are loads of different standards that might to lead to problems when using a different standard, like the wgs84.
6.2.3. Time The time information focuses very similar problems. Here the time can be an instant, point or an interval, for example. Two different time properties can lead to confusion as well if they do not describe different events like “observation time” and “local observation time”. Here the w3c provides a good solution with the use of OWL-Time35 . A good solution would be to use a custom URI like “ex:hasObservationTime” that is described in detail when getting resolved, to avoid bloating up the data.
6.2.4. Units Finally the handling of units can be a problem as well, since there is no standard existing at the moment. Many ontologies try to define units in their measurement events, as described above. At the moment this seems to be the best solution, because there is no other widely used approach. The SSN ontology, for example, ”‘does not contain its own model for these concepts and does not restrict the user in the choice of an ontology to model them.”’ They propose36 the MyMobileWeb Measurement Units Ontology37 , the QUDV ontology38 or the QUDT ontology39 . This usage of ”‘value containers”’ is described in Semantic Web Programming[HFBPL09, p. 483ff] as ”‘one of the most flexible, explicit and correct approaches to associating units of measurements with literals values”’. Two other possibilites are the use of unit-specific properties and datatypes or the reification of statements (RDF) respectively annotation properties (OWL).
6.2.5. Document Information A little note on annotating the data with document information will close this section. Here one could use the VoiD-Vocabulary40 that is “intended as a bridge between the publishers and users of RDF data, with applications ranging from data discovery to cataloging and archiving of datasets.” This might be interesting in order to provide information about authors, publishers or subjects of the dataset. 32
W3C Basic Geo Vocabulary http://www.w3.org/2003/01/geo/ NEOGEO http://geovocab.org/doc/neogeo.html 34 GeoRSS http://www.georss.org/simple 35 OWL-Time www.w3.org/TR/owl-time 36 Report Work on the SSN ontology http://www.w3.org/2005/Incubator/ssn/wiki/Report_Work_on_ the_SSN_ontology 37 MyMobileWeb Measurement Units Ontology http://purl.oclc.org/NET/muo/muo 38 QUDV ontology http://www.omgwiki.org/OMGSysML/doku.php?id=sysml-qudv:quantities_units_ dimensions_values_qudv 39 QUDT ontology http://qudt.org/ 40 VoiD http://vocab.deri.ie/void/ 33
24
6.3. Conversion
25
6.2.6. Multidimensional Data and Statistics Regarding sensor data, the RDF Data Cube Vocabulary 41 could fit even more since it builds on the VoiD-Vocabulary and others. Indeed it is intended to describe multidimensional data like statistics to allow further processing in spreadsheets or OLAP, what is a common use case for sensor data.
6.2.7. Ontology Engineering When developing a new ontology no one should forget to get some knowledge in ontology engineering before and to prove the validity of the results afterwards. For example aligning the ontology to an upper ontology would be a good factor for reuse.
6.3. Conversion Given the case that the source on hand has no semantics there are three possibilities to enrich the data: Annotation, Conversion in Triple-Format or Storage of the data in a relational database and convert on request.
6.3.1. Annotation of existing Data Annotating the data works best when they are in a standardized format, because then the annotation process gets easier. Like described in [CHN+ 09] or [HPST09] RDFa or XLink are good choices for annotating XML. They used it in combination with SWE XMLs (SensorML and O&M - see section 2.5 Existing Sensor Standards). Using the Linked Sensor Middleware [LPNMQXH11] one can annotate XMLs even in the user interface.
6.3.2. Conversion into Triple Format Converting data into a triple-format tends to be the common use case. However, the great variety of different files and files structures does not allow to use generic approaches. However, in some restricted use cases this might be possible - see for example the generic CSV-conversion in the demo example (6.4.3). Indeed many standard formats can be converted with open-source implementations. See for example the RDF file converter overview42 or the RDF importers and adapters43 .
6.3.3. Database Mapping The third option is generating an RDF vocabulary directly out of a database schema or to map it manually is very useful for existing data. According to [LPNMQXH11] “existing triple stores can not efficiently handle high update rates”. Therefore relational databases have been used with the purpose to avoid a time-consuming complete conversion and store the data directly. The provided mapping allows running SPARQL queries on the database similar to the usage in [PFN+ 11]. Likewise other implementations for SPARQL or RDF exist and are listed in the w3c-wiki.44
6.4. Example
Example
6.4.1. Data Source Analysis Basic descriptions of the data sources can be found in chapter 4 (Example – Aviation Weather Data): A five minutes update interval of each csv-file source has been mentioned, so we could poll the updated files in that intervals. 41
RDF RDF 43 RDF 44 RDF 42
Data Cube Vocabulary http://www.w3.org/TR/vocab-data-cube/ file converter overview http://www.w3.org/wiki/ConverterToRdf importers and adapters http://www.w3.org/wiki/RDFImportersAndAdapters and SQL http://www.w3.org/wiki/RdfAndSql
25
26
6. Collecting and Modeling Sensor Data
The new files contain all the data of the past hour (METAR) or one-and-a-half (aircraft reports) and only the latest ones should be processed. In the csv-files the measurements are sorted descending by observation time, so the most recent updates will be at the beginning of the file. In order to stay flexible the top n lines are read while another possibility would be to detect which observations are really new. This allows us to reuse the query classes easily for testing whether there is new data or not. In production use it might be efficient to select the new measurements at the beginning or to remove them when they already exist in the database, for example. Both example observation files contain timestamps as well as geo-located points of the measurements taken, so that the most important data is on hand. The aircraft reports have their altitude as special information, because there are several practices on how to measure altitudes. To keep the example simple, only temperature data will be converted and the rest is ignored, even if it would be not much effort to convert the other data additionally.
6.4.2. Modeling Since the demo application is intended to show the whole process and point out some important points and not to act as a full-featured data provider, the time consuming process of modeling was reduced significantly. The only consumer of the data is the corresponding visualization, so that no additional linking is necessary. The quick and dirty approach assigns all the data values to a measurement event defined by latitude, longitude and time. Unit handling is furthermore intended to be treated with property name (hasTemperatureC). Listing 6.3: A sample output of a METAR measurement (Turtle) @prefix @prefix @prefix @prefix @prefix
hup: . hupm: . geo: . hu: . xsd: .
hupm:measurement cc3707d5−cc54−4805−b15a−c06dc27f508c> a hu:measurement ; hup:hasObservationTime ”2012−05−18T01:25:00Z”ˆˆxsd:dateTime ; hup:hasStationID ”KSTK” ; hup:hasTemperature c ”25.0”ˆˆxsd:double ; geo:lat ”40.62”ˆˆxsd:double ; geo:long ”−103.27”ˆˆxsd:double .
Besides the quick and dirty approach the custom properties could be properly defined and interlinked with other ontologies in their description-files that can be retrieved by resolving their URL or using external mappings. Depending on the use case some SWRL rules might have to be used.
6.4.3. Conversion Method A direct conversion to RDF/XML can be done very generic, so that the properties for each field in the csv are defined in a configuration file. (see Appendix -> RDF-Conversion Properties Sample File)
26
6.4. Example
27
Furthermore rad RDF/XML is produced besides the formats supported by the Jena Framework like Turtle or N3. So far no storage solution is needed and the decision on that can be made according to the access requirements in the next chapter. The concrete process, implemented in Java, reads the source file, crops some information at the beginning and converts the csv to a String-array Java-list with the help of the openCSV-framework45 . After that the list will be parsed and each data value with its corresponding property will be added to a Jena Model. There might be the option to add some more complex structures, but this has to implemented hard-coded at the moment. It might be useful for basic definition of time and space, for example.
45
openCSV http://opencsv.sourceforge.net/
27
7. Accessing the Data Accessing the previously converted data is one of the main targets a semantic sensor data application should be focused on. Three common access methods can be determined: Polling, Notifying and Streaming.
Figure 7.1.: Schematic view of the module Accessing
7.1. APIs First the developer has to decide which fundamental principles to use for data access. As described in chapter 2 (Sensors, Sensor Data and the World Wide Web) existing sensor networks are based on service architectures like the SOS of the SWE. This architecture provides specific functions for a certain environment. Especially communication between sensor networks could be improved using technologies like SOAP. Developments like SemSOS extend existing service structures and provide backwards compatibility as well as the option to use Linked Data. Alternatively there is the REST architecture with prominent use in combination with the semantic web. The focus on well-described stateless methods and the resource orientation fits well with the Linked Data Principles46 . RESTful architectures are lightweight and easy reusable. The resources can be identified and linked with their corresponding URIs and are therefore a good choice to manage information.
7.2. Static Data Access 7.2.1. Polling Polling is the standard action used to obtain resources in the web. Talking in REST terms, a client sends a GET message to the server. Using specific headers one can request special 46
Linked Data Principles http://www.w3.org/DesignIssues/LinkedData.html
29
30
7. Accessing the Data
response formats and the server can deliver meta information about the response (e.g. expiration times or sizes). Standard implementations are redirects or other status codes for communication over http with a standardized vocabulary. In particular, the client can request a certain resource multiple times without side-effects like state changes.[Til09]. An architecture based on polling lacks informing the client on changes even if there are possibilities save resources on polling requests when nothing has changed. The implementation is straight forward because of the presence in every framework or tool. Developing a RESTful application needs some additional effort but is not complicated. Since the proceeding of live data is one of the scenarios sensors are in, it is important to provide support for that in the web architecture. Polling in fixed intervals is useful if those intervals are known before and the data that has to be fetched is not too much. Handling customized requests asking for modified data only are difficult but could be achieved with a service structure that filters data according its data, for example. A possible solution would be an Atom/RSS-Feed that informs about new data and saves traffic due to its size.
7.3. Live Data Access Polling however does not allow the server to open up a connection. According to a blog post47 of Phil Leggetter, a developer focused on real-time applications, there are three ways of publishing live-data in the web: • ”If you want your data in real-time you should use a persistent connection between the publisher and subscriber.” • ”If you are making a server to server subscription to data that does not update all that often and instant real-time doesn’t matter then PubSubHubbub is fine.” • ”If you are making a server to server subscription to data that updates very frequently then you need to use a persistent connection and XMPP PubSub is a must.”
7.3.1. Notifying In that sense a good extension to polling is to enable communication between server and client, especially when the update interval is asynchronous. That way traffic is reduced and the load on the server is minimized.The idea is to use a notification service that sends out messages from the server to the registered clients and triggers a polling mechanism. thus existing technology with all its benefits can be kept and only has to be extended by a service on the client side. However, that form of a listener must be a server that is active the whole time and servers behind firewalls can lead to problems. Furthermore the communication messages are not standardized, even if the protocol is. Additionally new data could also be sent over the new push-communication. Furthermore a notification architecture is very scalable when new hubs are added. 7.3.1.1. XMPP One solution would be the instant messaging protocol XMPP. Besides other features the XMPP Standards Foundation proposes their Publish-Subscribe draft48 because of the classic observer pattern that allows the server to send one message to multiple subscribers. Since “XMPP is a fairly complex standard, which is often too heavy for the limited resources of embedded devices used in sensor networks.”[GTMW11] there is a similar pubsub protocol that tends to get into the focus of developers: Pubsubhubbub. 47
XMPP PubSub or Pubsubhubbub for real-time server push? http://www.leggetter.co.uk/2010/09/ 17/xmpp-pubsub-or-pubsubhubbub-for-real-time-server-push.html 48 XEP-0060: Publish-Subscribe http://xmpp.org/extensions/xep-0060.html
30
7.4. Storage
31
7.3.1.2. Pubsubhubbub The Pubsubhubbub protocol49 allows publishers to notify a hub about new content and directs the spread including subscription handling to the hub. Moreover different categories are supported and clients can register for specific ones. In the context of the semantic sensor web architecture is used for example in the Linked Sensor Middleware[LPNMQXH11]. Pubsubhubbub uses the idea of WebHooks. That means HTTP posting data to an HTTP endpoint’s callback URL.50 51
7.3.2. Streaming Streaming data is the closest option to real-time data handling. Existing Linked Data technologies have to be extended to be able to process live data. Besides using nonstandards technologies like the WebHooks there are some ideas on how to stream linked data. See for example the blog post by Greg Brail in retrospect to the ReadWriteWeb real-time summit.52 There are many ways to stream data. Most probably one will produce RDF/XML and is therefore able to use XML streaming solutions like the Streaming API for XML (StAX)53 . Furthermore there are the new HTML5 WebSockets5455 or, as Google provides on App Engine, the Channel API 56 with Comet-style that might be replaced with WebSockets later on. Sometimes even an HTTP-connection is left open and the server continues to send new data. However, the most complicated part is to parse streaming data. Some examples of Data Stream Management Systems (DSMS) are provided in section 8.1 (Handling Semantic Sources) in the following chapter. They most often can create streams on their own to create stream networks.
7.4. Storage Depending on the application’s objectives and the chosen access method one or more of the three options might fit for the storage solution. For the sake of completeness some short discussion is provided here.
7.4.1. Direct Conversion First of all no storage solution is required at all. This might be preferred when only live data is required and the amount of queries is limited. With the help of caching techniques the load could be managed efficiently. Restrictions are primarily that due to the need for caching only uncustomized access is possible if there are many requests. Additional post-processing possible so that specific data access can be implemented in a later stage. This would also be a good solution for streaming when only a limited number of clients receives the data and provide their access methods. 49
Pubsubhubbub https://code.google.com/p/pubsubhubbub/ What WebHooks are and why you should care http://timothyfitz.wordpress.com/2009/02/09/ what-webhooks-are-and-why-you-should-care/ 51 What are WebHooks and How Do They Enable a Real-time Web? http://blog.programmableweb.com/ 2012/01/30/webhooks-realtime-web/ 52 Greg Brail - Hooks, Sockets and Firehoses: Streaming API Technologies Getting Us to REALLY RealTime http://blog.apigee.com/taglist/Webhooks 53 Streaming API for XML http://stax.codehaus.org/Home 54 websocket.org http://www.websocket.org 55 w3c websocket draft http://dev.w3.org/html5/websockets/ 56 GAE Channel API https://developers.google.com/appengine/docs/java/channel/overview 50
31
32
7. Accessing the Data
Figure 7.2.: Schematic view of the module Storing
7.4.2. File Secondly saving the converted data as file enables the clients to save the URL for later reference. Overview pages enable access to historic files and could facilitate access to parts of the data, depending on the file structures. Notifying solutions fit perfectly but customized queries are inefficient because the whole file has to be parsed first. Besides of that, a storage mirror or an archive could be set up easily.
7.4.3. Database/Tripe Store A database or triple store would be the third option and can provide many benefits. With the matching structure it may be as fast as files and supports customized queries on top while frequent ones could be cached as well. If loads of customized data is generated it even might reduce traffic when only relevant triples are queried and sent instead of whole files. Compared to the previous options the effort for choosing the perfect data server can be very high, not only because of additional functions like SPARQL support but also because of distinct optimizations. On the one hand may be useful to use a write-optimized datastore because of the huge amounts of data generated by the sensors and the live aspect and on the other hand a good query performance seems to be necessary. Sometimes integrated inference methods can speed up the following process when detecting critical measurements or related data. Automatically added statements can simultaneously lead to problems when removing data from the store if they are nested too deep. One could use 4 store57 , cumulusrdf58 or some large triple store that can be found at the w3c wiki59 .
Example
7.5. Example The first decision fell on a REST-Style API that should fit best with existing Linked Data technologies. In Java one could use some existing frameworks like Restlet60 or the reference implementation for JAX-RS61 Jersey62 . In combination with Google App Engine there are some little challenges even if Restlet should work quite well for the basic features, so that some basic implementation like content-negotiation has been implemented with the use of mimeparse63 to handle the accept headers. Resolvable property-URIs allow interlinking with other ontologies. Resolvable measurements are not fully implemented, because live data is not saved at the moment. 57
4store http://4store.org/ cumulusrdf http://code.google.com/p/cumulusrdf/ 59 Large Tripe Stores http://www.w3.org/wiki/LargeTripleStores 60 Restlet http://www.restlet.org/ 61 JAX-RS http://download.oracle.com/otndocs/jcp/jaxrs-1.0-fr-oth-JSpec/ 62 Jersey http://jersey.java.net/ 63 mimeparse http://code.google.com/p/mimeparse/ 58
32
7.5. Example
33
Since the update interval is known to be five minute there is no need to stream data and notifying services would be preferred. “Additionally Google App Engine does not support sending data to the client, performing more calculations in the application, then sending more data. In other words, App Engine does not support ’streaming’ data in response to a single request”64 . Google proposes and supports the use of the XMPP protocol65 whereas the Pubsubhubbub-protocol might have its benefits as well. A high-performance and realtime live streaming, however, would be possible with jWebSocket66 that does not work on App Engine because of the socket restrictions but you can use Tomcat, for example.6768
64
GAE Java Servlet Environment https://developers.google.com/appengine/docs/java/runtime GAE Using the XMPP Service https://developers.google.com/appengine/articles/using_xmpp 66 jWebSocket http://jwebsocket.org/ 67 jWebSocket in Webapps http://jwebsocket.org/howto/ht_webapp.htm 68 jWebSocket Server on Application Servers http://jwebsocket.org/quickguide/qg_appserver.htm 65
33
8. Querying and Visualizing This chapter gives a short glance at what can be done with the previously prepared sensor data. Since this is the filed where the strength of the Linked Data plays an important role many different applications can be designed and developed. The creativity and realization of future projects in this area will leverage the role of the semantic web. Concerning this, there are many possibilities on what to do with the data and it is only a side topic of this thesis. Nonetheless, it is important for a holistic view on semantic sensor data processing.
Figure 8.1.: Schematic view of the module Further Processing
8.1. Handling Semantic Sources 8.1.1. Data at Rest If one gathers sources like RDF/OWL, some basic semantic technologies like mapping URIs or using a rule language like SWRL69 should be the normal proceeding. The main 69
SWRL: A Semantic Web Rule Language Combining OWL and RuleML http://www.w3.org/ Submission/SWRL/
35
36
8. Querying and Visualizing
challenge is in the connection of different ontologies or maybe also a new one. Furthermore there are many tools like reasoners for static context that can be used so that this should not be a huge problem for anybody with some knowledge in semantic technologies.
8.1.2. Data in Motion But there is a different situation with data in motion: “Data streams differ from conventional stored relational models in several aspects. The data streams not only have data elements arriving continuously but also potentially have unbounded size. Additionally, the order of data elements arriving within a data stream or across multiple data streams is unpredictable and not necessarily arranged. Furthermore, as soon as an element in a data stream has been processed it can be discarded or archived, thus it cannot be no longer easily retrieved, unless it is explicitly stored in memory, which typically is small relative to the size of the data streams. To deal with these characteristics, data stream management systems (DSMS) are designed for monitoring, combining and analyzing and correlating streams of data rather than following the design of traditional data management systems.”[LPH09] In 2011 Le-Phuoc and Hauswirth propose an own query engine for live data: The Continuous Query Evaluation over Linked Streams (CQELS).[LPDTPH11]. In both papers of Le-Phuoc et al. references to more DSMSs can be found, but they seem not to be able to process stream data directly in comparison to CQELS. More information can also be found in a tech report by Le-Phuoc et al. called Unifying Stream Data and Linked Open Data [LPPHH10] Most often streaming, parsing and querying techniques depend on the used DSMS. Usually time windows are used to manage blocks and parse them in a more static context. The smaller the intervals of the time windows are the more real-time proceeding can be achieved. An example is shown in the following listing, that processes the data of the past hour with a sliding interval of 10 minutes with a SPARQL-style query language. Listing 8.1: Example for a C-SPARQL query in [BD10] REGISTER STREAM TotalAmountPerBroker COMPUTE EVERY 10m AS PREFIX ex: CONSTRUCT {? broker ex: hasTotalAmount ? total .} FROM FROM STREAM [ RANGE 1h STEP 10m] WHERE { ? broker ex: from ? country . ? broker ex: does ?tx . ?tx ex: with ? amount . FILTER (? country = ”CH” ) } AGGREGATE { (? total , SUM (? amount ), ? broker ) }
Barbieri et al. use named graphs for handling the time aspect and handle various other methods in their papers [BBC+ 09, BD10, BBCG10, BBC+ 10] Another Approach for Sensor Data Fusion is provided by [ZKA+ 08].
8.2. Elementary Applications Before some concrete examples of mashups will be shown, there will be a discussion about the basic further processing.
36
8.3. Preferable Mashups for (moving) Sensors
37
Three different types can be determined: First there might be the human friendly preparation of the data. Probably there will be most often a sort of graphical representation or visualization to provide a meaningful insight into the measurements. There could be live reports or charts about specific intervals. The second use case is the filtering for important values. This could be the measurements of a certain time in history to explain a happening or the monitoring of live data to extract unexpected changes or predict future trends. This could be used for warning systems or to help scientists with searching for important data. Eventually, the third elementary application follows some of the features the semantic web is famous for: Enrichment of the data with other linked sources. This facilitates the step-by-step integration of sensors, since every new sensor improves the overall results. Furthermore, many applications might exist or data is already modeled. Providing information on how to read the data or compare to existing evaluations can be facilitated and facts about the location, environment or related research can be provided. See for example [LPH09]. These basic activities will lead to a huge number of applications when combined and extended. In some cases the results will be stored and distributed in RDF or OWL again and the proposed module structure and thoughts about how to handle the data can be used again. In the sense of backwards compatibility another scenario could produce traditional data formats.
8.3. Preferable Mashups for (moving) Sensors On the contrary to the examples in chapter 2 (Sensors, Sensor Data and the World Wide Web), where many possible scenarios are mentioned, some additional examples for sensors in particular will be handled in the following paragraphs. Referring to the common features like space and time, many easy but useful presentations come to mind. Regarding to the spatial features, a huge amount of sensors can be shown on a map, so that a user can switch to a place of interest and can gather information with the help of facilitated searches rather quick. One could think of interactive graphics with heat maps or charts for some regions. Without the use of visualization there are many uses cases as well: Filtering the data for several regions for comparison purposes or personalized information on location-based devices. Some examples could be: • Weather warnings like used in aviation already. The Fraunhofer Institute wanted to proved a location-bases SMS service some years ago7071 and tend to be involved in a disaster warning system recently72 • Traffic jams can be detected and distributed regardless of the systems in a country. Combined with event databases, for example, one could even predict some high traffic times. (something like Google provides with their traffic-data73 see for example the RDF data access use cases by the w3c74 70
WIND - Weather Information on Demand http://www.fokus.fraunhofer.de/de/espri/anwendung/ wind/index.html 71 WINDmobile http://www.fokus.fraunhofer.de/de/espri/anwendung/wind-mobile/index.html 72 Disaster Warning http://www.cio.de/public-ict/communication/2885624/ 73 Google Maps Traffic http://phys.org/news/2011-03-google-users-traffic.html 74 Data Access use cases (w3c) http://www.w3.org/TR/2004/WD-rdf-dawg-uc-20040602/
37
38
8. Querying and Visualizing
Notes on Implementation: There might be some unforeseen problems when matching locations and coordinates. For example, most people will search for specific names like a city, country or region. The extends of this area might be described in Linked Data as well and they are most often polygons, sometimes even with ’holes’ in their area. One should keep in mind that some applications can become very complex. Additionally there are many maps services with good APIs but most require a proprietary format for displaying the data. One approach of a generic RDF mapping tool is map4rdf75 The time aspect on the other hand will most often result in charts similar to those used for website statistics or corporate reports. Here the aspect of live data comes to mind again and should be addressed primarily if needed. Some ideas for mashups are • surveillance with server maintenance software as example could lead to information systems for sensor measurements that can identify temporary fluctuation. • digital homes with electricity monitoring and energy control could be used to start machines automatically when good conditions dominate. Eventually the most appropriate mashup will strongly depend on the data itself. Especially for scientific purposes there are special methods or techniques on how to work with the data. Statistical methods to handle the big data cloud may offer new possibilities and results.
Example
8.4. Example As in the chapters before, Java is used as programming language. Nonetheless the basic ideas can be easily achieved with any other language as well. The target of the implementation is: Providing an RDF data set of measurements, the data values will be displayed in Google Earth. Since the independence of the modules should be kept, the source RDF-files are polled from the previously developed web service, as if it was a external service. The relevant configuration paths and setups are kept in a properties file as in the codeexample in the Appendix (KML-Output Properties Sample File). After filtering the relevant measurement nodes, they are converted into a KML-file. This file can be used in different mapping services and the decision fell on Google Earth, because it provides the possibility to use kml-networklinks that are able to dynamically reload the raw kml-files. This allows us to present the latest data every five minutes automatically. Other refresh options like following the http-expire header are possible as well. Additionally there is a simple data aggregation implemented to demonstrate that as well. For enrichment of the METAR data dbpedia is queried for the names of the airports represented by the ICAO code. The live demo can be found under http://projects.hummel-universe.net/semanticsensorweb /basickml. Alternatively some screenshots in combination with a short instruction can be found in the Appendix. Note on implementation: As already mentioned, Java has been used for implementation and as before Jena framework processed the RDF-files. Reading the provided RDF as file and converting to a Jena model again is a critical performance issue whereas filtering and further processing is quite fast. There has to be used a better solution. 75
map4rdf http://oegdev.dia.fi.upm.es/map4rdf/
38
8.4. Example
39
The creation of the kml-output can easily be done with the Java Kml Framework76 , although it does not work on the Google App Engine due to some dependencies on libraries that are not supported. A quick workaround with creating the kml-xml as a string is implemented and might lead to performance issues with larger data sets. Additionally, as described in the modeling chapter 6 (Collecting and Modeling Sensor Data), the geo-location values are linked in the example directly as lat/long triples with the measurement event.
76
Java Kml Framework http://code.google.com/p/javaapiforkml/
39
9. Evaluation In every single step of this thesis there difficult questions on how to bring sensor data into the semantic web have been addressed already. The following sections rate the whole situation of semantic sensor data and the proposed development process under different angles.
9.1. Describing sensors in RDF/XML There are many approaches of describing sensor types, some as mighty and complex ontologies. Thus most of the common sensors and there data can be described. These descriptions are useful to categorize sensors and to find the appropriate sensors automatically or manually. This facilitates the growth of sensor networks and the crawling of various sensor data. Nonetheless complex influences of sensors on each other or relationships among them are complicated to handle. Automatic reasoning might be hard or impossible when complicated ontologies have to be used. A similar issue comes with some characteristics like accuracy and (allowed) ranges of sensors. These two attributes are often important for scientific research, but they are hard to implement. Customized modeling and processing might be possible in either way whereas automated and independent handling of the data becomes impossible. Moreover, when probabilities come into consideration the use of current tools and models is a challenging endeavor. (see for example [CMP10])
9.2. Describing measurements in RDF/XML Handling the different measurements of sensors strongly depends on the existing ontologies in the corresponding field, even if there are some sensor ontologies that cover measurements and observations as well [Section 3.3 (Existing Approaches and Ontologies)]. Are they wellmodeled and easy to understand or to extend, then they will facilitate extending the data amount in the semantic web. If the focus is on the measurements, the idea of the Eventweb provides a good solution of handling time and space in easy models. It might even allow many forms of reasoning and inferring on the data. Nonetheless complex structures stay complicated and the future development of n-ary predicates might be necessary - not only in the sensor context.
41
42
9. Evaluation
Unit handling leads to another problem, if not addressed in the used ontologies. If modeled with custom properties, reasoning and processing would be kept easy but the combination of different sources or the automatic conversion of units is not practical at the moment.
9.3. Live data handling There seem to exist many projects that try to facilitate streaming of Linked Data. It might not take a long time until there will be solutions that work pretty well, as there are existing solutions in traditional web services already. The difficulty is the interchangeability of the different approaches, one of the former targets of SOA77 . Some standardized interfaces or service descriptions are needed to allow spiders or query processors to use different methods without the need of customized code for each solution. This might as well be an important w3c standard.
9.4. Developer benefits As described in this work, the modular structure of semantic web applications allows developers to concentrate on parts of the software. If they use some different core applications, programming languages or even generic software, they should be very fast and flexible in common use cases. The trending agile development philosophy fits perfectly well the idea of the semantic web. The modeling of ontologies is, however, very time consuming and may be complicated. Some problems mentioned in the first two sections play important roles and there are many others that can be found in literature. Even so, the Linked Open Data community and much of the Web 2.0 enthusiasm as well as the Open Source movement refrains from the ’not invented here’ attitude and reduces the overall effort of modeling ontologies. Using existing ontologies should be capable as well for developers who are not deeply involved in ontology engineering.
9.5. Stakeholder benefits Coming from the developers to the more abstract stakeholders such as data providers, managers or analysts with a special focus on the people or companies that own or maintain the physical sensors. A lot of sensors and sensing devices that could be connected are property of people or companies that might not be willing to share their data for several reasons, especially privacy or money. In case anything else than a scientific or governmental organization should take part in a sensor network they most often don’t want to put much effort or even money in publishing their data, especially if they do not generate any return on invest. This may be the reason for some sensor data publishers to use proprietary formats like a custom csv. The effort is very low and by chance they might be able to sell some specifications on that by chance whereas they do not benefit from putting more effort in publishing Linked Data. The only stakeholders that tend to benefit directly from well-prepared data seem to be the analysts that can generate results with low effort and can present their results on sites with advertisements or can even sell them. Furthermore private data should only be shared in between selected parties, for example business partners, friends or medical institutions. Like with the OAuth used in the pubsubhubbub, there are some existing concepts, but unless they are becoming standard, safe and easy to use, many potential sensor data providers will most probably not participate. 77
SOA - Service Oriented Architecture
42
9.6. Example evaluation/Lessons learned
43
Another important part for managing quality and trust is the use of cryptography or digital signatures. Especially if automatic crawling replaces manual sorting of sources someday, it should be at least traceable who created and altered information, that automatic rating of relevance becomes possible. This would additionally give at least some credits to the stakeholders. See for example [TH10, ANR08] or tRDF78 .
9.6. Example evaluation/Lessons learned When creating the different modules the architecture proposed in chapter 5 (General approach and structure of code) was very helpful due to the abstract structure for different systems. However, Google App Engine restricted work in some ways, because it did not support all frameworks that would have been useful. A Jetty or Tomcat deployment could have been better. Nonetheless, developing demos on App Engine is comfortable, amongst other things because of the good Eclipse integration and their development framework. When referring to the performance of the demo system some lessons learned can be presented. The complete time measurements can be found in the Appendix F (Time Measurements of Example Application). The most important result is that the generated RDF should be saved or cached on the system somehow. The creation of the web-output takes more than half of the total conversion time. Triggering the conversion with a cronjob and caching the result for real requests should be okay. Saving the results in a file or in a triple store could avoid caching problems and should be fast enough as well. Besides of that it may also be useful to cache source files either for the csv2rdf conversion or in the further process (here the kml-creation). Concerning real-time data the best option might be streaming. In the example generating 2.100 triples out of a local csv-source took about 1 second. Real sensors might produce a multiple of that amount and if one aggregates several resources it gets even more important. Regarding the KML-creation the time killer is the creation of the Jena model out of the existing RDF-data since it takes about half of the total creation time. Maybe another framework like the NxParser79 would be better as it supposedly “ate 2 mil. quads ( 4GB, ( 240MB GZIPped)) on a T60p (Win7, 2.16 GHz) in 1 min 35 s (1:18min).” Above all, the integration with dbpedia’s SPARQL-endpoint worked quite well and can be recommended. However, in the data for the sample query might not change that often and therefore the data should be stored locally to avoid unnecessary requests.
78 79
tRDF http://trdf.sourceforge.net/ NxParser http://code.google.com/p/nxparser/
43
Example
10. Conclusion In a summary, it seems that the semantic technologies are ready to set up a net of linked sensors and sensor data, even if some specific use cases might be difficult to handle right now. So, for example, the technologies for live data exist to a certain extend, but there is no global accepted standard that would be necessary for productive use. Additionally the unit-handling is a complex and chaotic barrier that probably prevents some people from using semantic technologies as preferred way of data publication. As long as there will not be easy-to-use frameworks or modeling kits that support less Semantic Web or even programming affine data providers, this field might be limited to science or governmental institutions. A holistic automatic inferring seems to be unlikely for several years and the best way for aggregation and analysis will be the use of custom knowledge bases or data warehouses. The more (de-facto) standards will exist, the better the technology will develop. However, this might be a task for organizations like the w3c. Even if it might be possible to enhance some widely used sensor types with semantics, the vision of an electronic skin could evolve without semantics in great parts at first. See for example, in another context, the mainly syntax-based reasoning of the IBM Watson80 . Reasons for that are certainly the extremely fast development and spread of everyday sensors or sensing devices for cars, households and humans that most probably will produce more data soon compared to existing scientific networks. The community and standardization processes needed for a well-performing Linked Data network will take some time. Furthermore, leveraging the power of the crowd tends to rely on a general focus on quality and trust as an essential factor for the spread of semantic technologies, not to forget copyrights or licensing. Nonetheless, private networks might not be that beneficial for the open data movement at first but, hopefully, as there will be a critical mass of users positive development will result in the commonly accepted use of semantic technologies. Eventually, one should not forget that the communication between sensors or machines is neither the target of the semantic web at this stage nor is it necessary or feasible that all the data is semantified. Anyhow, every additional machine readable content that is 80
http://www-03.ibm.com/innovation/us/watson/index.html
45
46
10. Conclusion
properly semantified will most probably help to manage the torrent of data better and the artificial intelligence might benefit to a high degree as well.
46
Bibliography [ANR08]
S. Alam, J. Noll, and D. Roman, “Semantic policies for service access in mobile supported sensor networks,” in Proceedings of the 2008 Third International Conference on Systems and Networks Communications, ser. ICSNC ’08. Washington, DC, USA: IEEE Computer Society, 2008, pp. 359–364. [Online]. Available: http://dx.doi.org/10.1109/ICSNC.2008.18
[APJ04]
S. Avancha, C. Patel, and A. Joshi, “Ontology-driven adaptive sensor networks,” Mobile and Ubiquitous Systems, Annual International Conference on, vol. 0, pp. 194–202, 2004.
[Ash09]
K. Ashton, “That ’internet of things’ thing,” RFID Journal Expert View, June 2009.
[BBC+ 09]
D. F. Barbieri, D. Braga, S. Ceri, E. Della Valle, and M. Grossniklaus, “C-sparql: Sparql for continuous querying,” in Proceedings of the 18th international conference on World wide web, ser. WWW ’09. New York, NY, USA: ACM, 2009, pp. 1061–1062. [Online]. Available: http://doi.acm.org/10.1145/1526709.1526856
[BBC+ 10]
D. F. Barbieri, D. Braga, S. Ceri, E. D. Valle, and M. Grossniklaus, “Querying rdf streams with c-sparql,” SIGMOD Rec., vol. 39, no. 1, pp. 20–26, Sep. 2010. [Online]. Available: http://doi.acm.org/10.1145/ 1860702.1860705
[BBCG10]
D. F. Barbieri, D. Braga, S. Ceri, and M. Grossniklaus, “An execution environment for c-sparql queries,” in Proceedings of the 13th International Conference on Extending Database Technology, ser. EDBT ’10. New York, NY, USA: ACM, 2010, pp. 441–452. [Online]. Available: http://doi.acm.org/10.1145/1739041.1739095
[BD10]
D. Barbieri and E. Della Valle, “A Proposal for Publishing Data Streams as Linked Data - A Position Paper,” in Proceedings of the Linked Data on the Web (LDOW2010) Workshop, co-located with WWW2010, 2010. [Online]. Available: http://events.linkeddata.org/ ldow2010/papers/ldow2010 paper11.pdf
[CBB+ 12]
M. Compton, P. Barnaghi, L. Bermudez, R. Garcia-Castro, O. Corcho, S. Cox, J. Graybeal, M. Hauswirth, C. Henson, A. Herzog, V. Huang, K. Janowicz, W. D. Kelsey, D. L. Phuoc, L. Lefort, M. Leggieri, H. Neuhaus, A. Nikolov, K. Page, A. Passant, A. Sheth, and K. Taylor, “The ssn ontology of the w3c semantic sensor network incubator group,” Web Semantics: Science, Services and Agents on the World Wide Web, vol. 0, no. 0, p. 7, 2012. [Online]. Available: http://www.websemanticsjournal.org/index.php/ps/article/view/292
47
48
Bibliography
[CHN+ 09]
M. Compton, C. Henson, H. Neuhaus, L. Lefort, and A. Sheth, “A survey of the semantic specification of sensors,” in 2nd International Workshop on Semantic Sensor Networks, at 8th International Semantic Web Conference, October 2009.
[CMP10]
M. Calder, R. A. Morris, and F. Peri, “Machine reasoning about anomalous sensor data.” Ecological Informatics, vol. 5, no. 1, pp. 9–18, 2010. [Online]. Available: http://dblp.uni-trier.de/db/journals/ ecoi/ecoi5.html#CalderMP10
[CNTT09]
M. Compton, H. Neuhaus, K.-N. Tran, and K. Taylor, “Reasoning about sensors and compositions,” in 2nd International Workshop on Semantic Sensor Networks, at 8th International Semantic Web Conference, October 2009.
[DuC10]
B. DuCharme, “Integrate disparate data sources with semantic web technology,” Online, Sep 2010. [Online]. Available: http: //public.dhe.ibm.com/software/dw/xml/x-disprdf/x-disprdf-pdf.pdf
[Gro99]
N. Gross, “The earth will don an electronic skin,” Magazine Article (Business Week), August 1999. [Online]. Available: http: //www.businessweek.com/1999/99 35/b3644024.htm
[GTMW11]
D. Guinard, V. Trifa, F. Mattern, and E. Wilde, From the Internet of Things to the Web of Things: Resource Oriented Architecture and Best Practices. New York Dordrecht Heidelberg London: Springer, 2011, ch. 5, pp. 97–129.
[HFBPL09]
J. Hebeler, M. Fisher, R. Blace, and A. Perez-Lopez, Semantic Web Programming, J. Hebeler, M. Fisher, R. Blace, and A. Perez-Lopez, Eds. Wiley, 2009. [Online]. Available: http://semwebprogramming.org/
[HKR09]
P. Hitzler, M. Kr¨otzsch, and S. Rudolph, Foundations of Semantic Web Technologies. Chapman & Hall/CRC, 2009. [Online]. Available: http://www.semantic-web-book.org/page/Foundations of Semantic Web Technologies
[HPST09]
C. A. Henson, J. K. Pschorr, A. P. Sheth, and K. Thirunarayan, “Semsos: Semantic sensor observation service,” Collaborative Technologies and Systems, International Symposium on, vol. 0, pp. 44–53, 2009. [Online]. Available: http://dx.doi.org/10.1109/CTS.2009.5067461
[ILWY09]
M. Iqbal, H. B. Lim, W. Wang, and Y. Yao, “A service oriented model for semantics-based data management in wireless sensor networks,” in Proceedings of the 2009 International Conference on Advanced Information Networking and Applications Workshops, ser. WAINA ’09. Washington, DC, USA: IEEE Computer Society, 2009, pp. 395–400. [Online]. Available: http://dx.doi.org/10.1109/WAINA.2009.130
[Jai08]
R. Jain, “Eventweb: Developing a human-centered computing system,” Computer, vol. 41, pp. 42–50, 2008.
[LHR+ 09]
Y. Liu, D. Hill, A. Rodriguez, L. Marini, R. Kooper, J. Myers, X. Wu, and B. Minsker, “A new framework for on-demand virtualization, repurposing and fusion of heterogeneous sensors,” in Proceedings of the 2009 International Symposium on Collaborative Technologies and Systems, ser. CTS ’09. Washington, DC, USA: IEEE Computer Society, 2009, pp. 54–63. [Online]. Available: http://dx.doi.org/10.1109/CTS.2009.5067462
48
Bibliography
49
[LPDTPH11]
D. Le-Phuoc, M. Dao-Tran, J. X. Parreira, and M. Hauswirth, “A native and adaptive approach for unified processing of linked streams and linked data,” in Proceedings of The 10th International Semantic Web Conference (ISWC2011). Springer, 2011.
[LPH09]
D. Le-Phuoc and M. Hauswirth, “Linked open data in sensor data mashups,” in Proceedings of the 2nd International Workshop on Semantic Sensor Networks (SSN09), vol. 522. CEUR, 2009.
[LPNMQXH11] D. Le-Phuoc, H. Nguyen Mau Quoc, P. J. Xavier, and M. Hauswirth, “The linked sensor middleware – connecting the real world and the semantic web,” in Semantic Web Challenge 2011, ISWC 2011, 2011. [Online]. Available: http://challenge.semanticweb.org/ [LPPHH10]
D. Le-Phuoc, J. X. Parreira, M. Hausenblas, and M. Hauswirth, “Unifying stream data and linked open data,” DERI, Tech. Rep., 2010.
[MSZ09]
C. Mayer, B. Stollberg, and A. Zipf, “Providing near real-time traffic information within spatial data infrastructures,” in Proceedings of the 2009 International Conference on Advanced Geographic Information Systems & Web Services, ser. GEOWS ’09. Washington, DC, USA: IEEE Computer Society, 2009, pp. 104–111. [Online]. Available: http://dx.doi.org/10.1109/GEOWS.2009.17
[NC09]
H. Neuhaus and M. Compton, “Thesemantic sensor network ontology: A generic language to describe sensor assets,” in AGILE Workshop: Challenges in Geospatial Data Harmonisation 2009, 2009.
[PFN+ 11]
K. Page, A. Frazer, B. Nagel, D. D. Roure, and K. Martinez, “Semantic access to sensor observations through web apis,” in Fifth IEEE International Conference on Semantic Computing. IEEE, September 2011, event Dates: 19-21/09/2011. [Online]. Available: http://eprints.soton.ac.uk/272695/
[Pil10]
S. F. Pileggi, “A novel domain ontology for sensor networks,” Computational Intelligence, Modelling and Simulation, International Conference on, vol. 0, pp. 443–447, 2010.
[Pro06]
F. Probst, “Ontological analysis of observations and measurements,” in Proceedings of the 4th international conference on Geographic Information Science, ser. GIScience’06. Berlin, Heidelberg: Springer-Verlag, 2006, pp. 304–320. [Online]. Available: http://dx.doi.org/10.1007/11863939 20
[Pro08]
——, “Observations, measurements and semantic reference spaces,” Applied Ontology, vol. 3, no. 1-2, pp. 63–89, 2008, used source is the Phdthesis, but it seems to be quite identical with the Article.
[SC09]
J. F. Sequeda and O. Corcho, “Linked stream data: A position paper,” in SSN’09, 2009.
[She10]
A. P. Sheth, “Computing for human experience: Semantics-empowered sensors, services, and social computing on the ubiquitous web,” IEEE Internet Computing, vol. 14, no. 1, pp. 88–91, 2010.
[SHS08]
A. Sheth, C. Henson, and S. S. Sahoo, “Semantic sensor web,” IEEE Internet Computing, vol. 12, pp. 78–83, 2008.
[SP08]
A. Sheth and M. Perry, “Traveling the semantic web through space, time, and theme,” IEEE Internet Computing, vol. 12, pp. 81–86, 2008.
49
50
Bibliography
[TCL11]
K. Taylor, M. Compton, and L. Lefort, “Semantically-enabling the web of things: The w3c semantic sensor network ontology,” in 5th eResearch Australasia Conference, 2011.
[TH10]
B. Thuraisingham and K. W. Hamlen, “Secure semantic sensor web and pervasive computing,” in Proceedings of the IEEE International Conference on Sensor Networks, Ubiquitous, and Trustworthy Computing (SUTC), Newport Beach, California, June 2010, pp. 5–10.
[Til09]
S. Tilkov, REST und HTTP : Einsatz der Architektur des Web f¨ ur Integrationsszenarien, 1st ed. Heidelberg: dpunkt-Verl., 2009. [Online]. Available: http://deposit.d-nb.de/cgi-bin/dokserv?id=3159522&prov=M&dok var=1&dok ext=htm;http://swbplus.bsz-bw.de/bsz305410547inh.htm
[UPWS11]
A. Underbrink, A. Potter, K. Witt, and J. Stanley, “Modeling sensor web autonomy,” in Proceedings of the 2011 IEEE Aerospace Conference, ser. AERO ’11. Washington, DC, USA: IEEE Computer Society, 2011, pp. 1– 14. [Online]. Available: http://dx.doi.org/10.1109/AERO.2011.5747548
[U.S98]
FEDERAL METEOROLOGICAL HANDBOOK No. 12 United States Meteorological Codes and Coding Practices, U.S. DEPARTMENT OF COMMERCE/ National Oceanic and Atmospheric Administration, Washington D.C., United States of America, 1998. [Online]. Available: http://www.ofcm.gov/fmh12/fmh12.htm
[U.S05]
FEDERAL METEOROLOGICAL HANDBOOK No. 1 Surface Weather Observations and Reports, U.S. DEPARTMENT OF COMMERCE/ National Oceanic and Atmospheric Administration, Washington D.C., United States of America, 2005. [Online]. Available: http://www.ofcm. gov/fmh-1/fmh1.htm
[U.S12]
Aeronautical Information Manual - Official Guide to Basic Flight Information and ATC Procedures, U.S. Department of Transportation, Februrary 9 2012. [Online]. Available: http://www.faa.gov/atpubs
[Whi87]
R. M. White, “A sensor classification scheme,” IEEE Transactions on Ultrasonics, Ferroelectrics and Frequency Control, vol. UFFC-34, No.2, pp. 124–126, March 1987.
[ZKA+ 08]
A. Zafeiropoulos, N. Konstantinou, S. Arkoulis, D.-E. Spanos, and N. Mitrou, “A semantic-based architecture for sensor data fusion,” in Proceedings of the 2008 The Second International Conference on Mobile Ubiquitous Computing, Systems, Services and Technologies, ser. UBICOMM ’08. Washington, DC, USA: IEEE Computer Society, 2008, pp. 116–121. [Online]. Available: http://dx.doi.org/10.1109/UBICOMM. 2008.67
50
Appendix A. METAR Field Description The following table A.1 describes the structure of the csv-file for the METAR measurements of the NOAA. The source can be found on the NOAA METAR Field Description Page 81 .
10 11
Table A.1.: METAR Field Descriptions Field Name Description raw text The raw METAR station id Station identifier; Always a four character alphanumeric (A-Z, 0-9) observation time Time (in ISO8601 date/time format) this METAR was observed. latitude The latitude (in decimal degrees) of the station that reported this METAR longitude The longitude (in decimal degrees) of the station that reported this METAR temp c Air temperature dewpoint c Dewpoint temperature wind dir degrees Direction from which the wind is blowing. 0 degrees=variable wind direction. wind speed kt Wind speed; 0 degree wdir and 0 wspd = calm winds wind gust kt Wind gust visibility statute mi Horizontal visibility
12
altim in hg
Altimeter
float
13 14
sea level pressure mb quality control flags
Sea-level pressure Quality control flags82 provide useful information about the METAR station(s) that provide the data.
float string
Field 1 2 3 4
5
6 7 8
9
81
NOAA METAR Field Description MetarFieldDescription.php 82 Quality control flags QualityControlDescription.php
Field Type
Units
string string string float
ISO 8601 date/time decimal degrees
float
decimal degrees
float float integer
C C degrees
integer
kts
integer float
kts statute miles inches of Hg mb
http://aviationweather.gov/adds/dataserver/metars/ http://aviationweather.gov/adds/dataserver/metars/
51
52
Appendix
15 16
wx string sky cover
17
cloud base ft agl
18
flight category
19 20
three hr pressure tendency mb
maxT c
21
minT c
22
maxT24hr c
23
minT24hr c
24
precip in
25
pcp3hr in
26
pcp6hr in
27
pcp24hr in
28 29 30 31
snow in vert vis ft metar type elevation m
83 84
wx string descriptions83 Sky cover, up to four levels of sky cover can be reported; OVX present when vert vis ft is reported. Allowed values: SKC|CLR|CAVOK|FEW|SCT BKN|OVC|OVX Height of cloud base in feet AGL. Up to four levels can be reported. A value exists when the corresponding skyCover=’FEW’,’SCT’,’BKN’, ’OVC’ Flight category of this METAR. Values: VFR|MVFR|IFR|LIFR See 84 Pressure change in the past 3 hours Maximum air temperature from the past 6 hours Minimum air temperature from the past 6 hours Maximum air temperature from the past 24 hours Minimum air temperature from the past 24 hours Liquid precipitation since the last regular METAR Liquid precipitation from the past 3 hours. 0.0005 in = trace precipitation Liquid precipitation from the past 6 hours. 0.0005 in = trace precipitation Liquid precipitation from the past 24 hours. 0.0005 in = trace precipitation Snow depth on the ground Vertical Visibility METAR or SPECI The elevation of the station that reported this METAR
string string
integer
ft (AGL)
string
float float
mb C
float
C
float
C
float
C
float
in
float
in
float
in
float
in
float integer string float
in ft meters
wx string descriptions http://aviationweather.gov/metars/wxSymbols_anno2.pdf METAR ifr description http://adds.aviationweather.noaa.gov/metars/description_ifr.php
52
B. PIREP Field Description
53
B. PIREP Field Description The following table B.2 describes the structure of the csv-file for the PIREP measurements of the NOAA. The source can be found on the NOAA PIREP Field Description Page 85 . Furthermore the more detailled description of the quality control flags is shown in table B.3 or can be found on the corresponding NOAA website86 .
5
Table B.2.: PIREP Field Descriptions Field Name Description receipt time Time (ISO8601 date/time format) when the report was received observation time Time (ISO8601 date/time) when the weather/condition was experienced quality control flags Quality control flags that indicate any assumption(s) made on the PIREP data. Please refer to the Quality Control Flags. aircraft ref Reference to the aircraft. Aircraft type, flight number, or other aircraft information latitude Latitude
6
longitude
Longitude
float
7
altitude ft msl
altitude in ft MSL (mean sea-level)
integer
8
sky condition
string
9
cloud base ft msl
Sky cover - up to two levels of cloud types can be reported. Allowed values: VMC|VFR|SKC|CLEAR CAVOC|FEW|SCT|BKN|OVC OVX|IFR|IMC Height of cloud base- up to two levels can be reported
10
cloud top ft msl
Height of cloud top - up to two levels can be reported
integer
11
turbulence type
Turbulence type. Up to two levels of turbulence data can be reported. The allowed values are: CAT|CHOP|LLWS|MWAVE
string
Field 1 2
3
4
85
Field Type
string string
Units ISO8601 date/time ISO8601 date/time
string
string
float
integer
decimal degrees decimal degrees ft above MSL (mean sea-level)
ft MSL (mean sea-level) ft MSL (mean sea-level)
NOAA PIREP Field Description http://www.aviationweather.gov/adds/dataserver/pireps/ PirepFieldDescription.php 86 NOAA PIREP Quality Control Flags http://www.aviationweather.gov/adds/dataserver/pireps/ QualityControlFlags.php
53
54
12
Appendix
turbulence intensity Turbulence intensity. Up to two levels of turbulence data can be reported. The allowed values are: NEG|SMTH-LGT|LGT|LGTMOD|MOD|MOD-SEV|SEV|SEVEXTM|EXTM turbulence base ft msl Height of turbulence base. Up to two levels of turbulence data can be reported. turbulence top ft msl Height of turbulence top. Up to two levels of turbulence data can be reported. turbulence freq Turbulence frequency. Up to two levels of turbulence data can be reported. Allowed values are: ISOL|OCNL|CONT icing type Icing type. Up to two levels of icing data can be reported. Allowed values: RIME|CLEAR|MIXED icing intensity Icing intensity. Up to two levels of icing data can be reported. Allowed values: NEG|NEGclr|TRC|TRCLGT|LGT|LGT-MOD|MOD|MODSEV|HVY|SEV icing base ft msl Icing base. Up to two levels of icing data can be reported.
string
19
icing top ft msl
Icing top. Up to two levels of icing data can be reported.
integer
20 21 22 23
visibility statute mi Visibility wx string Weather temp c Temperature wind dir degrees Wind direction, the direction from where the wind is blowing. wind speed kt Wind speed vert gust kt Vertical gust pirep type PIREP or AIREP raw text Raw PIREP in text
intger string float integer
13
14
15
16
17
18
24 25 26 27
Value mid point assumed no time stamp flt lvl range
integer
integer
ft MSL (mean sea-level) ft MSL (mean sea-level)
string
string
string
integer
integer integer string string
ft MSL (mean sea-level) ft MSL (mean sea-level) statute mi C degrees kts m/s
Table B.3.: PIREP Quality Control Flags Corresponding description Midpoint- if the exact location of the PIREP is not provided, the midpoint between two locations is assumed. No time stamp - if a time stamp is wrong or not provided. Flight level range - if a range instead of a specific altitude is given for flight level information.
54
B. PIREP Field Description
above ground level indicated
no flt lvl
bad location
55
Above ground level (AGL)- if the flight level is expressed as AGL as opposed to mean sea level (MSL). Or if the flight level is recorded as ”during descent” (DURD), in which case the surface elevation plus 100 ft. is used from the closest identifier. No flight level - if no flight level information can be deciphered from the raw PIREP. The decoder fills in the flight level with the altitude of the cloud observation. If this information is unavailable, then the altitude of icing is used. If icing information is absent, then the altitude of turbulence is used. Bad location - if the location from the ”/OV” group is greater than 500 km from the leading identifier, or if the location identifier is not available. In this situation, the lat and lon from the leading identifier is used.
55
56
Appendix
C. RDF-Conversion Properties Sample File Listing 10.1: A Java-properties configuration file for the conversion parameters. 1 2 3 4 5 6 7 8 9
#Precheck configFileValid = true configFileActive = true
# Config File for the csv−Source of the Metar−Data from metar.noaa.gov nameOfSource = noaa metar descriptionOfSource = METAR Data published by the NOAA localFile = false pathToSource = http://www.aviationweather.gov/adds/dataserver current/current/metars.cache .csv.gz 10 pathToLocalTestFile = files/test/metars.cache.csv.gz 11 12 # file structure 13 separator = , 14 quotechar = ” 15 startLine = 6 16 readMaxEntries = 350 17 18 # data description 19 arrayDescriptions = \ 20 Ignore,Ignore,Ignore;\ 21 http://projects.hummel−universe.net/semanticsensorweb/property/hasStationID,Literal,plain;\ 22 http://projects.hummel−universe.net/semanticsensorweb/property/hasObservationTime,Literal, dateTime;\ 23 http://www.w3.org/2003/01/geo/wgs84 pos#lat,Literal,Double;\ 24 http://www.w3.org/2003/01/geo/wgs84 pos#long,Literal,Double;\ 25 http://projects.hummel−universe.net/semanticsensorweb/property/hasTemperature c,Literal, Double; 26 27 # additional processing information 28 namespaceDefinitions = \ 29 hup,http://projects.hummel−universe.net/semanticsensorweb/property/;\ 30 hu,http://projects.hummel−universe.net/semanticsensorweb/resource/;\ 31 geo,http://www.w3.org/2003/01/geo/wgs84 pos#;\ 32 xsd,http://www.w3.org/2001/XMLSchema# 33 34 attachAdditionalStatements = true; 35 pathToAdditionalStatements = files/config/noaa metar additionalStatements.turtle
56
D. KML-Output Properties Sample File
57
D. KML-Output Properties Sample File Listing 10.2: Configuration of the kml-output of the PIREP-data. 1 2 3 4 5 6 7 8 9 10 11 12
# Config File for the KML output of PIREP data nameOfSource = noaa pirep descriptionOfSource = PIREP Data published by the NOAA iconPath = http://projects.hummel−universe.net/semanticsensorweb/img/airplane 32x32.png
folderName = Aircraft Measurements folderId = Aircrafts folderDescription = \ Measurements of Aircrafts:\n \
\n \ - PIREP−data, provided by http://www.aviationweather.gov/, NOAA’s National Weather Service
\n \ 13
\n \ 14
Data collected and processed by a service of http://projects.hummel−universe.net/ semanticsensorweb
\n \ 15
Icons used from http://www.icons−land.com
\n 16 17 urlToSource = http://projects.hummel−universe.net/semanticsensorweb/basicquery?config=noaa pirep 18 sourceFormat = RDF/XML 19 20 urlToTestSource = files/test/aircraftreports.cache.short.rdf 21 testSourceFormat = RDF/XML 22 23 placementCreationMethod = Standard 24 relevantPropertyOfType = http://projects.hummel−universe.net/semanticsensorweb/resource/ measurement 25 26 # necessary for Standard 27 titleProperty = http://projects.hummel−universe.net/semanticsensorweb/property/ hasAircraftRef 28 observationTimeProperty = http://projects.hummel−universe.net/semanticsensorweb/property/ hasObservationTime 29 latitudeProperty = http://www.w3.org/2003/01/geo/wgs84 pos#lat 30 longitudeProperty = http://www.w3.org/2003/01/geo/wgs84 pos#long 31 32 #Altitude not set is seen as clampToGround, absolute is relative to sea level, Unit is important, because Google Earth uses metres 33 altitudeProperty = http://projects.hummel−universe.net/semanticsensorweb/property/ hasAltitude ft msl 34 altitudeMode = absolute 35 altitudeUnit = feet 36 37 measurementProperties = \ 38 Temperature (◦ C), http://projects.hummel−universe.net/semanticsensorweb/property/ hasTemperature c;
57
58
Appendix
E. Instructions for Generation of Kml files If you want to display the measurement data on Google Earth, there are just some easy steps to follow: 1. Download and install Google Earth from http://earth.google.com. 2. Visit the demo page (http://projects.hummel-universe.net/semanticsensorweb) and choose the “Visualization -> Form for quick query” link. (Alternatively you can use one of the quick links or create a manual request) [Figure E.1] 3. Choose your preferred output in the form on the left. [Figure E.2]
a) Create a networklink. Choose “open with” Google Earth or save it to your disk and open it afterwards. In Google Earth you can find the data under temporary places on the left hand side. By expanding that folder you see the networklink, with the remote-kmlfiles in it. Each kml-file (if more than one) consists of the placemarks for each measurement location. Maybe you will have to check the boxes to display the placemarks on the earth. Feel free to zoom into whatever region you want to and see if you can find a measurement. [Figure E.3] The networklink will reload the data for you and you will receive the latest data every five minutes (METAR and PIREP). You can, of course, force a manual refresh with right-clicking on the networklink and choosing update. b) Alternatively you can create and download the data-kml file. This is the same file as Google Earth will download automatically. The only benefit of using the networklink is the refresh-option. 4. Details of each measurement are presented in the tooltip. Just click on an airport or airplane in the map and see the results. [Figure E.4]
58
E. Instructions for Generation of Kml files
59
Figure E.1.: Landing page of the demo project with the different access methods
Figure E.2.: Form for the generation of networklinks and kml-files.
59
60
Appendix
Figure E.3.: Screenshot of the Google Earth GUI with METAR and PIREP data.
Figure E.4.: Tooltips with details of two measurements in Google Earth (METAR and PIREP)
60
F. Time Measurements of Example Application
F. Time Measurements of Example Application F.1. Conversion of CSV to RDF
Figure F.5.: Time Measurement CSV2RDF Local Files
Figure F.6.: Time Measurement CSV2RDF Remote Files
61
61
Example
62
Appendix
F.1.1. Notes on Measurements 1. Triples in brackets are the hu:measurementXYZ rdf:type hu:measurement relation. Triples outside the brackets represent one data value. 2. Reading the properties file is transforming it completely to java objects. 3. Create list includes the file collection and the conversion from csv to a list. F.1.2. Evaluation • Generating the output RDF-File takes about half the time of the complete process. → Possible solutions: Write data to triple store directly. • Expected amounts of changed data (every 5 minutes) convert in