Dec 1, 2004 - model (GDyn) and the latest GEMPACK software - RunGDyn. ... includes time as a variable which can be shocked, some accounting for foreign capital flows, adaptive ... RunGDyn is a customized Windows program,.
Hands-on Computing with RunGDyn: An Introduction to GDyn Terrie L. Walmsley and Ken Itakura
March 2007
1
Hands-on Computing with RunGDyn: An Introduction to GDyn Terrie L. Walmsley and Ken Itakura1 December 2004 The purpose of this document is to assist you in familiarizing yourself with the dynamic GTAP model (GDyn) and the latest GEMPACK software − RunGDyn. GDyn (Ianchovichina, 1998 and Ianchovichina, McDougall and Hertel, 1999) is a dynamic multi-regional computable general equilibrium model based on the standard GTAP model (Hertel, 1997). In addition to the standard features of comparative static GTAP model, GDyn model includes time as a variable which can be shocked, some accounting for foreign capital flows, adaptive expectations and a mechanism for reducing errors in expectations which ensures convergence in the long run to a steady state. RunGDyn is a customized Windows program, developed by Mark Horridge, that has been specifically designed to solve recursively dynamic models (such as GDyn and MONASH) with relative ease. This document is designed to give a new user sufficient detail about the software so that they can work through the examples relying solely on this document. It is assumed that the user is familiar with the standard comparative static GTAP model, but may not be familiar with either the RunGTAP or RunGDyn software. The instructions are therefore quite detailed. As this document is hands-on it is assumed that you have: 1.
recent versions of RunGDyn and WinGEM on your computer (Appendix A shows how RunGDyn can be installed); and
2.
a Source-Code or Executable-Image version of Release 8.0 or later of GEMPACK installed on a Pentium 3 (or later) PC with a hard disk, at least 512Mb of RAM (memory), a numeric coprocessor, 500mb of free disk space and which runs under Microsoft Windows XP or 2000.
1. Center for Global Trade Analysis, Department of Agricultural Economics, Purdue University, West Lafayette, IN, 47906-1145, USA.
2
The hands-on document will proceed as follows. Section 1 shows the user how to view the Dynamic GTAP model and data. Section 2 shows you how to run a simulation and view the results. This section is divided into several sub-sections. The first sub-section provides a cookbook style illustration of how GDyn can be used to simulate the effects of a productivity shock using RunGDyn. In the second sub-section, the tools available in RunGDyn for analyzing the results are shown. Following this, sub-section 3 allows you to alter the various components of the simulation and thus carry out different shocks. These components include altering the number of years, the closure and the shocks themselves. Finally in Section 3 we examine how to change the version of the model and create a new aggregation of the base case scenario. Before proceeding some of the notation in the GDyn model can be particularly difficult for new users and for old users returning to it after a short break. Here are some hints to help you out with the wealth and income accounting variables and coefficients.
Variable
Longname2
Example3
Definition
First Letter: Income or Wealth Y
Income
YQTRUST (or yqt)- Income of the global trust.
W
Wealth
WQHHLD(r) (or wqh(r) ) - Wealth of the regional household
Equity
YQ_TRUST (or yq_t) - Income payments by the global trust
Second letter: Type of Ownership Q
Third letter: Owner and receiver of income. H
HHLD
Household
T
TRUST
Trust
YQHHLD(r) (or yqh(r) ) – Regional household equity income YQTFIRM(r) (or yqtf(r) ) - Income of the global trust from
2. In order to distinguish variables from coefficients the last letter of a coefficient is always extended to its longname. 3. Coefficients in upper case and percentage change variables in lower case.
3
firms in region r _
All Owners
(underscore)
WQ_TRUST (or wq_t) - Total regional equity held in the global trust
Last letter: Investment or payer of income. T
TRUST
Trust4
YQHTRUST(r) (or yqht(r)) – Regional income from the global trust
F
FIRM
Firm
YQHFIRM(r) (or yqhf(r)) - Income of region r from local firms
none
All
WQTRUST (or wqt) – Value of equity held by the global trust
Investments
1.
Using RunGDyn to look at the Model and the Data In this section, we use RunGDyn to examine the GDyn model and a 3 by 3 aggregation of the
database. The database required by the GDyn model includes the standard GTAP database and parameters augmented with some additional data and parameters. These additional data include the values of foreign income flows and parameters for the investment theory. In the examples undertaken in Sections 1 and 2 of this document this 3 region by 3 commodity aggregation of the database is used. 1.1.
Opening RunGDyn
The first step is to open up RunGDyn. This is achieved by double clicking on the RunGDyn icon on your desk top. If a dialogue box appears to ask if you would like to load a model and simulation from zip archive: click No. The following should appear at the top of your screen:
4. Note that the trust is both an owner of wealth invested in regional firms and owned by regional households.
4
Once inside RunGDyn you will notice two sets of toolbars at the top of the page. The first toolbar (File, Zip, Tasks, View, Options, Run Preferences and Help) is similar to those you may have seen in other Windows programs. This menu is referred to as the main menu. This main menu allows you to carry out various functions such as opening, saving, viewing data and seeking help. The second toolbar (Introduction, Model/Data, Sim Overview, Closure/Shock, Results and Other files) looks like a notebook or card index. Each of the pages in the notebook or card index contains an essential element of the simulation experiment. Each card is referred to as a page (i.e. the Model/Data page). Each label is referred to as a tab. You click on a tab to go to the required page. 1.2. Restoring the Ingredients of a Simulation At this stage, we will use an experiment which was created previously for RunGDyn. It uses the GDyn model to simulate the effects of a productivity shock on the Rest of World (ROW). The ingredients of this simulation have been saved to a zip file and can be restored into RunGDyn using the following instructions: ·
On the main menu first choose: Zip | Restore Ingredients from ZIP Archive.
By this notation we mean click on Zip in the main menu. This will produce a drop down menu. Move down in the drop down menu until you find Restore Ingredients from ZIP Archive and then click. ·
A “ZIP File to Restore From” box will appear. Choose the following file: HO3x3_gdyn_v3_97.zip, and click on the OPEN button.
·
An information box appears and shows history of the ZIP archive. Click OK.
5
·
Another information box appears and asks you to specify the directory you want to restore the files in the ZIP archive. Click OK.
·
Choose the following directory: C:\RunGDyn\HO3x3. Click OK. If the directory you specified doesn’t exist, the software will create it for you. Click Yes.
·
A confirmation box appears. Click OK.
·
After the files are unzipped, you will be asked “Do you want to load these Simulation Details into RunGDyn now?” Click Yes.
·
The software reminds you that the restored application is now the current application. Click OK.
Note that under the directory you specified three new folders, C:\RunGDyn\HO3x3\data, C:\RunGDyn\HO3x3\model and C:\RunGDyn\HO3x3\tabetc, have automatically been created to store the files. ·
Click the tab labeled Model/Data to turn to the Model/Data page.
·
Listed at the top in blue should be the model. Check that the model is gdyn.exe.
6
·
Also make sure you have all the data ingredients in the white box in middle. The data ingredients should be as follows:
Notice again that the model (gdyn.exe) is stored in the model directory and the various data input files are stored in the data directory. Appendix B provides an outline of the files required for running the examples used in sections 1 and 2 of this document. All these files will be contained in the HO3x3 directory once you have restored the zip file. 1.3.
Looking at the Model and the Data
In this section, we use RunGDyn to look at the GDyn model and the associated data files. Three examples are undertaken to examine the sets data; the core data; and the parameter files. In each of these examples, we first look at how the data is used by the underlying model or TABLO file and then we examine the data files themselves. 7
The underlying equations of the GDyn model are defined in the TABLO file (gdyn.tab). The TABLO file is the human readable version of the executable file gdyn.exe. As we saw above, four data files are required by the GDyn model: four header array files (extension *.HAR) one containing the sets and the other containing the base data and other two files containing the parameters (both those for the standard GTAP model and for the dynamic extension). The header array file containing the base data includes both the standard GTAP data and some additional data required for the dynamic extension.
Example 1A: Viewing the Set Data. The TABLO file Rather than proceed directly to the header array file which contains the set information, it is important to first view the TABLO file in order to determine exactly what it is that GDyn requires from the sets data files. ·
The TABLO code can be viewed by choosing View | Main TABLO file from the main menu. TABmate opens a copy of the tab1.tab file.
The TABLO file contains the essential elements of the model including the variables, 8
coefficients and equations. In order for the software to understand the model equations set out in gdyn.tab, there are a number of rules which must be adhered to, some of these include: 1.
all variables, coefficients, sets and files referred to in the TABLO file must first be defined in the TABLO file;
2.
all coefficients must either be read from a file or derived from other coefficients which have been previously defined and read; and
3.
in order to assist the user of the model comments have been added to the TABLO file; these comments are always placed between two exclamation marks.
You will need to refer to the TABLO file constantly when seeking any information about equations, variables and coefficients or when interpreting your results. ·
In TABmate, select Search | Find from the main menu to find the word File. You should find the following statement (F3 will repeat the search):
File GTAPSETS # file with set specification #; This statement defines a file with logical name GTAPSETS. The words between the # #’s are the label given to this logical file name. The name indicates to the user what is contained in the file i.e. set information. ·
If you now use Search | Find to find Set, you should find a list of set statements, such as:
Set REG # regions in the model # maximum size 10 read elements from file GTAPSETS header "H1"; The second line of each set declaration defines the set and gives it a name. The third line states that the set should contain no more than 10 elements and is read from header H1 of the file with logical filename GTAPSETS. Thus the set containing the regions is read from header H1 in the file with logical name GTAPSETS. Question: Examine some of the other sets read from this file GTAPSETS and fill in the missing data in the following table:
9
Set
Logical File Name
Header
GTAPSETS
H6
TRAD_COMM
·
If you now use Search | Find to find REG you will see that many of the variables, coefficients and equations are defined over the set REG. You will also see variables defined in terms of the other sets (e.g. TRAD_COMM).
·
You can now close the TABmate by clicking File | Exit.
The Sets Data File Back in RunGDyn, you should still be on the page labeled Model/Data. If you look at the white box containing the data files you will see the name of the file corresponding to the logical name GTAPSETS. File GTAPSETS = C:\RunGDyn\HO3x3\data\gdset.har This tells us that gdset.har is the file, with logical name GTAPSETS, containing the set information. ·
There are two ways to view gdset.har:
1.
Choose View | Header Array file... on the main toolbar.
10
ViewHAR appears on the screen with a picture of ???? (you can click). On the ViewHAR menu bar select File | Open Header Array File.... Find C:\RunGDyn\HO3x3\data\gdset.har. 2.
Alternatively highlight the GTAPSETS file in the white box and click the right hand button of your mouse to get a menu. Then select View this file.
Once in ViewHAR you will see a menu bar and a table containing the sets. Each row in the table corresponds to a set.
11
In the table of sets the first column relates to the header, the second to the type of data, the third to the size of the data and the last column is a brief explanation of what is in the set. The 1C in the second column means that the information contained in the header are characters, rather than numerical values which is RE. The 3 length 12 in the third column means that there are 3 elements which may contain up to 12 characters. As we know from the TABLO code (gdyn.tab) the set of regions (REG) should be located under header H1. The comment in the last column is the same comment seen between the ##’s in the TABLO code. ·
You can view the regions by double clicking anywhere on the row labeled header H1.
Question: What are the three regions in header H1?
·
Click on Contents on the main menu bar or click anywhere on the data to return to the list of sets.
Question: Now look at the traded commodities (TRAD_COMM) in this data set. What are they?
Question: What about the endowment commodities?
·
You can now close the header array file by clicking File | Exit.
Example 1B: Viewing the Core data The TABLO file. Before examining the data let us look again at the TABLO file (gdyn.tab). ·
Choose View | Main TABLO file from the main menu. The core data can be found in the
12
file with logical file name GTAPDATA. ·
Using Search | Find in TABmate, search for GTAPDATA. You should find the following statement.
File GTAPDATA # file containing all base data #; This statement defines a Header Array file with logical file name GTAPDATA. Now let us look at an equation containing some data. ·
In TABmate, select Search | Find and look for TOTINCEQY. This will take you to the following equation labeled TOTINCEQY:
Equation TOTINCEQY # This equation determines the change in total income from equity# (all,r,REG) yqh(r) = [YQHFIRM(r) / YQHHLD(r)] * yqhf(r) + [YQHTRUST(r) / YQHHLD(r)]
* yqht(r);
The first line is the equation name. The second line is a comment providing some information on what the equation does. The third line states that this equation holds for each region r in the set REG (i.e. USA, EU and ROW as seen in Example 1A). The rest of lines define the equation. In standard GTAP notation, the convention is to use upper case for levels and lower case for percentage changes or deviations from base case. Here, we are interested in the initial database or the levels coefficients (shown in upper case). We can find out what these coefficients are and how they are calculated by searching the TABLO file. Since all variables and coefficients must be defined prior to use we should be able to find a definition by searching upwards. ·
Select Search | Find from the main menu of the TABmate and look for YQHHLD. Remember to change the find box to search upwards. This is done by clicking on Back in the box labeled Direction (alternatively you can use CTL-Home to move you back to the beginning of the TABLO file). Keep searching (F3 to search again) until you find the 13
following definition and formula for YQHHLD(r):
Coefficient (all, r, REG) YQHHLD(r) # regional household equity income #; Formula (all, r, REG) YQHHLD(r) = YQHFIRM(r) + YQHTRUST(r);
This tells us that YQHHLD(r) is defined as a coefficient and is the income earned on equity by the regional household. It is equal to the sum of two other coefficients YQHFIRM(r) and YQHTRUST(r). This coefficient is often referred to as a derived coefficient as it is not read directly from the database but is derived from other coefficients. ·
You can now use Search | Find to find YQHFIRM(r) and YQHTRUST(r). You should find the following statements in the TABLO file:
Coefficient (ge 0)(all,r,REG) YQHFIRM(r) # income of region r from local firms #; Update (all,r,REG) YQHFIRM(r) = yqhf(r); Read YQHFIRM from file GTAPDATA header "YQHF";
Coefficient (ge 0)(all,r,REG) YQHTRUST(r) # regional income from global trust #; Update (all,r,REG) YQHTRUST(r) = yqht(r); Read
14
YQHTRUST from file GTAPDATA header "YQHT";
This tells us that YQHFIRM(r) and YQHTRUST(r) are also coefficients defined as income earned by region r from local firms and from the global trust respectively. Unlike YQHHLD(r) these coefficients are read directly from headers YQHF and YQHT respectively, in the file with logical file name GTAPDATA. ·
If you scroll up or down from here you will notice a number of other coefficients which are also read from the file GTAPDATA.
Question: From which header is EVFA(i,j,r) read from?
·
You can now close the TABLO file by clicking File | Exit.
Viewing the Core Data Back in RunGDyn you should still be on the page labeled Model/Data. In the white box containing the data files you should see the name of the file corresponding to the logical file named GTAPDATA. Question: What is the name of the file corresponding to the logical filename GTAPDATA?
·
Again there are two ways to view this file:
1.
Click View | Header array file... on the main toolbar. ViewHAR appears on the screen with a picture of Wassily Leontief. On the ViewHAR menu bar select File | Open header array file....
2.
Alternatively highlight the GTAPDATA file and click the right hand button of your mouse to get a menu. Then select View this file.
You should see the following table containing the base data:
15
·
Look for header YQHF containing the values of equity income earned from local firms. You can view the data by double clicking on the header YQHF. Data should be available for each of the three regions. The same for header YQHT.
Question: What is the value of income earned by the EU from the global trust? From local firms?
·
Click on contents on the main menu bar to return to the list of data.
·
Try clicking on the header EVFA. EVFA is the header for the value of endowment commodity i used by industry j in region r. The following should appear at the top of your screen:
Notice that the data has more than two dimensions and therefore the whole array cannot be viewed at once. ViewHAR will automatically sum across the final dimension/s. This can be seen 16
if you look at the final white box just above the data (currently labeled sum REG). ·
You can select what to view by clicking on these windows. If you are interested in the EU, for instance, click on the box labeled Sum REG and select EU. The values in the table should change.
Question: What is the value of land used in production in the food industry in the USA? EVFA(“land”,”food”,”USA”) =
Question: What about the total value of capital used by all industries in the Rest of World?
Question: What is this in GTAP notation?
The two white boxes on the far left hand side can be used to find row and column shares or to alter the number of decimal places displayed respectively. ·
Change to 3 decimal places by clicking on the small white box currently labeled 1 and select 3.
·
Click on the white box labeled none and select row for row shares.
Question: What is the share of the services sector in the total usage of unskilled labor?
Question: What about the share of land in all factor inputs used by the food sector? Do you use column or row shares?
·
You can now close the header array file by clicking File | Exit.
Example 1C: Viewing a Parameter file. The TABLO file 17
·
If we go back into gdyn.tab (click View | Main TABLO file) and search for erg_rorg. The first stop shows you that erg_rorg is defined as a variable:
Variable (change)(all,r,REG) erg_rorg(r) # expected rate of growth in gross rate of return #;
The word ‘change’ in brackets shows that this variable is defined in terms of absolute changes, rather than percentage change. If this is not stated explicitly the variable is assumed to be in percentage changes. erg_rorg is therefore the change in the expected rate of growth in the gross rate of return. ·
Search again (F3) and you will find the equation:
Equation INVESTMENT # rule for investment # (all,r,REG) erg_rorg(r) = LAMBRORG(r) * [rorgt(r) - rorge(r)];
This equation determines the expected gross rate of return (rorge(r)). The expected gross rate of return (rorge(t)) moves towards the target (rorgt(r)). What is LAMBRORG(r)?
·
Click Search | Find and look for LAMBRORG. Remember you will have to go up as all coefficients and variables must be defined before they are used.
Coefficient (parameter)(all,r,REG) LAMBRORG(r) # coefficient of adjustment for rate of return #; Read LAMBRORG from file GTAPPARMK header "LRRG"; !< 18
controls the rate at which agents aim to adjust rates of return in response to differences between expected and target rates. If the target rate exceeds the expected rate by 1%, agents aim to adjust the rate by LAMBRORG% per period. >!
You will see that LAMBRORG is defined as a coefficient and read from a logical file called GTAPPARMK. Again the comment tells us that LAMBRORG(r) is the rate at which the expected gross rate of return moves towards the target. ·
Scroll down and you will find other coefficients which are read from this file.
Question: Give an example of another coefficient which is read from this file?
·
If you now search for GTAPPARMK (Search | Find) you will find that GTAPPARMK is the logical file name for the parameters file.
File GTAPPARMK # special parameters for dynamics #;
·
You can now close the TABLO file by selecting File | Exit from the main menu of TABmate.
Viewing the Parameter File In the white box containing the data files you should see the name of the file corresponding to the logical name GTAPPARMK. File GTAPPARMK = C:\RunGDyn\HO3x3\data\gdpextra.har
19
·
View the file
Question: What are the values of LAMBRORG for each region?
·
2.
Now you can close the file by File | Exit.
Simulations The purpose of this section is for you to gain some hands-on experience at simulating with
RunGDyn. An increase in total factor productivity in the Rest of World is used to illustrate this. In this section we examine the remaining pages of RunGDyn. The following two pages, Sim Overview and Closure/Shocks, relate to the elements required to undertake a simulation with GDyn model. The third (Results) provides an easy way to view the results of the simulation. The final page, Other Files, then lists the data files used in the experiment and informs you as to whether they are updated during a typical simulation. The section is divided into four sub-sections. The first sub-section provides an overview of the simulation, focusing on the elements required to conduct a simulation with the GDyn model. The second section examines the results of the simulation experiment. A number of alternative methods are available for viewing these results, including spreadsheets and graphs. In the remaining section some hands-on examples are provided which will guide you through making changes to the various elements of the simulation. These changes include altering the shock, the number of periods and/or the closure.
2.1.
Overview
20
In this first sub-section, we provide a recipe outlining the basic ingredients required to conduct a simulation using RunGDyn. The simulation experiment undertaken here is a productivity shock. Two of the main elements of the simulation have already been discussed in the previous section, these were the Model (gdyn.tab) and the Data. The focus in this section is on the two pages labeled: Sim Overview and Closure/Shocks. Six examples are provided in this section which allow you to examine the various ingredients of the simulation. These examples include examining the Sim Overview page, the Closure/Shocks page, a base case shock file, a policy shock file and a closure file and then finally running the simulation.
Example 2.1A: Simulation Overview. ·
Click on the Sim Overview tab on the second level of the toolbar to move to the Sim Overview page.
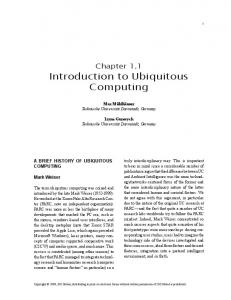
This page contains a number of important aspects about the simulation, including the label for the starting year, the number of periods being examined, the length of those periods and the solution method. The page should look something like the figure provided below.
21
Starting from the top and moving down: ·
The box labeled Start from data for year (4 digits) is the first year of the simulation. You may assume this is the current year or it may be the year corresponding to when the data was collected. In this case we start at year 1997. Check that this says 1997.
·
In the next box labeled Number of Periods for base case (1 or 2 digits), you are required to determine how many periods you want to examine. In this case we are looking at 5 periods. Check that this figure is correct.
·
Following this is a drop down menu for the length of each period. In the Dynamic GTAP model, each period may differ from 1 year. Check that the length of each period is 5 years (except for the last period which is 3 years) by clicking on the arrow next to the phrase “Period 1 is 5 years”.
·
Following this is a list labeled Simulation and Sim names (3 Chars). In the dynamic GTAP model three simulations are undertaken, the base case, base re-run and the policy. At this stage you are required to give both these simulations’ names. In this case, use the 22
names BAS, BRR and HO3 for the Base Case [B], Base Re-Run [R] and Policy [P] simulations respectively. When you come to do more simulations later, you may want to label these differently to avoid writing over previous simulation results. The Base Case simulation represents how we might expect the economy to look without the policy shock (i.e. without the productivity shock). Depending on what we know about the future state of the world economy, this could include our beliefs about population and labor growth rates, or the state of tariff reductions etc. over the simulation period. The Base Rerun takes the policy closures and the base case shocks. It is a calibration simulation. If there are any variables which were endogenous in the base case closure and are exogenous in the policy closure the program automatically takes the values of these variables from the base case simulation, and includes them as exogenous shocks to variable in the base rerun simulation. An example of where this base rerun simulation is useful is with the calibration of region-wide technology to obtain the forecasted Real GDP. It allows the user to endogenise Real GDP in the policy simulation, allowing forecasted real GDP to be achieved (through the shocks to technology), as well as allowing Real GDP to respond endogenously to the policy shock itself. The policy simulation examines the effects of the policy shock, which is applied in addition to the other base case shocks. This allows the policy shock to interact with the other changes that we expect to occur in the world economy. Both simulations are undertaken so that the difference between the two scenarios can be calculated, and hence the effects of the policy shock isolated. ·
You are then asked to specify the current working directory: C:\RunGDyn\HO3x3\. Check that this is in fact the working directory. If not you can change this by clicking on the change button.
·
Next you are asked to specify a mapping file: GDyn.map. The mapping file contains a list of variables which you would like to be placed into a spreadsheet file. You can view the mapping file by clicking on the button labeled Edit.
Question: What variables are currently listed in the mapping file?
If there are any other variables you would like to view in the spreadsheet, type the names of 23
those variables here. For example, you may be interested in the terms of trade (tot). The spreadsheet is not the only way to view the results. All variables can be viewed through ViewSOL (a purpose built program for viewing results). In addition results can always be copied from ViewSOL and pasted directly into Excel at a later stage. Therefore, it is neither necessary nor recommended, that you list all variables in the mapping file. The purpose of this mapping file is to list a few key variables which you suspect you will be interested in manipulating within Excel. ·
Finally, you are asked to specify a solution method. In this case we use Gragg: 2-4-6 steps extrapolation. You must also include automatic accuracy. This should be written in brackets next to the solution method. If not this can be done by clicking on the Change button. In the bottom left hand corner click on the box labeled automatic accuracy and check the options (keep the default options). Then click OK.
Example 2.1B: Closure/Shock. Now we can proceed to the closure and shocks file. ·
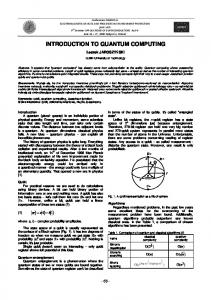
Click on the tab labeled Closure/Shock to move to this next page. This page contains a table similar to the one provided below:
24
The table lists the shock and closure files for the simulation. You will notice that the labels in the first column of the table relate to the information provided on the previous page: Sim Overview. The labels 2002, 2007, 2012, 2017 and 2020 are the last years of each of the periods. For example, the first period starts at 1997 and continues for 5 periods to the beginning of 2002.
As mentioned before, two simulations are undertaken: the base case and the policy. Base case shocks and base and policy closures must be specified for every period. Closures and shocks are specified in files (with extensions .CLS for closure, .BSH for base shocks and .PSH for policy shocks). If these are set up correctly, all the files (with extension .CLS, .BSH, and .PSH) are indicated in black font. If any are in red then these files do not exist in the working directory specified. If there are any in green then the files exist, but they refer to another (constituent) file which does not exist. Question: Are they all in black?
Example 2.1C: Viewing a Base Shock File ·
A shock file can be viewed by using one of the following methods: 1.
Select View | Text file... from the main menu. To see shock files under the current directory, HO3x3, change Files of type as follows.
Then select the file you wish to view, in this case C:\RunGDyn\HO3x3\Y97_02.BSH; or 2.
Place the cursor on the file you wish to open, click the right hand button on the mouse and select Edit.
25
The shock file contains a list of variables and the corresponding shocks to these variables which are imposed in the base case scenario. As mentioned previously the base case scenario indicates what we might expect to happen in the world economy during the simulation period. In this case there are forecasts for real GDP (qgdp), population growth (pop), skilled and unskilled labor (qfactsup), import tariffs (tms) and export subsidies (txs)5. Finally, time is shocked by 5 to indicate that a 5 year period is being simulated, hence this first simulation is from the beginning of 1997 to the beginning of 2002.
5. If there are any variable names you are uncertain of, you can always go back to the TABLO file to find out what they are.
26
In some cases the shocks are located in separate files (e.g. ENDW002.shk) which are referred to here in the base case shock file. These files can be viewed by selecting File | Open from the main menu in TABmate. If one of these files were missing, Y97_02.BSH would appear in green in the table on the Closure/Shocks page. Question: What is the name of the file containing the shocks to Real GDP?
·
Open this file by selecting File | Open in the main menu of the editor. Then choose the relevant file.
Question: What is the shock imposed on qgdp in the Rest of World?
·
Select File | Exit to return to RunGDyn.
Example 2.1D: Viewing a Policy Shock File The policy shock files are given in the final column of the table on the Closure/Shocks page. ·
Again the policy shock file can be viewed by clicking on the file (AFEREG.PSH) with the right click and selecting edit. 27
There are two differences between the policy shock file and the base case shock file: 1.
only the policy shocks, in this case a single shock to productivity (afereg), are included; and
2.
the term ashock is used to shock this variable as compared to the base case shock file where the term ‘shock’ was used.
The reason for ashock is that in the policy simulation all shocks from both the base case shock file and the policy shock file are imposed. Thus there is no need to restate the base case shocks in the policy shock file. Where no policy shock file is specified only the base case shocks are imposed. Secondly, the term ashock stands for additional shock.
Example 2.1D: Viewing the Baseline and Policy Closure Files ·
Finally the closure files (BASB.CLS and POL.CLS) can be viewed. Open up both files by clicking on the files with the right click and selecting edit.
The closure file is used to set out which of the variables are exogenous or fixed and which of the variables are determined endogenously within the model. To close the model, the number of endogenous variables must equal the number of equations; otherwise the model will not solve. Furthermore any variable which is shocked must also be exogenous. In the closure file, there is a list of exogenous variables, followed by the statement “Rest Endogenous”. The file POL.CLS specifies the standard GDyn closure. Question: What is the difference between the baseline and policy closures?
As mentioned above there is an intermediate simulation - base case re-run - which must also be undertaken. This intermediate or base case re-run simulation is used to calibrate technology from our Real GDP forecasts. In this example we are interested in achieving the forecasted rate of growth in Real GDP in the base case simulation and want to calculate the change in each region’s technology required to achieve these Real GDP targets. So let me get this straight. The base re-run takes the policy closures and the base case shocks. 28
Question: Are there any variables which are both endogenous and shocked? Which one/s?
Won’t this crash? This would normally be true, but the base rerun simulation automatically takes the endogenous values of afereg, determined in the base case simulation, and includes these as exogenous shocks to afereg in the rerun simulation, instead of the shocks to Real GDP. Thus it uses the calibrated shocks to technology to obtain the forecasted Real GDP values used in the base case simulation. This is also done in the policy simulation, thus allowing forecasted real GDP to be achieved as well as allowing Real GDP to respond endogenously to the policy shock itself.
Example 2.1F: Running the Simulation. In order to run the simulation it is first necessary to run the base case scenario and then the policy shock. ·
Begin by choosing Tasks | Run Base, Base Rerun and Policy to run the base case, base rerun and the policy simulations consecutively.
·
An information box will then appear telling you to “Beginning simulation(s)”. Click OK.
·
If successful a message will appear:
·
Click OK. Notice you have jumped onto the Results page.
2.2.
Viewing the Results
Results are obtained for each period of the Base Case, Base re-run and the Policy simulations and can be viewed in a variety of ways. The Results page is divided into two parts. The first 29
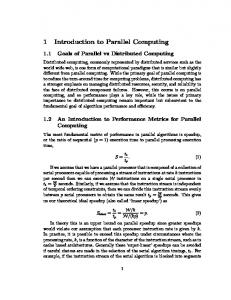
section allows you to look at the results for all periods at once. While the second is for viewing individual periods. 2.2.1. Viewing Results for All Periods. The first section looks something like this:
There are three parts to this first section: 1.
First, Results for the base case, the base rerun, the policy and the difference between the base rerun and the policy can be viewed by selecting one of these options in the first column. The difference between the two simulations shows the effects of the policy shock and is comparable to the output of a comparative static model.
2.
The results for some period(s) or all periods can be displayed in the AnalyseGE program, or a spreadsheet or within the ViewSOL program. Clicking the AnalyseGE box starts the program. Similarly, you can see the simulation results by clicking the Spreadsheet box or the Graph/ViewSOL box.
3.
The third part relates to style. Results can be displayed year-on-year (or in the dynamic model period-on-period) or cumulative. Year-on-year results show the percentage change in the variable occurring during that period, while cumulative results show the total percentage change in that variable occurring between the initial period and the period specified.
Example 2.2A: Viewing the Results Using the Spreadsheet. Before viewing the results using the spreadsheet, you must first select the simulation you wish to view. 30
·
In this case, click on the Difference - Policy v Rerun option. A small black dot should appear in the white circle next to the selected option.
·
Next select the style: year-on-year or cumulative results. In this case select cumulative by clicking on Cumulative in the small box labeled Style.
·
Now click on the box labeled Spreadsheet6.
It will take a few moments to start a spreadsheet program (e.g. MS Excel) where you should see a table of the results for EV, qgdp, qcgds, qk and any other variable you added to the mapping file in the Sim Overview page. The first column is a list of variables. The first row shows the names given to the base case or control and the second row shows those for the policy or deviation. Remember BASB stands for base case, BRRR stands for base Re-Run and HO3P stands for the policy. The first three letters of these names were the ones you specified in the Sim Overview page and the final letter (B, R and P) stand for base, base re-run and policy respectively. This is followed by the final year of the period. Following these headings are a list of the variables and their results. Remember only those variables specified in the mapping file (Sim Overview page) will appear in the spreadsheet.
Question: What is the cumulative change in the variable qk(EUN) for the period ending in 2007?
Question: What would be the result for the variable qk(EUN) for the period 2007 to 2012 (year-on-year)?
·
Exit from the spreadsheet program by choosing File | Exit.
6. If you are using RunGDyn for the first time, you may need to specify a spreadsheet program. Please select the spreadsheet program you prefer.
31
Example 2.2B: Viewing the Results Using ViewSOL. The ViewSOL program is similar to the program ViewHAR used previously to examine the data. ViewSOL is much more adept at viewing the results than the spreadsheet. In order to view the results using ViewSOL you must first select the simulation you wish to view. ·
Click on the Policy option. A small black dot should appear in the white circle next to the selected option.
·
Next select the style: year-on-year or cumulative results. Select year-on-year by clicking on Year-on-year in the Style box.
The choice of style at this stage is not important as both are available from within ViewSOL. The choice of simulation is however important. If you select Base Case then only the Base Case results will be available, however if you select either Policy or Difference, all simulations will be available to view once in ViewSOL. ·
Now click on the box labeled Graph/ViewSol7.
You are now in ViewSOL. The screen will look something like the following:
Once in ViewSOL you will see a menu bar and a table of results. The table is divided into four columns the first is the variable name, the second is the size of the variable or its dimensions, the third shows how many variables there are in this list, and the final column provides a short 7 Note that the time series ViewSOL program uses an SEQ file to load the simulation results. The SEQ file contains the names of the solution files for each year and simulation. 32
explanation about what the variable is. ·
You can now view one of the variables by double clicking on the variable name. Move down and find qgdp the variable for real GDP.
Question: What is the percentage change in real GDP for the EU in the policy simulation in the following periods? basb-brrr-2007 basb-brrr-2012 basb-brrr-2017 basb-brrr-2020
·
You can now click on Contents in the main menu to move back to the table of variables.
Question: What is the percentage change in the quantity of domestic food demanded by the capital goods industry in the North America (qfd(“food”, “CGDS”, “NAM”)) in 2007?
Given this is a three dimensional matrix, you will have to reduce the number of dimensions. This can be done by clicking on the white box labeled Everything and selecting the NAM (or alternatively food or CGDS). Then you should be able to open qfd(*, *, “NAM”). ·
Click on Contents to move back to the table of variables.
·
You can also check that the value of the shock to afereg was as expected. Find and click on afereg.
Question: What is the value of the shock to afereg(“ROW’) in 2007? Is it what you expected? Why or why not?
Question: How can you obtain the cumulative difference in afereg(“ROW’) in 2007? Try 33
selecting Time series... | Show.. Pert | Differences. Is this the result you expected? Why is the perturb result different from the difference?
·
The cumulative results can also be viewed by selecting Time series... | Style.. YonY | Cumulative.
Question: What is the cumulated percentage difference in qk (capital stocks) for the ROW at the beginning of 2012?
Finally you can also export results from ViewSOL to a spreadsheet program (e.g. Excel). This is achieved by clicking on Export... in the main menu. Two options are available: you can copy the results directly or you can copy the transpose of the results. You can then paste these results into your favorite spreadsheet, word processor or into presentation program. ·
Do not exit from ViewSOL as you will need it for the next example.
Example 2.2C: Graphing the Results ViewSOL (and ViewHAR) can also be used to graph results. ·
Find and select qk, the quantity of capital stocks. Click qk to see the values.
·
Now move the mouse to the top left hand corner of the table, labeled qk. Using the right button on the mouse click once.
A chart should appear showing the cumulative percentage change in capital stocks in each region resulting from the policy shocks, across periods. Below the main menu of the Charter program is a large tool bar containing different options which are available to the user. This tool bar allows you to alter the style of your chart. For example, you can plot the data in lines, as a horizontal or vertical bar chart or as an x-y scatter. This tool bar also allows you to alter the line and background colors, add grid lines or make the graph 3D. Finally if you want the results to be 34
clustered according to regions you can click on the box labeled Switch at the right hand side of the tool bar. Try altering a few of these to see the different ways you can view the graph. ·
Exit the graph by clicking on exit to go back to ViewSOL.
·
If you just wanted to graph the results for a single region click on the label for that region in the first column using the right hand button. For example, you can graph the results for the EUN by clicking on the label EUN with the right hand button of the mouse.
·
Alternatively if you just wanted to graph the results for a particular period, you can click on the label for that period using the right hand button of the mouse.
·
Try graphing the percentage change in real GDP for the Rest of World from the base case simulation (Year-on-year results)?
·
Now try graphing the Year-on-year results for the percentage changes in the expected rate of return (rorge).
Question: What do you notice?
This graphing facility in ViewSOL also allows you to graph the base case and the policy together. For example, if you want to graph the cumulative percentage changes in the Rest of World’s Real GDP in the base case relative to the policy. To do this you must: ·
Click on real GDP in ViewSOL.
·
Select the cumulative and base case results from the main menu.
·
Now using the right hand button click on ROW. A graph of the base case results will come up.
·
Now, without closing the charter, go back to ViewSOL and select the policy results.
·
Again, using the right hand button click on ROW. A graph of the policy results will be added to your graph of the base case results.
·
This graph (or the numbers upon which it is based) can then be exported as a bitmap to a word document using the Copy facility in the main menu.
Question: What effect does the policy have on the Rest of World’s Real GDP? 35
·
You can now exit from ViewSOL.
Example 2.2D: Viewing the Results using AnalyseGE Cumulative results can also be examined in AnalyseGE. AnalyseGE is a program which is well suited for analysis (see Pearson, Hertel and Horridge). The program brings together the model code (tab file), the underlying data and the solution file. Open the cumulative differences in AnalyseGE by selecting differences, all and cumulative and then click on the AnalyseGE button.
AnalyseGE will load the model tab file, the cumulative differences between the baseline and the policy for the final period (2020) and the initial data base; which in this case is the updated data for period preceding the final period (i.e., 2017). Using the gloss and evaluate/decompose features in AnalyseGE you can analyze the results for each equation. For example: ·
Search for rorge, the expected rate of return.
·
Once you have found rorge, select the Gloss button to see all occurrences of that variable.
36
·
The line numbers are given in red on the left hand side and the highlighted lines indicate instances where the variable is on the left hand side of the equation. Click on line 1754 to move to that line and the equation.
·
You can now view the value of rorge (cumulative difference) by placing your cursor on the variable (left click) and then using right click to call up the menu.
·
Clicking on “Evaluate (selection or coeff/variable at cursor) will give you the value of rorge. What is the cumulative difference in rorge(“EUN”) obtained from AnalyseGE?
·
The decompose options on the other hand will allow you to decompose the equation or selection. Right click on rorge and select “decompose all or one side of this equation”.
·
You will be asked how to decompose, select RHS, intelligent and first toggle position.
· ·
Once selected viewhar will open up and you will obtain the following:
37
·
This is a decomposition of the equation for rorge.
rorge(r) = - RORGFLEX(r) * [qk(r) - 100.0 * KHAT(r) * time] - 100.0 * LAMBRORGE(r) * ERRRORG(r) * time + srorge(r); ·
Intelligent decomposition breaks the equation up according to the brackets and assigns a label (TempCoeff) to each section of the equation. The coefficients from each section of the equation are used for labeling purposes. For example 1 e1_RORGFLEX refers to the first part of the equation - RORGFLEX(r) * [qk(r) - 100.0 * KHAT(r) * time] and e1_LAMBRORGE refers to the second part 100.0 * LAMBRORGE(r) * ERRRORG(r) * time
·
So this tells us that in NAM qk rises relative to KHAT. Further decomposition will show that in this case qk is 1.66, since the cumulative difference in time and hence 100.0 * KHAT(r) * time is zero.
·
While intelligent decomposition is usually best, this is not always the case. Try decomposing complete by variable to see the other features of AnalyseGE.
·
Close AnalyseGE and return to the RunGDyn results page.
Example 2.2E: Viewing some of the Results using AnalyseGE In some cases you may not want the cumulative differences for all of the years. ·
On the results page of RunGDyn if you select ‘some’ and then click on AnalyseGE, RunGDyn will ask for an rsl file. To obtain an RSL file you will need to cancel and go
38
back to RunGDyn. ·
Next select Tasks | Run SS Jobs for selected Years
·
RunGDyn will then ask if you to select the starting and end years, and the simulation.
·
Select 2002 as the initial year and 2012 as the end year, then click ‘ok’. Yes, check the prerequisites and click ok. 39
·
RunGDyn will then run the SS job. Now when you select AnalyseGE there is an RSL file for 2002 to 2012 which you can load up.
2.2.2. Viewing the Results For Individual Periods. This section allows you to view the base case and policy simulation results for each period as well as the updated data and log files for the end of each period. Examples 2.2D, 2.2E and 2.2F refer to this second part of the results page. The second part of the Results page looks like this.
Example 2.2D: Viewing the Updated Data To look at the 2012 updated database for the base case simulation you must: ·
First select which of the simulations you would like to view - Base Case or Policy. In this case, select Base.
·
Second, select the output type you wish to view. You can choose from the Solution file containing the results for the variables, the Log file containing a log of the simulation including any errors which may have occurred or Accuracy Summary of the simulation or the GTAPDATA containing the updated database. In this case, select the updated database by clicking on GTAPDATA.
·
Third, select the label corresponding to the period you are interested in. In this case 2012.
·
Finally click on the view button to view these results.
The ViewHAR program for viewing header array files is automatically opened. This should look familiar since you have used the same tool to look at the core database. Fill in the updated 40
values of the following coefficients: VIPA(“mnfc” , “EUN”) YQHF(“ROW”) VXWD(“food”, “NAM”, “EUN”) RRGE(“NAM”)
Notice you can also graph the updated data in ViewHAR. Try graphing each regions share of income from the global trust. ·
To graph, you will need to find the relevant coefficient YQHTRUST(r). Double click on the header labeled YQHT.
·
Then click on the first white box at the top labeled None. A drop down menu will appear. Do we want row or column shares?
·
Select the relevant share by moving your cursor down and then letting go of the button. The shares should appear. [If you get all 1's, you have chosen the wrong shares.]
·
Then click on the top left hand corner of the table using the right hand button of the mouse. A graph appears similar to the ones you saw in ViewSOL.
You can also export results from ViewHAR to a spreadsheet program. This is achieved by clicking on Export... in the main menu. Results can be copied to a clipboard (Copy Screen to ClipBoard) for pasting into a spreadsheet or word processor, or they can be copied into a *.CSV file (Save Screen as CSV file...). A number of options are available: results can be copied with and without labels, transposed or not and with or without totals. ·
Exit from ViewHAR by selecting File | Exit. Follow the same steps to examine the GTAPView file and the GTAPVol file for selected
periods. These files are similar to those in RunGTAP (Pearson and Nin Pratt, 1999), with some minor modifications to include useful data for the dynamic GTAP model, such as rates of return and foreign income. 41
Example 5.5: Viewing the Welfare Decomposition The welfare decomposition results are viewed in the same way as the GTAP View and GTAPVol results. Note however that the simulation will give zero results if the time is shocked. Valid results will only appear in WELVIEW when time = 0. Users wanting to undertake the welfare decomposition for the dynamic simulation are referred to chapter 6.Example 2.2E: Viewing the Solution Files The solution for individual years can also be viewed. To look at the solution file for the 2007 policy simulation you must: ·
First, select the Policy simulation in the Results for Individual Years box.
·
Second, chose the solution file by clicking on Solution file.
·
Third, select the label of the period in this case 2007.
·
Finally click on the View button to view these results.
The ViewSOL program for viewing solution files is automatically opened. One of the benefits of ViewSOL is that you can view more than one solution file simultaneously. Thus the base case results can be viewed along side the policy results. This achieved by: ·
Firstly, do not exit from ViewSOL but go back to RunGDyn. (You can do this by holding down the Alt key and then pressing the Tab key (Alt-Tab) or by clicking on the RunGDyn box at the very bottom of your screen.)
·
Then select the base case by clicking on Base Case in the Results for Individual Years box.
·
Check that Solution file and 2007 are still highlighted and then click View. You will notice that you have returned to ViewSOL.
·
Now, 2 basb-2007 should be in the second white window at the top of ViewSOL. Scroll down and find real GDP. Double click on qgdp. You will see two columns: one for the policy results and the other for the base case results. This allows you to compare the two sets of results.
Question: What has happened to real GDP between the base case and policy scenarios? 42
·
Exit from ViewSOL by selecting File | Exit.
Example 2.2F (optional): Viewing the Log Files The log files for each year and for the base case, base rerun and policy simulations can also be viewed here. The log files show any errors which may have occurred during the simulation run. ·
You can view the file for a particular year by selecting the simulation type, Log file and the year. Then click on View. A text file should appear in the TABmate.
2.3.
Altering the Simulations
In this section, we provide a few examples which allow you to make changes to the simulation. These examples include adding new shocks, altering the number of periods and changing the period in which the policy shock is implemented. To alter the simulation elements, we need to move back to the Sim Overview and Closure/Shock pages of RunGDyn.
Example 2.3A: Adding Shocks to the Base Case Scenario Suppose we have a bit more information about our base case scenario. How do we add shocks to this base case scenario? For example, suppose we suspect a differential TFP growth rate in the production of food of 0.1% per year for the period ending 2002. Question: What is the value of the shock?
·
First of all what variable should we shock. If uncertain go back to the TABLO file by selecting View | Main TABLO File.
·
Now search for TFP by selecting Search | Find. You should find two variables avareg and avadiff. avareg is for economy wide TFP growth while avadiff is for sector specific TFP
43
growth. Question: Which variable is most relevant here?
·
Now exit by selecting File | Exit and return to RunGDyn.
·
You can now open up the base case shock file by selecting the base case shock file (Y97_02.bsh) on the Closure/Shock page. Using the right hand button on the mouse select Edit.
·
At the bottom of the file type: Shock avadiff(“food”) = 0.5;
·
You may also want to put in a short description of what the shock is to help you remember in the future. Remember to place an exclamation mark (!) at the front to show that this is a comment.
·
Then save the file as Y97_02ava.bsh and exit back to RunGDyn.
·
Load up the new file on the closure/shocks page by right clicking on Y97_02.bsh and selecting ‘select one”. The select Y97_02ava.bash
·
Next go to the Simulation Overview page and select an alternative 3 letter code for the baseline to (“BSA”)
·
Now select the button Run Base Case.
·
An information box appears, saying “Beginning simulation(s)…” Click OK.
You can check that it has worked by looking at the variable avadiff in ViewSOL to see if the shock was imposed. If it was imposed correctly the amount 0.5 should be in red.
Example 2.3B: Adding Shocks to the Policy Shock File Additional shocks can also be added to the policy shock file in the same manner as that shown in the example above with one slight difference “ashock” should be used instead of “shock”. The reason for this is that these policy shocks are in addition to the base case shocks. Even if the variable was not previously shocked in the base case (like afereg) “ashock” should still be used.
44
Suppose you are now interested in the effect of a productivity in all regions (not just ROW), however in the case of the EUN and NAM this increase is only half that expected in the ROW (i.e. -2.5%). You can add these shocks to the policy shock file by: ·
Clicking on the shock file using the right hand button of the mouse.
·
Then select Edit.
·
Now add the following statements filling in the missing information: ??? afereg("NAM") = ??? ; ??? afereg("???") = ??? ;
·
Save the file under a new name (aferegall.psh) and load into RunGDyn on the closure/shocks page. You should also want to change the 3 letter code for the base re-run (“BRA”) and the policy (“H3A”) so that you do not overwrite your old results.
·
Now select Tasks | Run Base, Base Re-run and Policy from the main menu to run the simulations and check that you have done everything correctly.
You can check the results in ViewSOL to confirm that the shocks were imposed.
Example 2.3C: Altering the Number of Years ·
Return to the Sim. Overview page by clicking on the tab labeled Sim. Overview.
In this example we want to alter the number of years over which the simulation runs. So far we have assumed that we start in the year 1997 and continue to the year 2020. Let us change this so that we start in the year 1997 and continue to 2023. ·
In the second white box labeled ‘No. of periods (1 or 2 digits)’ type 6.
·
Under Lengths of Periods in years, select Period 6 and type length 3 in the edit box.
·
You may also want to alter the names for the base case, base re-run and policy simulations so that you can compare the results of the three experiments at a later date. For the Base Case type in BSB, for the base re-run use BRB and for the policy type H3B. Note that these three characters prefixes must not be the same for both the policy and the base case simulations. 45
Before going straight for the Run Base and Policy - Is there more you need to do first? Remember that we need to specify closure and shock files for this new period. ·
In order to do this we need to move to the next page in RunGDyn. To do this you need to click on the tab labeled Closure/Shocks.
You will notice that this page has changed. The table now starts at the year 2002 and continues for 6 periods to 2023. RunGDyn has filled in the missing closure and shock files with some standard names. Unfortunately these files do not exist in the working directory and are therefore red. We need to specify closure and shock files which do exist in the directory. In order to do this let us assume that the closures are the same for all periods. Thus we can assume that the file BASB.cls can be applied to all years. ·
To change closure files in red, highlight the files. This is done by clicking on the red file under Base Closure.
·
Now notice the two buttons below the table labeled Follow Pattern and As Previous. In this case we have decided that all files are the same as previous so click the button As Previous. You can do the same for the policy closures.
·
In the case of the base case shock, let’s assume that the base case shocks are the same as those for the last period, which also has a length of 3 years. First highlight the file in red and then using the right hand of the mouse click. Select select one. Then chose the file Y17_20.bsh. Alternatively you could have used the As Previous button.
·
All the files should now be written in black to show that they and their constituents exist.
·
Now select Tasks | Run Base, Base Re-run and Policy from the main menu to run the simulations and check that you have done everything correctly.
You will notice that this simulation takes a little bit longer to run. This is not surprising since we have added an extra simulation for the computer to perform. Once it has completed we can now look at the results. RunGDyn will have automatically turned the page to the results. ·
Select base case in the first part of the results page and then click on the box labeled graph. You should see ViewSOL opening up each year of the base case simulation results. 46
·
Now scroll down and open up the percentage changes in the expected rates of return (rorge(r)).
Question: What happens to rorge(r) over time?
Question: What about the variable DKHAT (the absolute change in the normal growth rate of capital). What has happened to this?
·
Exit ViewSOL by selecting File... | Exit and return to RunGDyn.
Example 2.3D: Adding Shocks to the Policy Shock File In Example 2.2B we found that the cumulative difference in 2007 for afereg(“ROW”) was -5%, however the perturb value was 6.77%. The reason for this was that afereg increased by 12.39% in the baseline, so that a decline of 5% in the policy simulation led to afereg(“ROW”) = 6.77% in the policy simulation. Suppose that we do not want the difference between the policy and the baseline to be -5%, what we believe it that this shock will lower agfereg from 12.39% to -5%. In order to do this we must use “tshock”. ·
Go to the closure/shocks page a open aferegall.shk.
·
Edit the shock to afereg(“ROW”) so that we now target afereg(“ROW”) in the policy simulation as -5%. That is, replace: ashock afereg("row") = -5 ;
with tshock afereg("row") = -5 ; ·
Save the new psh file (aferegallt.shk), load it into the closure/shocks page and alter the 3 letter code for the policy experiment to H3C
·
Finally re-run the policy simulation and fill in the following table: afereg(“ROW”)
Using ashock
47
Using tshock
Base
12.39
Policy
6.77
Difference
-5
Example 2.3E: Moving between experiments If you have saved all the files and used the suggested three letter codes you will now have a number of experiments which can be loaded and reloaded. ·
gdyn-BASB-BRRR-POLP.ds1 from section 2.2
·
gdyn-BSAB-BRAR-H3A.ds1 from examples 2.3A and 2.3B
·
gdyn-BSBB-BRBR-H3B.ds1 from examples 2.3C
·
gdyn-BSBB-BRBR-H3C.ds1 from examples 2.3D
You can confirm this by selecting File | load simulation details.. – all 4 ds1 files should appear. Selecting one of the ds1 files will allow you to re-load any of the examples (including simulation details, closures and results).
Example 2.3E: Saving the ingredients of the Final Experiment In the next section we move onto a new aggregation, therefore at this point it might be wise for you to save the work you have already done. There are a number of ways of saving the final experiment used here. ·
First you can save the details of the experiment by selecting File | Save simulation details as. This saves the ds1 files referred to in the example above under a name chosen by you. Note that RunGDyn will automatically save these files before running an experiment, however you may wish to save them yourself if for example the experiment is a work in progress that you do not want to lose or you would prefer to use your own naming convention. These details can then be reloaded at any time by selecting File | Load simulation details and selecting the relevant file. The disadvantage with this is that it only saves the simulations details, not the ingredients themselves, thus if you change an 48
ingredient this will change the simulation. This is why it is important to make sure you save any changes you make using different file names and alter the 3 letter codes. ·
An alternative method is to zip up the ingredients of the simulation. This is done by selecting Zip | Save ingredients as Zip archive. We suggest you do this here. Save the ingredients as Example1f.zip. The disadvantage/advantage of this method is that it does not save the results. With all the ingredients and simulation details saved, the results are just a click away. If you wish to keep the results you need to zip them up yourself.
·
To restore the ingredients all you need to do is select Zip | Restore ingredients from zip archive.
With the ingredients saved you can now move onto the third section confident that you can go back and obtain the results from the previous section at any time.
3.
Changing the Database Aggregation In this section we provide examples in which you change from the 3 by 3 aggregation of the database to a new 7 by 7 aggregation of the database. It is suggested that you use the 3x3
example as a starting point for this new aggregation. Example 3A: Changing the Data Files The 7 x7 data aggregation is located in HO7x7data.zip. Unzip the files and place them in the data sub-directory. ·
Move to the Model/Data page by clicking on the Model/Data tab.
·
The names of the data files on the Model/Data page will now be incorrect. Using the right hand button of the mouse click on GTAPSETS. Then select “Select or change the file name”.
·
A data file box will appear. Inside the data folder there are four new data files gddat.har, gdpar.dat, gdset.har and gdpextra.dat. Select gdset.har as it is the file containing set data which should correspond to GTAPSETS. Fill in the remaining data files in the same way where gddat.har is the file containing the core data (GTAPDATA), gdpar.har is the file 49
containing the parameters (GTAPPARM) and gdpextra.har contains the additional parameters for the dynamic model (GTAPPARMK).
Example 3.3B: Examining the Data Files First it is important to familiarize yourselves with the new sets you will be using. ·
You can view the sets data by clicking (with the right hand button on your mouse) the logical filename GTAPSETS. Then select View this file.
Question: List the regions and tradeable commodities in the 7 region aggregation in the following table: Regions
Tradeable Commodities
Example 3.3C (optional): Viewing the Other Data files You may wish to examine the new core data and parameter files. You can do this using the same methods you used to view the database used in Section 1.
Example 3.3D: Other Changes to RunGDyn. There are a number of other changes that you will be required to make in order for this program 50
to run. ·
First move to the Sim Overview page by clicking on the Sim Overview tab. Alter the relevant parts of the sim. overview page. Note there are no changes in the number of years or period lengths.
Question: What needs to be changed here?
·
Now move to the Closures/Shocks page by clicking on the Closures/Shocks tab.
Question: Are any changes required to the base case and policy closure (*.cls) and shock files (*.bsh and *.psh)?
Question: What about the shock files referred to in the base case and policy shock files (*.bsh and *.psh)?
·
The new shocks files (*.shk) for the 7 x7 aggregation are located in HO7x7shks.zip. Unzip the files and place them in the directory.
·
It is advised that you use the Task | Check all Base-case closures and shocks and Task | Check all Policy closures and shocks to check that the files are correct.
Example 3.3E: Running the Simulation with the New Aggregation ·
You should now have all the ingredients to run the simulation with the new 7 region aggregation, so select Task | Run Base, Base Rerun and Policy to see if it works.
Example 3.3F: Running the Simulation with the New Aggregation: What to do when the 7x7 applications does not work?
51
Actually you will find that this simulation does not work with the GDyn tab file used in the 3x3 example. Japanese investment falls below the depreciation rate and incomes fall by more than 100%. As a result you need to use a version of the GDyn model which contains a complementarity equation which stops investment falling below zero. This model and tablo file are contained in the zip archive HO7x7_gdyn_v32_97.zip8. Restore the zip file and run the experiment, then search for the complementarity equations. For more information on the inclusion of the complementarity see Walmsley (2006).
8 v32 refers to the version number of the GDyn tab file which contains the additional complementarity equations. 52
Appendix A: Installing RunGDyn In this appendix we provide the instructions for installing RunGDyn. ·
Double click on rgdyn_cd.exe in the RunGDyn CD-ROM.
·
RunGDyn Installation program starts and a Welcome pop up box appears on your screen. Click Next.
·
You will be asked which directory you wish to install RunGDyn. Default destination folder is c:\RunGDyn. Click Next.
·
If you are ready to install, then click Next.
·
Once installation is completed, click Finish.
Appendix B: Files required for Sections 1 and 2 In this appendix we list the names of the files which should be contained in the HO3x3 directory once you have restored the ingredients from HO3x3_gdyn_v3_97.zip. The following files are contained in the root directory: ·
RunGDyn files: app.ds1 and app.ds2, cmfstart
·
Mapping file: gdyn.map
·
Closure files: basb.cls and pol.cls
·
Base Case shock files: Y97_02.bsh, Y02_07.bsh, Y07_12.bsh, Y12_17.bsh, Y17_20.bsh
·
Policy Shock file: afereg.psh
·
Shock files: -
Real GDP - gdp001.shk, gdp002.shk, gdp003.shk, gdp004.shk, gdp005.shk
-
Endowments - endw001.shk, endw002.shk, endw003.shk, endw004.shk, endw005.shk
-
Population - pop001.shk, pop002.shk, pop003.shk, pop004.shk, pop005.shk
-
Policy (Tariffs) - tms001.shk, tms002.shk, tms003.shk, tms004.shk, tms005.shk 53
-
Policy (Export subsidies) - txs001.shk, txs002.shk, txs003.shk, txs004.shk, txs005.shk
The following files are contained in the model sub-directory: ·
Gempack files: gdyn.axs, gdyn.axt, gdyn.din, gdy.exe, gdyn.min
The following files are contained in the tabetc sub-directory: ·
Tablo file: tab1.tab, tabcond.sti
The following files are contained in the data sub-directory: ·
Data files: gddat.har
·
Sets files: gdset.har
·
Parameter files: gdpar.dat, gdpextra.dat
Appendix C: Files required for Section 3 ·
·
Data files (HO7x7data.zip): -
Data files: gddat.har
-
Sets files: gdset.har
-
Parameter files: gdpar.dat, gdpextra.dat
Shock files (HO7x7shks.zip): -
Real GDP - gdp001.shk, gdp002.shk, gdp003.shk, gdp004.shk, gdp005.shk
-
Endowments - endw001.shk, endw002.shk, endw003.shk, endw004.shk, endw005.shk
-
Population - pop001.shk, pop002.shk, pop003.shk, pop004.shk, pop005.shk
-
Policy (Tariffs) - tms001.shk, tms002.shk, tms003.shk, tms004.shk, tms005.shk
-
Policy (Export subsidies) - txs001.shk, txs002.shk, txs003.shk, txs004.shk, txs005.shk
54
References 1.
Hertel, T. W. (ed), (1997): “Global Trade Analysis: Modeling and Applications” Cambridge: Cambridge University Press.
2.
Ianchovichina, E. I., (1998): “International Capital Linkages: Theory and Applications in A Dynamic Computable General Equilibrium Model,” Ph.D. Dissertation, Purdue University.
3.
Ianchovichina, E. I., R. A. McDougall, and T. W. Hertel (1999): “A Disequilibrium Model of International Capital Mobility,” paper presented at the Second Annual Conference on Global Economics Analysis, Denmark, June 20-22.
4.
Pearson, K. and A. Nin Pratt (1999): “Hands-on Computing with RunGTAP and WinGEM to Introduce GTAP and Gempack” Center for Global Trade Analysis, Purdue University, West Lafayette, IN, 47907-1145, USA. Prepared for the July 1999 Short Course at Purdue University.
5.
Pearson, K., Hertel, T. and M. Horridge (2002): “AnalyseGE: Software Assisting Modellers in the analysis of their results” Centre of Policy Studies and Impact Project, Monash University, Clayton, Vic, 3168, Australia.
6.
Harrison, J. and K. Pearson (1998): “Getting started with GEMPACK: Hands-on Examples” GEMPACK document No. 8, Centre of Policy Studies and Impact Project, Monash University, Clayton, Vic, 3168, Australia.
7.
Walmsley, T. L. and R. A. McDougall (2000): “A Base Case Scenario for the Dynamic GTAP Model”, Center for Global Trade Analysis, Purdue University.
55