It was expected first and most importantly that drivers would adopt a .... From the early seatbelts and anti-crash bodies to airbags and side impact protection.
Haptic Gas Pedal Feedback for Active Car-Following Support
Cover foto: Regional Air Quality Council website (www.raqc.org) ISBN-10: 90-8559-266-6 ISBN-13: 978-90-8559-266-2
Haptic Gas Pedal Feedback for Active Car-Following Support Proefschrift ter verkrijging van de graad van doctor aan de Technische Universiteit Delft, op gezag van de Rector Magnificus prof. dr. ir. J.T. Fokkema, voorzitter van het College voor Promoties, in het openbaar te verdedigen op dinsdag 30 januari 2007 om 15:00 uur
door
Mark MULDER
ingenieur luchtvaart en ruimtevaart geboren te Vlaardingen
Dit proefschrift is goedgekeurd door de promotoren: Prof. dr. ir. J.A. Mulder Prof. dr. F.C.T. van der Helm Toegevoegd promotor: Dr. ir. M. Mulder Samenstelling promotiecommissie: Rector Magnificus, Prof. dr. ir. J.A. Mulder, Prof. dr. F.C.T. van der Helm, Dr. ir. M. Mulder, Prof. dr. ir. P.A. Wieringa, Prof. dr. J.M. Flach, Prof. dr. F.M. Cardullo, Dr. ir. E.R. Boer, Prof. dr. ir. H.G. Stassen,
voorzitter Technische Universiteit Delft, promotor Technische Universiteit Delft, promotor Technische Universiteit Delft, toegevoegd promotor Technische Universiteit Delft Wright State University, USA Binghamton University, USA LUEBEC, USA Technische Universiteit Delft, reservelid
Dr. ir. M.M. van Paassen heeft als begeleider in belangrijke mate aan de totstandkoming van het proefschrift bijgedragen. Dit proefschrift is verder in belangrijke mate tot stand gekomen door de wetenschappelijke, materiële en financiële bijdragen van Nissan Motor Company, Ltd., Japan.
“To me it is of very little importance whether they [Masters] exist or whether they do not exist, because when you have to walk to the camp or to the station from here, there are people ahead of you, nearer the station, people who have started earlier. What is more important – to get to the station or to sit down and worship the man who is ahead of you?” Henry Miller (quoting Krishnamurti)
Summary With the increased importance of the car as a personal means of transportation, non-driving related devices, such as car-stereos, mobile phones, and more recently navigation systems, divert drivers’ attention more and more away from the primary sources of information necessary for safe operation of the vehicle: the road and other road users. With traffic accident statistics attributing driver inattention as one of the major causes of traffic accidents (Campbell, Smith and Najm, 2003; Wang, Knipling, and Goodman, 1996; Treat et al., 1979), this increase of in-vehicle devices is worrisome at least – if not dangerous. To bridge the gap between the gain in improved passive safety (for example airbags and anti-crash bodies) and the increasing development of non-driving related in-vehicle devices, car safety systems research is directed more towards systems that actively support drivers in their driving task. Ultimately active support systems aim to prevent drivers from getting into accidents. This is a radically different approach compared to that of passive safety systems, which help to lessen the impact of driving accidents but do nothing to contribute to preventing drivers from getting into an accident. Intelligent transportation systems (ITS) currently available can be labelled as what Goodrich and Boer (2000) call the primary purpose of task automation: “safely promoting comfort”. By automating routine skills that were previously required of drivers, for example, speed regulation and car-following which are taken care of by Adaptive Cruise Control (ACC) upon initiation by the driver, driving is made easier without compromising safety. Task automation systems perform driver tasks to maintain the safe field of travel automatically, under a very limited set of circumstances. More recent ITS’s are focusing more on what Goodrich and Boer (2000) call response automation: “comfortably promoting safety”. This type of automation automatically informs drivers when their safe field of travel is degrading seriously, urging them to take swift action to restore this situation to an acceptable level of safety. So, rather than taking over particular driving tasks, response automation monitors the environment, car state variables, and perhaps driver state variables (for example, drowsiness, gaze, intent) based upon which safety judgments are passed on to the driver who, ultimately, is responsible for taking appropriate corrective actions. The research presented in this dissertation focuses on supporting drivers in the longitudinal control of their vehicle during car-following. In April 2002, Delft University of Technology started participating in a multi-university research project, initiated by Nissan Motor Company, on human-centred development of a future intelligent driver support system (IDSS). The aim of the project was to develop a system that would cooperate with the driver in comfortably maintaining safe separation with surrounding vehicles. The goal of the research presented in this dissertation is the human-centred development of a haptic gas pedal interface that comfortably supports drivers in maintaining a safe separation with a leading vehicle during car-following. Two different approaches were found to be suitable for implementation as haptic information providers through the gas pedal. The first approach was to add a force to the gas vii
pedal dynamics which would have to be related to the safe-field-of-travel ahead of the own vehicle and changes therein. The gas pedal dynamics, that is, the force/pedal-position relationship is not changed by this approach. The second approach was to change the stiffness of the gas pedal by adding a virtual stiffness to the inherent stiffness of the gas pedal. By doing so, the dynamics of the gas pedal are changed depending on the changes detected in the safefield-of-travel. In both approaches, an electrical actuator provides the additional force or stiffness. The complementary haptic control loop that is obtained by feeding back environmental parameters with these additional forces or dynamics is based, however, on one major assumption: environmental parameters can be converted into meaningful haptic information in a car-following context. From the investigations into the environmental variables that are most suitable to represent the safe-field-of-travel and its changes, the link between the mechanisms to provide haptic gas pedal feedback and these environmental variables was established by three haptic gas pedal feedback algorithms. One of these algorithms was designed to provide force feedback, with environmental information based on time-headway (THW) and time-to-contact (TTC). This algorithm was called the force feedback algorithm. The other two algorithms used stiffness feedback as their means of generating haptic feedback and differed only in the use of the environmental variables. One of the algorithms, which made use of THW only as the source of environmental information was called the THW-stiffness algorithm. The other stiffness algorithm made use mainly of TTC, which was scaled, however, by THW. This algorithm was called the TTC-algorithm. Because the transformation of environmental information (THW and TTC) into a haptic feedback signal does not have any natural equivalents, it was impossible to know beforehand how drivers would respond to this kind of support. Therefore, the different algorithms were tested in a number of experiments under a variety of environmental conditions. It was expected first and most importantly that drivers would adopt a force-task strategy in controlling the gas pedal when haptic feedback was available. The force-task strategy entails that drivers try to maintain the force they experience from the gas pedal at a constant level. Because the haptic feedback algorithms are designed to increase the amount of haptic feedback with decreasing separation with a lead vehicle, trying to keep the force constant will automatically lead to drivers applying the desired control input to their vehicle: reducing gas pedal input when a lead vehicle approaches and increasing gas pedal input when a lead vehicle moves away again. Analysis of the distributions of the measured gas pedal forces, together with the statistical analysis of variance of the standard deviations, show there is reason to accept the hypothesis that drivers adopt a force task strategy in driving with haptic gas pedal feedback. Not for all haptic feedback algorithms, though. The THW-stiffness algorithm shows little signs of forcetask strategy in close following conditions. The differences between the force feedback and the TTC-stiffness feedback seem negligible and it might be concluded for both algorithms that the haptic feedback leads to the adoption of a force-task strategy in controlling the gas pedal during car-following. This conclusion is based on the fact that for almost all experiments described in viii
this thesis, the standard deviation of the measured pedal force for the conditions with haptic feedback was lower than the conditions without haptic feedback. A reduction of control effort when using haptic feedback, which was found in all experiments that were conducted, shows that drivers obtain valuable information not only of the changes in the safe-field-of-travel based on the movement of the lead vehicle alone, but also based on the dynamics of the own vehicle. The cost of reducing control effort is, however, paid in increased physical load during close following with the haptic feedback support system activated. All haptic feedback algorithms showed a highly-significant increase in the physical load. The results of the experiments show that the force feedback and TTC-stiffness feedback algorithms yield the least increase in physical load with similar reductions in control effort as the THW-stiffness algorithm compared to the base-line no feedback condition. To conclude, drivers have indicated subjectively to feel that they benefit from the presence of haptic feedback during car-following, indicating the trust they have in the information that is transmitted to them via the haptic gas pedal. The combination of increased driver confidence and decreased control effort could well be an excellent combination in the increased complexity and busyness of our highway traffic today and in the future.
ix
x
Contents SUMMARY INTRODUCTION 1.1 1.1.1 1.1.2 1.1.3 1.1.4 1.2 1.3 1.4
DRIVER SUPPORT SYSTEMS RESEARCH Intelligent speed adaptation Collision avoidance Car-following The Nissan Intelligent Driver Support System GOAL OF THE RESEARCH RESEARCH APPROACH THESIS ORGANISATION
HAPTIC GAS PEDAL FEEDBACK 2.1 2.2 2.2.1 2.2.2 2.2.3 2.3 2.3.1 2.3.2 2.3.3 2.4
HAPTIC FEEDBACK IN THE CONTROL LOOP DYNAMICS OF DRIVER – GAS PEDAL INTERACTION Passive gas pedal dynamics Neuromusculoskeletal dynamics of the foot Longitudinal control with a passive gas pedal VIRTUAL GAS PEDAL DYNAMICS Force feedback Stiffness feedback Car-following control with an active gas pedal FROM FORCE TO INFORMATION
HAPTIC FEEDBACK ALGORITHMS 3.1 CAR-FOLLOWING KINEMATICS 3.1.1 Following behaviour 3.1.2 Time-headway and time-to-contact 3.2 GENERALISED OBSTACLE AVOIDANCE ALGORITHMS 3.2.1 Generalised potential fields 3.2.2 Impedance control for obstacle avoidance 3.3 HAPTIC FEEDBACK ALGORITHMS 3.3.1 Nissan force feedback 3.3.2 THW-stiffness feedback 3.3.3 TTC-stiffness feedback 3.3.4 Human response to haptic gas-pedal feedback EXPERIMENTAL METHOD 4.1 APPARATUS 4.1.1 The active gas-pedal 4.2 THE CAR-FOLLOWING TASK 4.2.1 Time-headway indicator 4.2.2 Lead vehicle speed disturbance characteristics 4.3 DATA ACQUISITION AND PROCESSING 4.3.1 Time domain data analysis 4.3.2 Frequency domain data analysis
VII 1 3 3 4 4 4 7 8 9 11 11 13 13 16 18 20 21 22 23 25 27 28 29 31 34 34 37 38 39 42 44 46 49 50 51 52 53 55 56 58 60
xi
CAR-FOLLOWING EXPERIMENTS WITH MAXIMAL VISUAL ATTENTION 5.1 5.1.1 5.1.2 5.1.3 5.1.4 5.1.5 5.2 5.2.1 5.2.2 5.2.3 5.2.4 5.2.5 5.3 5.3.1 5.3.2 5.3.3 5.3.4 5.3.5 5.3.6 5.4
COMPARISON BETWEEN FORCE FEEDBACK AND STIFFNESS FEEDBACK Method Hypotheses Results Discussion of the results Conclusions SUPPORTED CAR-FOLLOWING AT DIFFERENT TIME-HEADWAYS Method Hypotheses Results Discussion of the results Conclusions LEAD VEHICLE SPEED EFFECTS ON SUPPORTED CAR-FOLLOWING Method Hypotheses Time-domain results Frequency-domain results Discussion of the results Conclusions OVERALL DISCUSSION AND CONCLUSIONS
CAR-FOLLOWING EXPERIMENTS WITH SECONDARY TASKS 6.1 REACTION-TIME TASK WITH CENTRAL AND PERIPHERAL VISUAL STIMULI 6.1.1 Method 6.1.2 Hypotheses 6.1.3 Results 6.1.4 Discussion of the results 6.1.5 Conclusions 6.2 AUDIO SYSTEM TRACK SELECTION TASK 6.2.1 Method 6.2.2 Hypotheses 6.2.3 Results 6.2.4 Discussion of the results 6.2.5 Conclusions 6.3 OVERALL DISCUSSION AND CONCLUSIONS CONCLUSIONS 7.1 7.2 7.3
THE USE OF HAPTIC FEEDBACK IN CAR-FOLLOWING HAPTIC FEEDBACK INFORMATION CONTENT THE FUTURE OF HAPTIC GAS PEDAL FEEDBACK
DERIVATION OF GENERALIZED POTENTIAL FIELD PARAMETERS A.1 A.2
THE RESERVE AVOIDANCE TIME THE OBSTACLE AVOIDANCE VECTOR
CAR-FOLLOWING DATA DISTRIBUTIONS B.1 CALCULATION OF THE CAR-FOLLOWING SPIRAL DISTRIBUTIONS B.1.1 Distributions for different lead vehicle speed disturbances B.1.2 Distributions for different feedback algorithms xii
65 66 66 68 68 71 72 73 73 75 75 78 81 81 81 83 84 88 90 94 94 97 99 99 101 101 105 107 107 108 110 111 117 121 121 123 125 126 127 131 131 132 135 135 135 137
B.2 DISTRIBUTION OF GAS PEDAL CHARACTERISTICS B.3 DISTRIBUTION OF GAS PEDAL FORCES B.3.1 Distributions for different lead vehicle speed characteristics B.3.2 Distributions for different haptic feedback algorithms NOMENCLATURE
139 142 142 143 147
SYMBOLS SUBSCRIPTS ACRONYMS
147 149 150
REFERENCES
151
SAMENVATTING
157
ACKNOWLEDGEMENTS
161
CURRICULUM VITAE
163
xiii
xiv
Chapter 1 Introduction As early as 1938, James J. Gibson and Laurence E. Crooks (1938) realized that the ability to drive an automobile is a skill that, although acquired with remarkable ease, “is certainly the most important to the individual, in the sense at least that a defect in it is the greatest threat to his life.” Today, with an almost more than tenfold increase in annual vehicle kilometers travelled since 1938 this statement is more true than ever. That the motor vehicle fatality rate only doubled in this same period is most certainly the result of improved driver safety regulations, higher driver training standards, better road design, and advancements in car-safety systems. From the early seatbelts and anti-crash bodies to airbags and side impact protection systems (SIPS) car manufacturers have come up with a broad range of passive safety improvements that significantly reduce the severity of driver, passenger, and pedestrian or cyclist injury when involved in a traffic accident. However, with the increased importance of the car as a personal means of transportation, non-driving related devices, such as car-stereos, mobile phones, and more recently navigation systems, divert drivers’ attention more and more away from the primary sources of information necessary for safe operation of the vehicle: the road and other road users. With traffic accident statistics attributing driver inattention as one of the major causes of traffic accidents (Campbell, Smith and Najm, 2003; Wang, Knipling, and Goodman, 1996; Treat et al., 1979), this increase of in-vehicle devices is worrisome at least – if not dangerous. To bridge the gap between the gain in improved passive safety and the increasing development of non-driving related in-vehicle devices, car safety systems research is directed more towards systems that actively support drivers in their driving task. Ultimately active support systems aim to prevent drivers from getting into accidents. This is a radically different approach compared to that of passive safety systems, which help to lessen the impact of driving accidents but do nothing to contribute to preventing drivers from getting into an accident. Current existing support systems include for example anti-lock braking systems (ABS), electronic brake force distribution (EBD), advanced cruise control systems 1 (ACC), and more recently lane departure warning systems (LWD) and vehicle dynamics control (VDC) which 1
Adaptive or Active Cruise Control (ACC) is a control system which can automatically maintain either a selected speed or a distance with a leading vehicle. The speed or distance is selected by the driver. No other driver inputs are required to make the system work (within its operational boundaries). Many modern cars today are equipped with ACC.
1
actively adjusts the vehicle dynamics demanded by the driving conditions. Although these systems do not explicitly help to improve drivers’ ability to detect impending safety threats, they do help improve controllability and handling of cars, greatly enhancing drivers’ capabilities of maintaining their safe field of travel in general and in emergency situations in particular. However, as Smiley (2000) points out in discussing behavioural adaptation to new in-vehicle support systems, it can be expected that drivers will attempt to increase their productivity in other tasks while driving, which might reduce the benefits these systems were designed to provide. Furthermore, Rudin-Brown and Parker (2004) showed that when drivers are taken out of the control loop by automation (ACC in this particular paper) their freed up attentional resources allowed them to spend more time on secondary tasks while response times to a hazard detection task decreased and variability in lane position increased. This suggests that the increase in comfort and safety that is offered by new systems might possibly be exploited by drivers to increase their non-driving related activities, diminishing the safety benefits of new intelligent transportation systems (ITS). ITS systems currently available can be labelled as what Goodrich and Boer (2000) call the primary purpose of task automation: “safely promoting comfort”. By automating routine skills that were previously required of drivers, for example, speed regulation and car-following which are taken care of by ACC upon initiation by the driver, driving is made easier without compromising safety. Task automation systems perform driver tasks to maintain the safe field of travel automatically, under a very limited set of circumstances. More recent ITS systems are focusing more on what Goodrich and Boer (2000) call response automation: “comfortably promoting safety”. This type of automation automatically informs drivers when their safe field of travel is degrading seriously, urging them to take swift action to restore this situation to an acceptable level of safety. Lane departure warning systems (LDWS), for example, warn drivers that they are deviating dangerously from their current lane, urging them to make corrective actions towards the lane centre. Collision warning systems (CWS) warn drivers when a vehicle in front of their own vehicle is getting dangerously close. So, rather than taking over particular driving tasks, response automation monitors the environment, car state variables, and perhaps driver state variables (for example, drowsiness, gaze, intent) based upon which safety judgments are passed on to the driver who, ultimately, is responsible for taking appropriate corrective actions. The limited set of operational circumstances of task automation and the discrete on/off nature of currently available and proposed future response automation pose serious problems to the effectiveness of these systems in enhancing safety. When operational constraints of task automation are not clear or not easily identifiable, driver performance might actually worsen in the most critical situations (Rudin-Brown and Parker, 2004). Binary warning systems need to be balanced between false alarm rates and missed detections. Because of the severe consequences of a missed detection, it is important that the number of missed detections is nearzero. This implicates that, theoretically, collision warnings should rarely occur (Dingus et al., 1997), removing the possibilities for drivers to familiarise themselves with the system. Without familiarisation drivers might not be able to respond quickly and appropriately to warnings.
2
These are severe limitations of existing response and task automation systems that might even be detrimental to the purpose they were designed for: enhancing safety.
1.1 Driver support systems research The research presented in this dissertation focuses on supporting drivers in the longitudinal control of their vehicle during car-following. Other research projects have investigated longitudinal control support before, focussing on speed adaptation and collision warning support. These investigations are briefly discussed below. Little literature has been found on support systems for car-following. Automatic control of inter-vehicle separation, however, has been thoroughly investigated and a huge body of literature is available (for example, Rudin-Brown and Parker, 2004; Young and Stanton, 2004; Goodrich and Boer, 2003; Higashimata et al., 2001). The focus of the research in this dissertation, however, is on providing support to the driver such that she/he has improved manual control over the vehicle she/he is driving.
1.1.1
Intelligent speed adaptation
A haptic gas pedal, providing a counterforce when a local speed limit is exceeded, has been under investigation in a number of research projects. In the Generic Intelligent Driver Support (GIDS) project the use of an active gas pedal was investigated for a range of situations. In the speed control situation, the active gas pedal with a continuous counterforce on the gas pedal related to the speed error relative to a normative speed limit, yielded the lowest speed error compared with alternative displays (Godthelp and Schumann, 1993; Verwey et al, 1993). These findings led Godthelp and Schumman (1993) to suggest that active control information “…may serve as an efficient information system.” However, haptic gas pedal support for speed control during curve negotiation was found to have been a potential distracting factor in the lateral tracking task (Verwey et al., 1993). In a more recent European research project - Project for Research On Speed adaptation Policies on European Roads (PROSPER) – an extensive study has been carried out with an active gas pedal support system during speed control. The active gas pedal provides a counterforce whenever the driver tries to depress it beyond a pre-set speed limit. Additionally, the active gas pedal also restricts the engine's fuel injection when the vehicle reaches the actual speed limit. The long term- and large scale effects of using this active gas pedal were evaluated with regard to speed, traffic safety, driver behaviour, travel time, emissions and acceptance using 290 modified vehicles in Lund (Sweden). Results show that compliance with speed limits improve, that is, speed deviations from the speed limits decreased. Hjälmdahl, Almqvist and Várhelyi (2002) indicate that variance in speed decreased which, according to a review of literature done by Várhelyi (2002), could positively impact on traffic safety. Furthermore, drivers showed improved behaviour towards other road users. In subjective evaluations test drivers mentioned less frequent speedometer observations and less gas and brake pedal usage when using an active gas pedal for speed control (Hjälmdahl and Várhelyi, 2004).
3
1.1.2
Collision avoidance
The GIDS research on collision avoidance support with a haptic gas pedal used an increase in force on the pedal of 25 [N] when and for as long as the activation criterion is above a pre-determined threshold value (Verwey et al., 1993). The system was compared to two other systems, a buzz and a light. The haptic gas pedal with a 4 [s] time-to-contact 2 (TTC) activation criterion resulted in the largest decrease in following separation, and the least increase in driving speed and time spent in the left lane (that is, less overtaking). The side-effects that were found for all tested displays for collision avoidance included increased overall driving speed and speed variability. These results appear to be contradictory to the results found with the haptic speed control interface discussed above. Also, there was a tendency for driving in the left lane more often with all of the collision avoidance systems. Although some other research projects on collision avoidance mention the GIDS project (for example Tijerina et al., 2000), surprisingly, no literature was found that reports on a similar system, using haptic gas pedal feedback for collision avoidance information.
1.1.3
Car-following
Car-following support was briefly mentioned in the GIDS project (Verwey et al., 1993), but not systematically investigated. A very recent system, Active Distance Support (ACDIS) has been announced by Continental Temic, to be launched by the end of 2005 3. This system provides a counterforce on the gas pedal to encourage the driver to release the gas pedal when a leading vehicle is getting too close. This force feedback pedal is also engaged when an Active Cruise Control system (ACC) is engaged. Then, the position of the gas pedal is fixed, so that drivers can rest their foot on it, while the ACC is controlling the separation with a leading vehicle. While ACC is engaged “gentle pedal motion informs the driver of system activities, such as throttling the engine output and automatic braking…” (Continental, 2004). Other literature – besides the literature produced by other members of the research project (for example Goodrich and Quigley, 2004) of which this thesis is but a small part – in which a haptic gas pedal display was specifically designed for the use in car-following situations has not been found. This thesis intends to fill in this gap in research on the successful application of haptic feedback via the gas pedal.
1.1.4
The Nissan Intelligent Driver Support System
In April 2002, Delft University of Technology started participating in a multi-university 4 research project, initiated by Nissan Motor Company, on human-centred development of a future intelligent driver support system (IDSS). The aim of the project was to develop a system 2
Time-to-contact (TTC) is defined as the time in which collision will occur if in the current following situation nothing changes. Mathematically TTC = (inter-vehicle distance) / (inter-vehicle speed difference). 3 On the web: www.conti-online.com/generator/www/de/en/cas/cas/general/home/index_en.html 4 University of Iowa (IA, USA), University of Minnesota (MN, USA), Brigham Young University (UT, USA), University of California San Diego (CA, USA), Drexel University (PA, USA), University of British Columbia (BC, Canada), Delft University of Technology (the Netherlands), and Nissan Motor Company Ltd (Japan).
4
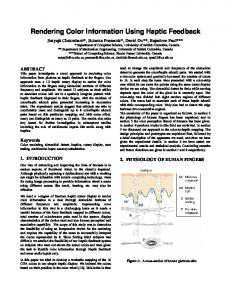
that would cooperate with the driver in comfortably maintaining safe separation with surrounding vehicles. A prerequisite of this system was that drivers always remain responsible for decision making and control of the vehicle, while the IDSS provided drivers with the necessary information at the right moment for them to make the required decisions to comfortably and safely control their vehicle. This prerequisite more or less ruled out the development of a task automation system, since that would effectively take over a selected control task once initiated by the driver. To overcome the potential negative human factors aspects that come with binary warning systems, it was decided to develop an interface that would display support information continuously, much like the warning display suggested by Horowitz and Dingus (1992), who proposed a graded warning from mild to severe as a function of time-to-collision (TTC) for a front-to-rear-end collision warning system. Because of this requirement to present information continuously, the auditory channel was ruled out as an interface modality since continuous auditory information easily leads to irritation and adaptation by humans (USDoT, 1996). Both vision and touch are suitable for comfortably presenting continuous information. However, presenting drivers with a visual display would require them to frequently reallocate their attention from the road to the display to monitor it. Since driving already is a visually highly demanding task, this would only add to the demands of visual processing. Furthermore, other currently available in-vehicle systems, like navigation systems also demand visual attention increasing drivers’ visual information processing demands even further. Finally, the benefits of using haptic information are expected to be found in faster processing and faster, reflexive responses to this information compared to the processing and reaction to the same visual information. It was therefore decided to use haptics to communicate support information to drivers. The best possible manner by which the envisioned haptic display of separation information could be described was that it would enable the driver to virtually “touch” his/her environment (Kitazaki, 2002) – metaphorically named ‘Magic Bumper’. In other words, the haptic interface would have to allow the driver to determine his safe-field-of-travel through his sensations of touch. Like obtaining visual information from the driving scene by continuously scanning the road and other road users, the haptic information would have to be easily available as an integral part of the control task of driving an automobile, whenever necessary. By providing the haptic information through the control channels, drivers would feel the consequences of their control actions immediately, allowing them to easily incorporate this information into their understanding of the current situation. Since the necessity of executing corrective control actions becomes more acute the less time is available to avoid a collision (see Figure 1), the saliency of the haptic information should increase with decreasing time to collision. The operational boundaries of the proposed IDSS would extend both into the driver warning systems and normal driving areas of Figure 1.
5
IDSS
Figure 1: The increasing intensity of action as the time to crash is running out. The IDSS operational boundaries stretch from normal driving to more hazardous situations (adapted from NHTSA, 1992)
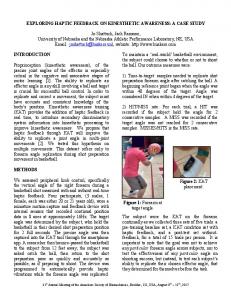
Schematically, the system architecture for the IDSS looks like Figure 2. An environment sensing system takes care of detecting surrounding vehicles and the road with features such as lane markers and curves. This information is processed by the control logic which determines what kind and how much haptic feedback needs to be displayed by the interfaces. Since it was decided to present haptic information through the control channels, that is, the gas pedal and the steering wheel, these devices need to be equipped with force actuators to provide the desired haptic feedback to the driver. Tentatively, driver state information could be made available to the control logic to adjust the haptic feedback depending on the inferred driver state.
Driver IDSS
Human-Machine Interface active gas pedal active steering
Car Dynamics
Environment
Environment Sensing System Cameras
Driver State Sensing System
Radar Control Logic
Laser
Figure 2: Schematic IDSS architecture (adapted from Kitazaki, 2002). The heart of the IDSS consists of the Environment Sensing System, Control Logic, and active control devices for the Human-Machine Interface. The Driver State Sensing System is a tentative subsystem.
6
1.2 Goal of the research Delft University of Technology has been actively involved in developing the control logic and the haptic feedback properties of the actuated gas pedal. The department of Mechanical Engineering investigated the biodynamic properties of the foot – gas pedal system (Abbink, 2006). Human limitations and capabilities in controlling a system cannot be determined properly without the dynamics of the system that is interacted with. For example, a light and little damped control device requires different handling than a heavy and over-damped control device. The human performance in using a control device is thus limited by both the human and control device dynamics. Therefore, a powerful, electrically actuated experimental gas pedal facility was developed, to be able to apply high-bandwidth force and position disturbances to the foot during control tasks in order to determine the dynamics of the combined foot/gas-pedal system. Foot admittance, that is, the capability of humans to yield to forces on the foot, as well dynamic just-noticeable-difference (JND) measurements were conducted with this facility to determine influences of (changing) pedal dynamics on human capabilities to detect and react to haptic feedback (Abbink and van der Helm, 2004). Furthermore, possible interaction on neural level between the simultaneous processing of haptic and visual information was investigated. At the department of Aerospace Engineering, the investigations focused on the mapping of environmental variables onto haptic feedback variables, that is, the development of the control logic. This was limited to the logic required for feedback through the gas pedal during carfollowing. What environmental variables and what haptic feedback properties of the actuated gas pedal were to be mapped onto each other to form the control logic has been a recurring research problem that will be addressed in detail in this dissertation. To test the IDSS logic in realistic driving situations a fixed-base driving simulator was built. The driving simulator gas pedal was electrically actuated and could be fully controlled with the simulation software. The sensing system components for detecting vehicles ahead of the own car were assumed to be available and capable of delivering the variables deemed necessary for determining the required haptic gas pedal feedback. The goal of the research presented in this dissertation is the human-centred development 5 of a haptic gas pedal interface that comfortably supports drivers in maintaining a safe separation with a leading vehicle during car-following. Four major research questions were formulated to guide the research. 1. What possibilities are available and can be usefully exploited to provide drivers with continuous haptic feedback through the gas pedal? 2. Which environmental variables can be related best to haptic gas pedal feedback and how, such that drivers are optimally supported in their car-following task, without decreasing both comfort and safety of that task?
5
The term human-centered development is used in this thesis with reference to the philosophy that “…tools are there to assist human operators in carrying out their mission” (Billings, 1997). In the development of new automation the human operator ought to be the locus of design, such that when using that new automation the human operator remains the locus of control of her/his vehicle.
7
3. How can the efficiency of the developed feedback algorithms with regard to driver control behaviour and car-following performance be evaluated? 4. What is the influence of the haptic gas pedal interface on driver car-following performance during visually undisrupted and visually disrupted driving?
1.3 Research approach To arrive at a systematic design of the intended IDSS, a research development cycle consisting of three steps has been used. Each step is iterated a number of times to refine the interface design based on newly acquired knowledge and insight in the interaction of the haptic gas pedal feedback system and the driver (see Figure 3). First, a theoretical understanding of all elements involved in the design of the support system is required: haptic feedback, driver perception of force, driver interaction with the gas pedal, drivers’ visual perception of the car-following situation, driver car-following behaviour, and so on. Based on this theoretical framework hypotheses can be formulated that need to be tested. Next, this understanding is also used to derive cybernetic control models which clearly show the relations and interactions between the different system elements, leading to a system design. Especially the dynamics of the driver – gas pedal interaction form an important part in this model: they determine the quality of the intended driver support for car-following. Modelling the interaction between driver, car, and haptic gas pedal based on control-theoretic principles allows for the application of system identification methods to investigate driver control behaviour in the frequency domain (see Section 4.3.2 of this dissertation; Abbink, 2006; Mulder et al., 2005a; Mulder et al., 2005b). Overall performance of the driver and his/her interaction with the car and the haptic gas pedal is expressed in control theoretic terms. Cybernetic models can be divided in manual control and supervisory control models (Blaauw, 1984). In manual control, drivers are actively engaged in controlling the system (that is, closed-loop driver control behaviour), while in supervisory control drivers monitor the control actions and system behaviour of the automation that is actively engaged in controlling the system. The models used in this document are based on manual control. Third, the system design is tested in a driving simulator. The results of the simulator experiments will affect the understanding of the relation and interaction between the elements of the system, allowing for new ideas to be incorporated to improve the system further. System Design
Modelling
Experiments Theory
Figure 3: Research development cycle.
8
1.4 Thesis organisation This thesis is organised as follows. Chapters two and three form the theoretical basis of the control logic for the haptic gas pedal feedback. In Chapter two, the concepts of haptics in general and that of haptic gas pedal feedback in particular are explained. A car-following model is used to show how the haptic feedback channel fits in with the existing visual feedback which drivers use to control car-following. This model shows the dynamics of driver – gas pedal interaction and how that can be exploited to provide drivers with separation information. Different options of providing drivers with continuous tactile information are discussed. Chapter three presents the selection of suitable environmental variables that, when properly related to haptic feedback variables, determine the quality and effectiveness of the haptic feedback. Before presenting the results of driving experiments that were conducted in the fixed-base driving simulator at the department of Aerospace Engineering, Chapter four is devoted to the discussion of the basic experimental set-up and the evaluation methods used. Chapters five and six present the results of car-following experiments. The chronology in which the experiments have been conducted has been altered in favour of grouping similar experiments in the same Chapter. In three of the experiments, all described in Chapter five, drivers were given a maximal car-following task to which they should devote all their visual attention. The main goal of these experiments was to investigate the effects of different haptic feedback designs on driver car-following behaviour. Two experiments, described in Chapter six, were conducted in which drivers were given a secondary task that required them to temporarily re-allocate their visual attention from the driving scene to other parts of the visual environment. The main goal of these two experiments was to investigate the effectiveness of haptic gas pedal feedback when visual attention to the driving scene was distracted. Finally, Chapter seven summarizes the results of the research presented in the preceding Chapters. Conclusions are drawn with regard to the use and generation of haptic gas pedal feedback and its implications on driver car-following behaviour.
9
10
Chapter 2
Haptic Gas Pedal Feedback Being able to touch and feel the environment is a rich and essential source of information for humans. Touch allows us to determine material characteristics such as surface roughness, stiffness, and object contours. Furthermore, it helps us to determine the proximity of objects and by pushing or pulling them it is possible to get an idea of the resistance to movement. Touching, pushing and pulling enable us to actively investigate properties of the environment. It is precisely this important property – being able to actively investigate properties of the environment – that will be tried to be exploited in the development of haptic gas pedal feedback. When Gibson and Crooks wrote about their safe-field-of-travel in 1938 they were describing physical safety constraints that drivers needed to conceptualise mentally from the information they were able to collect visually from the environment they were driving in. Today, this situation isn’t much different. Drivers are capable of acting in their environment through their gas pedal, but the information they use to base these actions on can only be acquired visually: by looking through the windscreen (see Figure 4 1). There are other cues, such as engine sounds, vibrations, the speed indicator, etc. that drivers use while controlling their vehicle, but these are mainly related to the state of the own vehicle and tell them little about the environment.
2.1 Haptic feedback in the control loop The haptic gas pedal interface is an in-vehicle device that does not inform the driver about the state of the vehicle itself, but about the state of the vehicle in the environment. To help drivers form a mental image of their safe-field-of-travel, haptic information of the field boundaries first of all provides them with a complementary channel, besides vision, to 1
The designation of the signs in this and following block diagrams of car-following deviate from standards in block diagram notation in that the through-going signals are negative (-) and the feedback signals are positive (+). Standard notation is the opposite. It was chosen to deviate from standard block diagram notation in order to adhere to the widely used sign notations of the signals in automotive research.
11
determine these boundaries (see Figure 5). Second, if the haptic information is presented continuously rather than binary (on/off) as with a warning system, the field boundaries can be perceived continuously. Visual Feedback of { v , x}rel desired -
+
ev
{ v , x}rel
Driver
Fdriver
Gas Pedal Dynamics
αpedal
Car Dynamics
{ v , x}rel
{ v , x}car -
+
{ v , x}lead car
Lead Car Figure 4: Block diagram of longitudinal control of the car. By pressing the gas pedal with a force Fdriver, the displacement of the pedal, αpedal, determines the speed and longitudinal position of the car in the environment. The visually perceived information from the environment allows the driver to determine the required amount of gas pedal depression to maintain the desired safe-field-of-travel, closing the control loop.
Third, because the haptic information is presented through the longitudinal control channel, the consequences of control actions can be felt too, as they will induce changes in the safe-field-oftravel. Furthermore, the stimulus-response compatibility (Sheridan and Ferrell, 1975; Wickens, 1992) of haptic gas pedal feedback is expected to be high, that is, an increased force on the pedal is already suggesting the correct control action required of the human to improve the current safe-field-of-travel. Fourth, as will be shown below in Section 2.3, the haptic feedback interface also allows probing of the environment, that is, active investigation of the properties of the safe-field-of-travel, by selecting appropriate characteristics of the haptic gas pedal. Visual Feedback of { v , x}rel Fpedal + desired -
{ v , x}rel
ev
Driver
Fdriver
Kpedal Gas Pedal Dynamics
Haptic Feedback: Fv, Kv
αpedal
Car Dynamics Lead Car
{ v , x}rel
{ v , x}car -
+
{ v , x}lead car
IDSS Figure 5: Block diagram of longitudinal control with haptic feedback. The Intelligent Driver Support System (IDSS) senses the lead car relative speed and distance. This information is then converted to a haptic feedback signal, force Fv or stiffness Kv, which is communicated to the driver through the gas pedal. Drivers perceive the haptic feedback through the forces (Fpedal) the gas pedal is now actively exerting on their foot. If drivers adopt a force task strategy, that is, if they try to maintain Fpedal constant, then a haptic feedback control loop is established which is related with the environment through the control logic of the IDSS.
To fulfil all the abovementioned properties of the haptic gas pedal it is important to know how humans perceive tactile information from the gas pedal and how they act through the gas
12
pedal to control the longitudinal motion of their vehicle. Section 2.2 therefore, explains the properties of the human interaction with the gas pedal, and the foot in particular, which is the main actor in both the perception of and the reaction to haptic information through the gas pedal. This interaction is modelled, such that it fits in a control theory model of car-following – the longitudinal control mode for which the haptic feedback system in this thesis is designed. In Section 2.3 the options for introducing virtual gas pedal dynamics to provide haptic feedback are discussed. During the development process two concepts, force feedback and stiffness feedback, have been worked out, implemented and tested. How both concepts change the carfollowing model will be shown at the end of Section 2.3. Finally, the benefits, disadvantages, possibilities, and limitations of providing haptic feedback through the gas pedal will be discussed in Section 2.4.
2.2 Dynamics of driver – gas pedal interaction Drivers use their right foot to control the deflection of the gas pedal with which in turn the longitudinal dynamics of the car are controlled. Normally, to establish stable and comfortable gas pedal control, which requires the least amount of work, the heel is resting on the floor of the car and the ball of the foot is in contact with the gas pedal as shown in the left-hand side of Figure 6. The ankle joint functions as a hinge for the upward and downward motion of the foot to achieve gas pedal deflections. Upward and downward foot motion is produced by antagonistic pairs of (co)contracting muscles in the leg. The upward motion of the foot is achieved by contraction of the shin muscle (Tibialis Anterior) while the calf muscles (Gastrocnemius Medialis, Gastrocnemius Lateralis, and the Soleus) relax simultaneously, resulting in less gas pedal depression. Downward motion of the foot is the result of contraction of the calf muscles combined with relaxation of the shin muscles, yielding a depression of the gas pedal. Both the foot and the gas pedal are dynamical systems, that is, the states of these systems are time-dependent. For a static condition to exist, the force the driver is exerting on the gas pedal must be equal to the force the gas pedal is exerting on the foot. Furthermore, both the foot and the gas pedal can be modelled as mechanical systems, with external forces acting on them to produce changes in foot and pedal position.
2.2.1
Passive gas pedal dynamics
The gas pedal as it is used in most cars is a simple mechanical mass, spring, damper system which can schematically be represented as shown in Figure 7. To produce a deflection αp(t) of the gas pedal, the driver must exert a force Fp(t) on the gas pedal that is linearly related to the dynamic properties of the pedal – stiffness Kp, damping Bp, and mass Mp: (2.1) Fp (t ) = α p (t ) K p + α� p (t ) B p + α��p (t ) M p
13
αpedal
shin calf αfoot
Figure 6: Foot – gas pedal combination, left, and schematic representation, right (pictures with courtesy of D.A. Abbink).
For most gas pedals, as well as the one that is used in the fixed base driving simulator that was used for this research, the mass and damping are negligibly small compared to the stiffness of the spring, reducing equation (2.1) to a mere spring. This spring, however, is pre-tensed. So, to produce a pedal deflection at all, an initial force Fi has to be overcome. Equation (2.1) becomes: Fp (t ) = α p (t ) K p + Fi
(2.2)
The spring is installed such that it will pull or push back the gas pedal to its zero deflection position. At zero deflection, there is no input to the engine. At maximum pedal deflection, input to the engine (throttle) is maximal. However, for the car that was used for this research, with automatic transmission, the maximum throttle opening is reached well before maximum gas pedal deflection, as can be seen in the right-hand graph of Figure 8. At approximately 60% gas pedal deflection, maximum throttle opening is reached. The 40% excess in pedal stroke is used when fast accelerations are required. The automatic gear transmission depends on the speed of the car and the gas pedal depression. At high speeds and high gear, there is little excess power to accelerate fast. Instead, when the gas pedal is depressed fully in fourth gear, the automatic transmission shifts back to third gear increasing engine rpm which results, thanks to the lower gear ratio, in a quick increase in speed (see left hand side of Figure 8). This implies that effective control of vehicle longitudinal motion is achieved in the first 60% of the gas pedal stroke, since the engine will be most responsive in that region. This is the first of two control characteristics of the gas pedal that will be important in the design of a haptic feedback system, since it determines the most important region of gas pedal positions during active control.
14
Kp Fp(t)
Mp Bp αp(t)
Figure 7: Schematic mechanical equivalent of the gas pedal: a mass, spring, damper system.
Constant gas pedal position is related to steady state vehicle speed, see left-hand graph of Figure 8. Drivers do not necessarily know (nor need to know) the exact pedal position for the speed they want to drive at. In fact, it is more likely that the correct pedal position is estimated from the speed information drivers get visually. Visual cues from outside the vehicle help drivers in determining their speed relative to other vehicles and objects in the environment. Furthermore, visual cues from the road and peripheral stationary objects might give an indication of absolute speed. For exact knowledge of the absolute speed the speed indicator is available. Other cues like acceleration, engine sounds, and vibrations might also help in building driver awareness of speed. 100
160
Engine throttle opening [%]
140
Speed [km/h]
120 100 80 60 40 20 0 0
20
40
60
80
Gas pedal depression [%]
100
80
60
40
20
0 0
20
40
60
80
Gas pedal depression [%]
100
Figure 8: Gas pedal position vs. car speed at steady state (left). At approximately 60% pedal depression maximum throttle opening is reached (right; Pauwelussen, 2005) and no extra input to the engine can be given. However, an extra speed increase can be obtained by fully depressing the gas pedal, which will prompt the automatic transmission to shift back one gear. This increases rpm and releases some excess power to deliver the extra acceleration to increase speed.
In longitudinal control (e.g. speed control or separation regulation during car-following), drivers initially depress or release the gas pedal more than required for the steady state speed they want to reach. This speeds up the transition from the initial speed to the desired speed, but requires drivers to reverse their initial gas pedal command to prevent overshoot from the desired speed (Figure 9a). So, effectively, drivers command a desired acceleration with the gas pedal while actively controlling the vehicle (Figure 9b). This is the second important characteristic of the gas pedal, since it determines pedal movement patterns during active control. 15
Besides the control characteristics of the gas pedal, the human control characteristics with the inherent properties of the foot, which controls the movements of the gas pedal, are important to consider when designing haptic gas pedal feedback. Before discussing the implications of adding feedback signals to the gas pedal, the dynamics of the foot are described. Together, the dynamic properties of the gas pedal and the foot form an interacting system that can be described by mechanical representations. This simplification is useful in gaining an understanding of the complex interaction between the driver and the gas pedal. Furthermore, with this understanding it will be easier to investigate the available options for haptic gas pedal feedback. 140
100
2.0
100
130
90
1.5
90
80
60
100
50
90
40 30
80
20
V [km/h] alpha [%]
70 60 30
35
40
t [s]
45
a [m/s2]
110
80
1.0
60
0.0
50
-0.5
40
-1.5
0
-2.0
a) Pedal position αp and speed V as a function of time t.
30
-1.0
10 50
70
0.5
αp [%]
70
αp [%]
V[km/h]
120
20
a [m/s^2] alpha [%]
10 0
30
35
40
t [s]
45
50
b) Pedal position αp and acceleration a as a function of time t.
Figure 9: Longitudinal speed control characteristics. To increase speed, the gas pedal is depressed relatively deep (a) to – effectively – command an acceleration (b). Once the desired speed is reached, the pedal is released and stabilized around the position for the steady state of the desired velocity (a).
2.2.2
Neuromusculoskeletal dynamics of the foot
The dynamics of the human foot are a complex interaction between muscles, passive tissues like the tendons, which connect the muscles to the bones of the skeleton, and reflexive and conscious control signals from the neural system. These dynamics are bi-directional, that is, drivers can exert forces and produce movement of the foot while at the same time, through proprioception, external forces and forced movement of the foot can be sensed. Furthermore, muscle activation can be voluntary through conscious control and reflexive through neural shortcuts that bypass the central nervous system. Voluntary muscle activation is initiated intentionally by the driver. Reflexive muscle activity is initiated by proprioceptive feedback of force, muscle stretch, and muscle stretch velocity. Muscle reflexes help humans to stabilize their limb movement or positioning and will be an important property to consider when designing a haptic feedback system. Generally, the combined intrinsic and neuromuscular dynamics are described by the mechanical admittance of a limb, which describes the limb position as a dynamic function of an external force (Abbink, van der Helm, and Boer, 2004). Proprioceptive reflexes and muscle (co)contraction offer mechanisms to adapt admittance to changing environmental conditions (van der Helm et al., 2002; Abbink, van der Helm, and Boer, 2004). 16
Intrinsic musculoskeletal dynamics
During driving, the sole of the foot, usually embedded in footwear, is the contact endpoint with the gas pedal. Contact dynamics of the skin can be modelled as a spring-damper system with negligible mass as compared to the mass of the rest of the foot (which includes the footwear). The visco-elastic properties of the muscles and the mass of the foot are connected in series with the contact dynamics of the foot with the pedal (mainly skin dynamics, partly footwear dynamics), as represented in Figure 10. The properties of the skin dynamics are given by equation (2.3) and the lumped (all involved muscles and bones together) intrinsic mechanical properties of the leg/foot combination are described by equation (2.4). Due to reflexive muscle activity, a reflexive muscle force Frefl(t) is produced besides the intrinsic muscle force Ff(t), such that the total contact force of the sole is the result of intrinsic and reflexive muscle forces combined, see equation (2.5). If the contact force Fs is equal to the pedal force Fp, then the pedal position will be stationary. For Fs>Fp, the pedal depression will increase and for Fs0, shown in Figure 13 by the dashed line, it can be seen that the force – 21
position characteristic is translated upwards. This means that, for any given pedal position, the force required to hold that position is increased with magnitude Fv(t). To change the pedal position with an amount Δαp however, still the same change in pedal force ΔFp is required compared to the nominal force – position characteristic of the gas pedal at Fv(t)=0, that is, the slope of the force – position characteristic remains the same. Thus, with force feedback, changes in gas pedal force can be perceived only when the force Fv(t) is changed, and only then when these changes are above JND. Fp [N]
60 50 40
Fv(t)
30
Kp
F20i 10 0 0
10
20
30
40
50
60
70
80
90
100
αp [%] Figure 13: Gas pedal position – force relationship for the inherent gas pedal characteristics (solid line) and with added virtual force Fv(t) (dashed line).
2.3.2
Stiffness feedback
Unlike the force feedback system, the dynamic feedback system of equation (2.7) does not increase the pedal force for any given pedal position, but it increases the pedal force depending on pedal position, velocity, and acceleration. Although it is possible to change all the dynamics of the gas pedal simultaneously, this might not be beneficial for a number of reasons. First, simulating mass requires a highly accurate and powerful actuator and complicated control software. Furthermore, adding virtual mass Mv to the pedal increases its momentum, possibly making it too difficult to control. Ideally, the mass of the gas pedal should remain negligible. Added virtual damping could help make the pedal control more stable when fast pedal movements are required. For the benefit of communicating information, however, damping is not suited since it can only be perceived when the pedal is moved by the driver. It cannot be felt when the pedal is in a static position, that is, when the velocity of the pedal α� = 0 , nor when the pedal is moved by the actuator. The only parameter with which information can be communicated effectively is the added virtual stiffness Kv. The added virtual stiffness can be felt as an increase in the pedal force ΔFv(t)=Kv(t)αp(t) when the pedal is in a static position (see Figure 14). As an additional benefit, a change in pedal position Δαp(t) now also yields an increase in pedal force ΔFp(t) that is bigger than the increase in pedal force for the nominal pedal characteristic (ΔFp(t)=KpΔαp(t)), since the slope of the force – position characteristic is increased from Kp to Kp+Kv(t) (ΔFp(t)= Δαp(t)(Kp+Kv(t)). Equation (2.7) then becomes (including the pre-tensed spring): Fp (t ) = α p (t ) ( K p + K v (t ) ) + Fi
22
(2.9)
Thus, the dynamic feedback system is, for the practical reasons mentioned above, reduced to a stiffness feedback system, with an intrinsic minimum stiffness Kp and pre-tension Fi. Fp [N]
60 50
Kv(t)
40
ΔFv(t)
30
Kp
F20i 10 0 0
10
20
30
40
50
60
70
80
90
100
αp [%] Figure 14: Gas pedal position – force relationship for the inherent gas pedal characteristics (solid line) and with added virtual stiffness Kv(t) (dashed line).
2.3.3
Car-following control with an active gas pedal
With the knowledge of how the gas pedal dynamics can be influenced – by producing virtual forces and dynamics with an actuator – the longitudinal control model of Figure 11 can be extended with a haptic feedback loop. The haptic feedback loop duplicates the information that is already available visually, but it presents it in a complementary modality through the gas pedal. A sensor system detects other vehicles in the environment. It is assumed for this research that the sensor system is available and capable of providing distance and speed information of leading vehicles. This information, together with the information on speed and acceleration of the own vehicle is the input to the control logic of the IDSS which determines the amount haptic feedback that is required for the current situation. The control logic of the IDSS is the topic of discussion of Chapter 3 of this thesis. For now, it is sufficient to state that the control logic determines either the magnitude of Fv(t) or Kv(t), depending on the choice of the designer. The virtual force Fv(t) or stiffness Kv(t) is generated by an actuator attached to the gas pedal, which influences the force required of the driver to keep the pedal in an equilibrium position. Through proprioception of force and position changes of the gas pedal – if they are above JND – drivers can use these forces to infer what is happening in front of their own vehicle (see Figure 15), hence providing them with a haptic feedback control loop. Because of the haptic feedback loop, the forces on and the position of the gas pedal are not merely the direct consequences of drivers’ control actions. They now are also the consequence of changes in the environment. How the environment induces these changes depends on the control logic of the IDSS. This change in the meaning of pedal force and position is likely to have a profound impact in task interpretation by drivers in using the gas pedal. As mentioned before in Section 2.2.2, humans adjust their admittance depending on the task. If the task is to maintain position of the gas pedal, drivers will adopt a very low admittance. If the task is to maintain the gas pedal force constant, drivers will adopt a relatively high admittance. Low admittance requires high muscle co-contractions and increased reflex 23
sensitivity to make the foot/leg combination as stiff as possible. This also requires more energy and effort than maintaining a high admittance, for which the muscles need to be relaxed. From an energy point of view it is therefore preferable to execute a force task, such that drivers can adopt a low admittance. Furthermore, a force task seems preferable from the control point of view, since drivers will have to yield, rather than counteract the force imposed on them through the gas pedal feedback. Yielding to additional pedal forces will automatically lead to a control action that promotes a decrease in speed, whereas counteracting additional forces will at best lead to no control action at all. Humans are very sensitive to changes in force, but are bad at estimating absolute forces, especially if they are to be maintained over a longer period of time. Yielding to a change in force requires drivers only to comply with the force change. Counteracting an increased pedal force requires drivers to maintain a higher force constantly, which is a more difficult task to perform accurately. It is therefore hypothesized that drivers will adopt a force task strategy to deal with the haptic information that is provided through the haptic feedback loop. Visual Feedback of { v , x}rel desired
{ v , x}rel ΔFs=0
+ e v -
eh
Fs
Contact Dynamics Gas Pedal + -
{ v , x}car
{ v , x}rel
-
{ v , x}lead car
+ Neuromusculoskeletal Dynamics
Driver
Car Dynamics
CNS αf
+
Lead Car αs
-
αp +
IDSS IDSS Sensor Suite
Inherent Pedal Dynamics
IDSS Logic
Virtual Pedal Dynamics Fv
Kv
Haptic Feedback: Kv, Fv
Figure 15: Block diagram of longitudinal control with haptic feedback. The haptic feedback is determined by the feedback logic, which receives information from the environment through a sensor suite. Force feedback Fv acts directly on the gas pedal, together with the contact force Fs which the driver exerts on the pedal, but does not change the dynamic characteristics of the pedal. The virtual stiffness Kv changes the dynamics of the gas pedal which is dependent on pedal position. Either force feedback or stiffness feedback is used. The driver can now base his control actions on both visual perception and haptic perception of the changes in the environment – ev and eh respectively.
24
2.4 From Force to Information Haptic gas pedal feedback has been applied successfully before in speed adaptation and collision avoidance systems. As a car-following support system haptic gas pedal feedback has more or less been mentioned only as another driving situation in which it might be beneficial (in the GIDS and PROSPER projects mentioned in Section 2.1), but this apparently never resulted in more specific research. Recently, Continental (2004) has announced its Active Distance Support system (ACDIS) which most closely resembles the haptic feedback system which is the topic of this thesis. This system, however, gives haptic feedback information on the state of the Adaptive Cruise Control system, rather than information on the state of the intervehicle separation between the own vehicle and a leading vehicle. This Chapter discussed the interaction between the human driver and the gas pedal with which the longitudinal motion of her/his vehicle is controlled. This interaction can be extended by introducing virtual forces or dynamics on the gas pedal, using an (electrical) actuator. The complementary haptic control loop (Figure 15) that is obtained by feeding back environmental parameters with these virtual forces or dynamics is based however, on one major assumption: environmental parameters can be converted into meaningful haptic information in a carfollowing context. What is meaningful haptic information in a car-following context? No direct connections between haptic information and car-following exist. However, relations between the characteristics of the interpretation of haptic information and car-following information can be identified. First, an increase in force is easily identified with an object moving towards the observer and vice versa. Relative movement of the vehicle in front of the own vehicle is the most important environmental information during car-following. Hence, force should increase with a decrease in inter-vehicle separation and vice versa. Second, the change in force related to the change in vehicle separation should be correlated such that the magnitude of the required control action can be estimated. Too much change in force might result in too much control action, too little change in force might result in too little control action. Third, task interpretation plays an important role in the admittance humans will use for the required control task. From the perspective of comfort, it would be preferable to have a force task, such that admittance can be high, and effort low. If car-following can be interpreted as a compensatory task in which the separation with a leading vehicle needs to be kept constant, the first and second observations mentioned above fulfil the third observation. This is shown in Figure 16. If it makes sense to let the required feedback force be a function of the separation 2 between the own vehicle and a leading vehicle, how does this feedback force make sense as a function of the gas pedal position? In Section 2.3 it was made clear that haptic feedback can be generated as an additional force on the gas pedal – which is independent of the gas pedal position – or as additional stiffness of the gas pedal – which is heavily dependent on the gas pedal position. The advantage of an additional force is that the increase in force can be chosen such that it is always well above JND. This assures that changes in the feedback can always be 2 The term separation is used deliberately, so as not to make presumptions about which physical representation is best suitable to quantify it.
25
felt. When using additional pedal stiffness, the increase in force is smaller for low pedal depressions and bigger for high pedal depressions. Depending on the pedal position drivers may or may not detect these changes in force. Fp
following too close
control force gap too big
desired following range
s
Figure 16: Inter-vehicle separation s related to feedback force Fp. The required car-following control force depends on the desired following separation. If the control force is kept more or less constant, the desired following range can be maintained. If the feedback force increases beyond the control force, drivers are likely to be following too close. Feedback forces below the control force are correlated with a big gap.
However, as was shown in Section 2.2.1, drivers depress the gas pedal deeply to command a relatively high acceleration in order to increase speed. Once the desired speed is reached, the gas pedal is released again to the approximate position for the desired steady state speed. When using an additional force as force feedback, drivers will not be informed immediately when they depress the gas pedal to accelerate, because, although the absolute force is higher due to the smaller inter-vehicle distance, the dynamic gas pedal characteristics remain the same. Only after the control actions have manifested themselves as changes in the environment will drivers experience an increase in force, since the inter-vehicle separation has changed. With the additional stiffness feedback, however, drivers will experience an immediate increase in force when they try to accelerate, because that is an inherent characteristic of increased stiffness: force increases proportionally to depression angle. In other words, drivers are instantaneously informed that the consequence of their control action (increased acceleration) will decrease the separation with the lead vehicle. So, to finalize this discussion, three important design issues for a haptic gas pedal feedback system can be distinguished: 1. Type of haptic feedback: additional force or additional stiffness 2. The relation between the haptic feedback and inter-vehicle separation 3. Quantification of inter-vehicle separation parameters These design issues cannot be viewed as separate design problems; rather, they are interrelated and must therefore be investigated as a whole. This Chapter intended to clarify the importance of these design issues and why they are interrelated. The derivation of algorithms that capture this interrelation is discussed in Chapter 3. 26
Chapter 3
Haptic Feedback Algorithms The basic idea behind the intelligent driver support system (IDSS) as it was introduced in Chapter one is to provide the driver haptically with the same information she/he acquires visually that is necessary to control the separation with a leading vehicle during car-following. The haptically transmitted information may keep the driver aware of the situation in front of the own car when visual attention is temporarily directed to, for example, in-vehicle devices such as a car-stereo system, a mobile phone or a navigation display. In practice, the implementation of all the required hardware to realise this idea does not pose any real problems. Actuators, sensor systems, and computer power to transform sensor information into actuator commands to the gas pedal are all readily available. The real challenge of this idea, however, is found in answering a single question – a question posed before, in Section 2.4 of the previous Chapter: ‘What is meaningful haptic information in a carfollowing context?’ In the next Section, Section 3.1, the kinematics of car-following are discussed which determine the basic relations from which the haptic feedback algorithm is constructed. It will also be shown how the commonly used ‘Newtonian’ variables 1 to describe kinematic relationships can also be combined to yield variables that represent car-following behaviour in a consequent manner over a range of vehicle speeds. In Section 3.2 mathematical formalisms for obstacle avoidance control are reviewed. It is discussed how they can be applied to the particular situation of car-following. Finally, in Section 3.3 the resulting formulations of the haptic feedback algorithms that have been used in this research are derived.
1 ‘Newtonian’ variables refer to position, speed, and acceleration, normally used to describe kinematic relationships of point masses.
27
3.1 Car-following kinematics The kinematics of car-following can be defined in the horizontal plane of the world axis system {Xe, Ye, Ze} (Figure 17b), by the position x , speed v , and acceleration a , of two vehicles: the own vehicle ( xcar , vcar , and acar , respectively) and the leading vehicle ( xlead , vlead , and alead , respectively). Since the haptic feedback system is installed in the own vehicle, it is convenient to base the origin of the observations of speed, position, and acceleration in the body axis system {Xb, Yb, Zb} of the own car (Figure 17a). This means that all observations are relative to the position, speed, and acceleration of the own car. Xe
Xb
ψ
Yb
ν
β
v, a
x Xb
Yb Ze
Zb (a) Car body-axis system
Ye (b) World-axis system
Figure 17: The car body-axis system (a) and the world-axis system (b). Xe is fixed to the North, Ye is fixed to the East, Ze is pointing towards the centre of the earth. The orientation of the car-body axis system is defined by the heading angle ψ. The speed vector orientation is defined by the course angle ν. The difference between the heading angle and the course angle is the slip angle: β = ν - ψ (adapted from Kruit, 2005).
Absolute position, speed, and acceleration of the vehicles are acting from their centre of gravity. Relative speed, and acceleration are thus acting from the centre of gravity of the lead vehicle (equations (3.1) to (3.3) respectively). The inter-vehicle separation distance xrel, however, is defined as the distance from the front bumper of the own car to the rear bumper of the lead vehicle (see equation (3.1) and Figure 18). xrel = ( xlead − llead ) − ( xcar + lcar )
(3.1)
vrel = vlead − vcar
(3.2)
arel = alead − acar
(3.3) vlead , alead
vcar , acar xcar
lcar
xrel
llead
xlead Figure 18: Definition of the direction of position x, speed v, and acceleration a, of the own car and the lead car in the horizontal plane of the world body axis system.
28
3.1.1
Following behaviour
Due to the coupling of equations (3.1) – (3.3) it is difficult to derive clear graphs that show the interactions between lead vehicle and following vehicle. Nevertheless, car-following research has shown (Goodrich and Boer, 2003; Piao and McDonald, 2003; Brackstone, Sultan, and McDonald, 2002; Ceder, 1979) that during a stable car-following situation, “drivers cycle around an approximate equilibrium spacing” (Ceder, 1979) when plotting the inter-vehicle separation distance xrel against the relative velocity vrel, see Figure 19. This phase-plane graph is both a very illustrating and useful graph, since it clearly shows the coupling of xrel and vrel such that it can be used for analyzing driver car-following behaviour. The most important observation from this cyclic behaviour was formulated by Rockwell (1972), who noted that maintaining a low relative velocity comes at the expense of more variance in the inter-vehicle separation distance and vice versa. 6
Separation state Starting state End state
4
vrel [m/s]
2
0
-2
-4
-6 16
18
20
22
24
26
28
30
32
34
36
xrel [m]
Figure 19: Cyclic phase-plane behaviour, observed during stable car-following. Data shown here was taken from a car-following experiment in a fixed base driving simulator.
More recent car-following research shows that the ‘equilibrium spacing’ mentioned by Ceder (1979) is a function of the speed at which drivers are driving (Piao and McDonald, 2003; McDonald et al., 1997). Especially the findings of Piao and McDonald (2003) are interesting and provide an important impetus for application in the design of the haptic feedback algorithms, below in Section 3.3. They conducted an experiment with an instrumented vehicle, capable of detecting inter-vehicle separation and following vehicle speed and acceleration. The instrumented vehicle had measuring equipment mounted in the rear of the vehicle, such that it could observe the following vehicle. Observations were made of anonymous drivers, that is, drivers did not know they were being observed by the instrumented vehicle, during driving in continuous traffic streams. In total, over 65 hours of driving data were collected on urban motorways, arterial roads, and streets in the cities of Oslo, Paris, and Southampton, of which 1804 time series of car-following situations were extracted.
29
Two major findings of Piao and McDonald’s experiment were that i) the inter-vehicle separation distance (xrel) increased with driving speed (Figure 20a) and ii) the standard deviation of the inter-vehicle separation distance (xrel) increased with increasing driving speed (Figure 20b). They hypothesised that these results might, for example, be explained by the capacity of drivers to estimate xrel.
a) The distance gap (xrel) in stable car-following increases with lead vehicle speed.
b) Standard deviation of distance gap (xrel) increases with lead vehicle speed. Figure 20: With increasing speed, drivers increase the inter-vehicle separation distance xrel (a), yielding an increase in the variation in inter-vehicle separation distance (b). Reproduced from Piao and McDonald (2003).
Drivers are believed to be poor judges of longitudinal distance (Boer, 1999; Rockwell, 1972) and especially in changes in longitudinal distance. Rockwell (1972) provides an indication that the necessary change in xrel before drivers can perceive a change at all obeys Weber’s law: Δxrel ≈ Kxrel
(3.4)
where Δxrel is the change in separation distance, xrel is the initial separation distance and where 0.1 0
(3.10)
Because the gradient c 0,i is a vector, the total required control action c to steer the controlled system away from all obstacles in field with N obstacles Ai (with i=1..N ) without colliding with any of the obstacles is the sum of all obstacle gradients c 0,i , equation (3.11). c = c 0,1 + c 0,2 + ... + c 0, N
(3.11)
To apply this method, the GPF needs to be calculated at every time step Δt for all obstacles that are within line-of-sight of the controlled system. In the case of autonomous vehicles, as Krogh (1984) describes in his paper, a final control action vector is necessary to keep the system going: the goal attraction vector c g . The goal attraction vector is, therefore,
35
always pointed towards the destination of the vehicle. Autonomous control is beyond the scope of this thesis, however, and the goal attraction vector will not be elaborated on any further. The generalised potential field and car-following
One of the most important aspects of the GPF is its dependence on both position and velocity of the controlled system relative to the obstacles. As was mentioned earlier, in Section 3.1.1, car-following requires a weighing of maintaining low relative velocity at the cost of a higher relative position or vice versa (Rockwell, 1972). Thus, in order to provide drivers with the right kind of information it should contain both speed and position information. However, the GPF algorithms are based on static objects, whereas during car-following the ‘obstacle’ that needs to be avoided is the moving lead vehicle. This will make calculating the reserve avoidance time Tr more difficult, since movement towards or away from the lead vehicle does not just depend on the own vehicle any longer, but on the movement of the lead vehicle too. The assumption of constant acceleration away from the obstacle to determine equations (3.8) and (3.9) to calculate the potential of equation (3.7) does not hold anymore. The use of a limited available acceleration of the controlled element, which was assumed to be acting constantly in case of an avoidance manoeuvre is, nevertheless, useful in that it demonstrates the incorporation of the limits of system dynamics in the avoidance algorithm. A feature of the GPF that is readily applicable to car-following is the fact that there is no potential Pi ( x, v ) in case vi(t0)≤0. So, when the lead vehicle is moving away from the following vehicle there is no feedback required, since the safe-field-of travel is already expanding, which is the goal the driver support system is trying to achieve. The GPF was designed to handle multiple objects surrounding the own vehicle. In the case of car-following, there is, in general, only one ‘obstacle’ to avoid and that is the lead vehicle. Furthermore, the direction in which the avoidance vector c should be pointing is always in line with the obstacle normal vector n of the lead car. This greatly simplifies the GPF calculations, eliminating the need to determine the gradient of the potential field, since the direction of the avoidance vector c is known beforehand. There are cases with multiple vehicles in front of the own car, where it is difficult to distinguish which vehicle is the lead vehicle. For example, when a vehicle is cutting in, or cutting out at highway entries and exits, respectively. These situations do require taking into account more than one ‘obstacle’. But, since the gas pedal, as a haptic information channel and as the longitudinal control channel, cannot give directional information other than in the longitudinal direction of the car-body axis, a different solution to this multiple car problem is required. This problem has been investigated and a solution has been proposed and tested by de Winter (2004a; 2004b) and de Winter et al., 2004. The solution de Winter (2004a; 2004b) proposes is based on the combination of the haptic feedback algorithms described below in Section 3.3 and ‘vector field histograms’ (Borenstein and Koren, 1991). The design of the vector field histogram that is used in the solution of de Winter assigns a local time-headway (THW) and time-to-contact (TTC) to all vehicles within the boundaries of the field. An algorithm is developed to determine the total weight of all vehicles, such that the result is a single weighted THW and a single weighted TTC that are representative of the entire situation in 36
front of the own vehicle. The results show that the introduction of weighted THW and TTC result in smooth transitions in force when another vehicle cuts in of moves out from in front of the own vehicle. Furthermore, drivers do not seem to change their driving behaviour due to this algorithm when multiple vehicles manoeuvre laterally in front of the own vehicle. This thesis, however, will not elaborate on this problem of multiple car situations but focuses on the single car-following problem. Finally, the GPF was designed to calculate a control avoidance vector c which has a magnitude ||c||→∞ when the distance to the obstacle di→0. Using this kind of algorithm for haptic feedback purposes is unacceptable and impossible. The goal is to provide informational haptic feedback, which means the amount of force on the gas pedal that can be used for feedback is very limited. Furthermore, if the amount of force on the gas pedal is allowed to increase such that drivers will not be able to depress the gas pedal anymore, the system is effectively telling the driver what to do. In other words, control authority is taken away from the driver. Also, a quick and substantial increase in force, that is well above the force drivers can resist might even lead to injury. Finally, from a technical point of view, delivering high forces with an electrically controlled actuator requires expensive equipment, which would make the system unattractive financially for potential customers. Summarising, the beneficial features of the GPF that can be applied in haptic feedback for car-following are: i) speed and position dependence, ii) no feedback when the lead vehicle is moving away from the own vehicle, and iii) system dynamics included in the potential field.
3.2.2
Impedance control for obstacle avoidance
Hennessey, Shankwitz, and Donath’s (1995) impedance control ideas for obstacle avoidance in vehicle collision avoidance originated from impedance control research in robot obstacle avoidance done by Hennessey and Donath (1992). Mechanical impedance is used to characterise the dynamic response of the controlled system to disturbances that act on its motion. For a mobile robot, this problem is dealt with at low speeds, static obstacles, and involves complicated path-planning algorithms. During driving, fast algorithm updates are required, since the dynamics of collision avoidance in traffic are high frequency and involve moving ‘obstacles’, while path planning is executed by the driver. Therefore, the concept of mechanical impedance was simplified from the 6 degrees of freedom (DOF) for robot arms, to a simple 1 DOF method that represents a ‘virtual bumper’ in front of the own vehicle. The ‘virtual bumper’ is mechanically represented by a virtual spring-damper system that is attached to the front of the own vehicle. The undisturbed state of this spring-damper system is a computer-controlled boundary, which Hennessey et al. (1995) called the vehicle’s personal space (note the similarity with Gibson and Crooks’ (1938) safe-field-of-travel mentioned in Chapter 1). Whenever another vehicle enters the own vehicle’s personal space, the virtual bumper is deflected and generates a virtual force F based on the dynamics of the virtual springdamper system, acting on the own vehicle (see Figure 24). The magnitude of this virtual force F depends on the depression Δx, the rate of depression Δx� and the stiffness k and damping b of the virtual bumper:
37
(3.12) F = k Δx + bΔ�x The virtual force F can then be used as a command to move the own vehicle in the direction of the applied force, that is, away from the lead vehicle. A simple control law is proposed which commands an acceleration ac away from the lead vehicle based on F: ac = − KF
(3.13)
in which K is a simple control gain. The virtual bumper concept is extended further by Hennessey et al. (1995), to 2 DOF, such that lateral control can be included as well. Since lateral control is beyond the scope of this thesis, it will not be elaborated on. Haptic feedback with impedance control
The virtual bumper concept based on impedance control seems to be readily applicable to haptic gas pedal feedback. Since the resulting impedance of the system due to an encroaching vehicle is expressed as a force, there should not be any difficulties in scaling this force such that it can be applied to the gas pedal. Position and velocity of the lead vehicle can be measured and used in the algorithm. However, as was shown in Section 3.1.2, inter-vehicle separation based on time-headway – equation (3.5) – and time-to-contact – equation (3.6) – rather than relative position and speed yield variables that represents car-following behaviour in a more useful manner over a range of vehicle speeds. This would require some modifications such that the virtual bumper virtual force F can be related to THW and TTC instead. k
Normal, no encroachment condition
b x Δx, Δx� F
k
Encroachment condition
b Figure 24: Virtual bumper example. The stiffness k and damping b of the virtual bumper will yield a virtual force F when a lead vehicle is moving into the own vehicle’s personal space, causing a deflection Δx of the virtual bumper with undisturbed length x. Adapted from Hennessey, Shankwitz, and Donath (1995).
3.3 Haptic feedback algorithms The implementation of the haptic feedback algorithm was envisaged by the Nissan Motor Company Ltd. engineers to be found in the metaphorical concept of the ‘Magic Bumper’, a virtual bumper similar to that described by Hennessey, Shankwitz, and Donath (1995) above. The own vehicle’s material bumper would be extended with the metaphorical ‘Magic Bumper’ which would reach well ahead of the own car. Whenever another vehicle would enter the 38
operational boundaries of the ‘Magic Bumper’ this virtual bumper would deform, analogous to Gibson and Crooks’ (1938) safe-field-of-travel. The amount of deformation would be a measure of the amount of required haptic feedback (Figure 25). Intuitively, this resembles the compression of an air-cushion attached to the front of the vehicle. The more the cushion is depressed by a leading vehicle closing in on the own vehicle, the more the tension, and hence the force on the own car, builds up in the cushion. Another intuitive example is the approach of two similar magnetic poles. The closer the poles come together, the higher the repulsive forces they experience, and the more difficult it becomes to make them move even closer together. These metaphorical concepts show that there are ways in which a, in reality non-existent, haptic relationship between an environment and the control of a vehicle can be established that intuitively makes sense for humans.
a) The ‘Magic Bumper’ extends in front of the own vehicle as a protective cushion.
b) The protective cushion deforms by the closing in of a lead vehicle. Figure 25: Metaphorical concept of the ‘Magic Bumper’. The ‘Magic Bumper’ extends in front of the own vehicle (a) as a safety cushion that deforms when a lead vehicle enters the operational boundaries of the ‘Magic Bumper’ (b), analogous with Gibson and Crooks’ (1938) safe-field-of-travel and Hennessey, Shankwitz, and Donath’s (1995) virtual bumper. The amount of deformation is a measure of the amount of haptic information that needs to be communicated to the driver.
3.3.1
Nissan force feedback
The force feedback algorithm that was derived by Nissan Motor Company Ltd. is an impedance based algorithm. The algorithm uses THW and TTC rather than xrel and vrel to generate a virtual force FPP [N] acting on the own vehicle whenever a lead vehicle is entering the safe-field-of-travel: b ⎞ ⎛ a + FPP = ⎜ (3.14) ⎟⋅ g ⎝ THW TTC ⎠ with constants a=1 [kgf/s] and b=8 [kgf/s], which are empirically determined from the distribution of measured THW and TTC during car-following – see Figure 26 and Figure 27 – and g=9.81 [m/s2], the gravitational constant at sea-level. A THW≤1 represents the lowest 25% THW’s of the distribution, therefore a was chosen to be equal to one. A TTC≤4 represents the lowest 5% of the distribution of TTC at driving speeds >40 [km/h], but b was chosen to be eight
39
to include most observed situations. Since THW and TTC decrease when the lead vehicle is moving towards the following vehicle, the virtual force FPP increases and vice versa. The objective representation of an encroaching lead vehicle by a virtual force as defined by equation (3.14) might not be perceived as such by humans. From psychophysics it is known that subjective perception of force is related to the physical quantity through Stevens’ power law (Stevens, 1957): S = kI n (3.15) in which S is the subjective sensation magnitude, k a constant depending on the sensed continuum, I the physical stimulus intensity, and n is a constant depending on the modality. When plotted on a log-log scale, the power law yields a straight line relating subjective sensation magnitude S to the objective stimulus intensity I with a slope n.
9%
frequency
8%
100%
Freeway Major city road Freeway Major city road
90% 80%
7%
70%
6%
60%
5%
50%
4%
40%
3%
30%
2%
20%
1%
10%
0% 0.0sec.
0.5sec.
1.0sec. 1.5sec. time headway
2.0sec.
accumulative frequency
10%
0% 2.5sec.
Figure 26: Distribution of measured time-headways during car-following on freeways and city-roads near Tokyo, Japan. Reproduced from Yamamura (2002).
[km/h]
Figure 27: Distribution of measured time-to-contacts (TTC) during car-following on freeways and city roads in Europe: M3a-c (UK, London, M3), A1a-b (Germany, Hamburg, A1), and BPa-b (France, Paris, Boulevard Périferique), DIATS (1998).
40
Applying Stevens’ power law to the feedback force FPP, equation (3.14) can be written as Fforce [N], with limitations on the minimum and maximum forces: Fforce
⎧0 ⎪ n = ⎨kFPP ⎪ ⎩ Fmax
min ∀ FPP < FPP min max ∀ FPP ≤ FPP < FPP
(3.16)
∀ FPP > F
max PP
The constant n≈0.90 is determined by equation (3.17), in which Fmin=4.9 [N] and Fmax=24.5 [N], the minimum and maximum forces applied by Nissan to the gas pedal respectively; and min max FPP = 4.9 [N] and FPP = 29.4 [N], the minimum and maximum virtual forces the carfollowing situation is allowed to generate respectively: n=
log Fmin − log Fmax min max − log FPP log FPP
(3.17)
The constant k≈0.93 is determined by equation (3.18): k=
Fmax max n ( FPP )
(3.18)
The feedback algorithm (3.16) yields the feedback force in [N] depending on THW and TTC as visualized below in Figure 28. 0.3 0.25
danger
145 2.5 44. 2
0.2
20 17.5
0.15
15 12.5
TTC
-1
[1/s]
0.1
10 7.5 0
0.05 0 -0.05 -0.1 -0.15
TTC −1 =
-0.2 -0.25 -0.3
0.5
1
1.5
2
−vrel xrel
2.5
3
THW [s]
Figure 28: The force feedback profile as a function of THW and TTC-1. The solid lines represent iso-force levels (in [N]). The spiraled lines are typical measured car-following data (60 seconds) from a fixed base driving simulator for a subject that was asked to maintain a THW of approximately 1 [s]. The haptic feedback system was not activated.
Discussion of the feedback algorithm
The Nissan force feedback algorithm makes use of position and velocity feedback, both expressed in the desired THW and TTC, as was discussed in Sections 3.2.1 and 3.2.2 above. There is, however, feedback when TTC