Hardness for Explicit State Software Model Checking Benchmarks Eric G. Mercer Department of Computer Science Brigham Young University Provo, UT 84601
[email protected]
Neha Rungta Department of Computer Science Brigham Young University Provo, UT 84601
[email protected]
Abstract
successors in either a breadth-first or depth-first manner. A path or state in the transition graph that violates a user specified property is known as an error in the model. Since model checking considers all possible thread interactions, it enables us to find subtle concurrency errors deep in the execution trace. These errors are hard to detect in a traditional validation technique based on test vector generation because scheduling decisions cannot be controlled by the input vectors. The primary challenge in model checking is managing the size of the transition graph. The increase in the size of the transition graph is also known as the state space explosion. For large software systems, the computation resources are exhausted before a search finishes exploring the transition graph. Directed model checking is one solution to the state space explosion problem. It aims to guide the search to parts of the transition graph where errors are more likely to exist [11, 22, 7, 27, 23]. It assumes an error exists in the software, and the goal is to find the error before it runs out of computational resources (time or memory). Directed model checking techniques use heuristics to rank the states in order of interest with states estimated to be near errors explored before the other states. The performance of a given heuristic estimate is compared to existing heuristic functions, or a DFS, with an empirical analysis. A reduction in the number of states generated and a decrease in the total time taken before error discovery are two commonly used metrics to measure performance gains of a directed model checking technique. The reliance of directed model checking algorithms on an empirical analysis to assess and validate the performance gains of a given technique motivates a need to characterize the quality of models used in such an analysis. The set of models used to benchmark directed model checking should at least be computationally expensive for simple variants of DFS or BFS techniques. In other words, if the baseline model checking algorithm easily solves a benchmark for directed model checking, then the benchmark is not successful or useful in delineating performance. There is a need
Directed model checking algorithms focus computation resources in the error-prone areas of concurrent systems. The algorithms depend on some empirical analysis to report their performance gains. Recent work characterizes the hardness of models used in the analysis as an estimated number of paths in the model that contain an error. This hardness metric is computed using a stateless random walk. We show that this is not a good hardness metric because models labeled hard with a stateless random walk metric have easily discoverable errors with a stateful randomized search. We present an analysis which shows that a hardness metric based on a stateful randomized search is a tighter bound for hardness in models used to benchmark explicit state directed model checking techniques. Furthermore, we convert easy models into hard models as measured by our new metric by pushing the errors deeper in the system and manipulating the number of threads that actually manifest an error.
1
Introduction
Model checking is a formal approach for systematically exploring the behavior of a concurrent software system to verify whether the system satisfies the user specified properties [21, 13]. A model of a concurrent software system is a transition graph that consists of states and transitions. Each state in the transition graph is a snapshot of the program condition which consists of the values of all variables at a specific program location; while the transitions in the graph are rules that represent the change in the program condition from one state to another. Exhaustive search techniques such as breadth-first search (BFS) or depth-first search (DFS) are commonly used to explore all the states in the transition graph. Starting from an initial state, the search technique computes the enabled transitions at each state to generate and explore the possible 1
to classify and characterize benchmarks for directed model checking to control for this situation. We believe that understanding the benchmarks improves understanding in the algorithm. The work in [6] is the pioneering research in characterizing the hardness of benchmarks for directed model checking. The benchmarks are guaranteed to contain an error and the goal is to rank the benchmarks in terms of effort, time and memory, required for error discovery. The work in [6] presents the traditional syntactic metrics for hardness in a set of Java benchmarks such as thread count, class count, location count, etc., and it then defines a semantic hardness metric as a lower bound on the estimated number of paths in the model that contain errors. The lower bound is computed by conducting a large number of stateless random walks on the model. Follow on work in [5] shows that only 5 to 20 non-deterministic DFS trials are required to guarantee that one DFS trial successfully discovers the error. The DFS trial results are reported on a set of seven models that are classified as hard by the semantic metric for directed model checking in [6]. The results in [5] contradict the intuition that a hard model used for benchmarking directed model checking needs to minimally challenge basic search techniques and indicates that the reported lower bound on the hardness for these models in [6] is not sufficient. To provide a semantic metric with a tighter bound on the estimated number of errors in a benchmark for explicit state directed model checking, we define a new hardness metric that is computed by conducting a large number of non-deterministic DFS trials. To test the effectiveness of this new hardness metric, we conduct an analysis on a set of 36 models that have not been previously analyzed with nondeterministic DFS trials. In a large subset of the 36 models that have a low estimated number of errors as computed by random walk, all non-deterministic DFS trials conducted are successful in finding an error. The large performance gap between a random walk and non-deterministic DFS indicates that a hardness metric based on non-deterministic DFS trials is a better starting baseline measure of hardness than the one computed using random walk. To aid researchers in designing hard benchmarks, we identify certain factors that control the hardness in models as measured by the new semantic hardness metric. Traditionally, the total number of threads is a syntactic measure of hardness used when evaluating directed model checking approaches. Our analysis indicates, however, that arbitrarily increasing the total number of threads in the model does not necessarily challenge the new hardness measure. In fact we create two versions of several models with the same number of total threads that have diametrically opposite hardness values as measured by the new metric. As such, we show that the type of threads that cause errors to be discovered and the depth at which errors occur in the transition
graph are two controlling factors that affect the hardness measure. We present evidence for these factors in making seemingly easy models into hard models by systematically varying these factors in the models. The main contributions of this paper are: (1) Defining non-deterministic DFS (randomized DFS) as a tighter bound on the hardness of a model when compared to random walk, (2) Showing correlation between error discovering threads and depth of errors with the hardness of models, and (3) Characterizing a set of existing benchmarks as well as creating hard benchmarks based on the new metric.
2
Background and Motivation
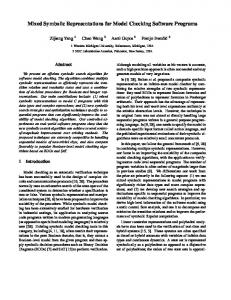
Recent work in [6] defines path error density as a conservative probability estimate on the number of paths in a model that contain an error. This estimate is a lower bound on the total number of paths that actually contain an error in the model. To compute the path error density, a large number of independent random walks are conducted on the model. The probability estimate is the ratio of random walks that find an error to the total number of random walks. This estimate is assigned as the path error density of the model. The path error density of an easy model is close to one if a large number of random walks find an error. This demonstrates that there is a high probability of finding an error along an arbitrary path in the program which makes the model extremely easy in terms of error discovery. Conversely, the path error density of a hard model is close to zero if only a few random walks are successful in finding an error. The work in [6] also reports syntactic metrics, like lines of code and thread count, on the models used in their study. The study shows that syntactic metrics are not able to predict path error density values. A model that looks syntactically hard may actually be semantically easy. This syntax-semantic gap creates a need for a semantic metric, like path error density, to classify benchmarks for directed model checking until we better understand the relationship between syntax and error discovery. Random walk is a stateless search technique that does not store information on states that are already explored. In Figure 1(a), we present the pseudo-code for a pure random walk with no backtracking. Starting from an initial start state (s0 ), a random walk explores a sequence of states in the transition graph expanding a random successor at each state in the path (lines 4 − 7 and 11). If the random walk encounters an error, it reports the error (lines 8−10); however, when the random walk reaches a node with no successors or a depth greater than the specified depth bound (line 5), it simply terminates the search (line 12). The path error density does not provide a tight bound on the estimated number of paths in a model that contain an error due to the inherent limitations of random walk. New
procedure Random Walk Init(s0 ) 1: s := s0 , depth := 0 2: Random Walk(s, depth)
procedure Random DFS Init(s0 ) 1: Visited := {s0 } 2: Random DFS(s0 , V isited) 3:
3:
procedure Random Walk(s, depth) 4: Xsucc := get successors(s) 5: while (Xsucc 6= ∅ or depth ≤ depth bound ) do 6: s := get random element(Xsucc ) 7: depth := depth + 1 8: if error(s) then 9: print “1 Error Found ” 10: return 11: Xsucc := get successors(s) 12: print “No Errors on this Path”
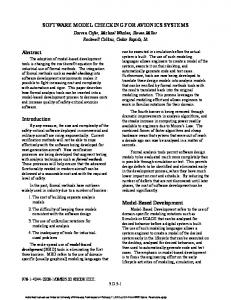
procedure Random DFS(s, V isited) 4: if (within time bound()) then 5: if error(s) then 6: print “1 Error Found ” 7: exit 8: Xsucc := get successors(s) 9: randomize elements(Xsucc ) 10: for each s0 ∈ Xsucc do 11: if s0 6∈ V isited then 12: V isited := V isited ∪ {s0 } 13: Random DFS(s0 , V isited) 14: else 15: print “Out of Time”
(a)
(b)
Figure 1. Pseudo-code for randomized search techniques (a) True random walk with no backtracking (b) DFS with a randomized transition order
research in [20] shows that the total coverage obtained by a pure random walk is largely dependent on the structure of the graph. It also shows that coverage of the random walk increases logarithmically with the number of computation steps; thus, during the initial phase of the random walk, a large number of new states are visited, but with time, the number of newly visited states decreases rapidly. Experimental analysis indicates that the coverage achieved by pure random walk ranges between 100% to 1% for transition graphs commonly used in model checking [15, 4, 2]. In models where pure random walk achieves medium to low coverage, the path error density measure does not accurately reflect the effort required in finding an error in the model because the coverage is so sporadic. The work in [5] shows that a parallel randomized statespace search (PRSS) is very effective in finding errors for models of [6] with relatively low path error densities. Intuitively, PRSS runs independent randomized DFS trials in parallel to discover an error. A randomized DFS is simply a variant of the rudimentary DFS that randomizes the order of its successors in the search. The PRSS approach computes the required number of nodes such that with every node running a randomized DFS trial in parallel at least one node finds the error in the model. In Figure 1(b), we present the pseudo-code for a randomized DFS. It explores a sequence of states starting from the start state (s0 ), where at each state it generates a set of all possible successors, randomizes their order, and picks one successor to explore in a depth-first manner (lines 8 − 13). When the search encounters a node with no successors, it backtracks to the next node in the list of randomized succes-
sors. A randomized DFS is a stateful search technique that maintains a set of visited states to track every explored state (lines 10−11). The randomized DFS terminates when an error state is encountered (lines 4 − 7) or reaches the specified time bound (lines 4 and 14 − 15). Note that the algorithm for the randomized DFS presented in Figure 1(b) assumes that the model contains an error. Memory resources limit the amount of time a randomized DFS trial can run. Unlike a random walk, memory in a randomized DFS trial is exhausted if it is run long enough. For seven subjects presented in [6] with a relatively low path error density, the PRSS requires only between 5 to 20 nodes to guarantee error discovery in at least one randomized DFS trial [5]. This is counterintuitive since the models labeled hard seem so easy. A hard model should at least challenge a randomized DFS which is a basic search technique used in model checking tools. It is counterintuitive for a small number of parallel randomized DFS trials in the PRSS approach to consistently discover errors in supposedly hard models. This contradiction motivates a need for defining a better notion of hardness in models for benchmarking path analyses techniques and model checking algorithms. We especially need this metric to characterize and classify benchmarks for comparative studies in explicit state directed model checking.
3
Error Density Measure
The path error density based on a stateless random walk underestimates the hardness of models for benchmarking stateful directed model checking algorithms. Specifically,
it tends to label models hard even when the error discovery is trivial with a stateful randomized DFS. A hard model used for benchmarking directed model checking algorithms needs to at least be computationally expensive in terms of time and space for a stateful randomized DFS. To demonstrate the utility of having a stateful hardness measure, we re-run the PRSS analysis for 36 models in [6]; however, instead of computing the number of nodes required to run randomized DFS in parallel to guarantee at least one node finds an error, we record the number of randomized DFS trials that encounter an error. Based on randomized DFS trials, we define a new hardness metric, the observed randomized-DFS (R-DFS) error density which is the ratio of the randomized DFS trials that find an error to the total number of randomized DFS trials conducted. Since the observed R-DFS error density is based on a stateful search, it provides a tighter bound on the hardness of models for benchmarking explicit state directed model checking algorithms compared to path error density which is computed using random walk. The underlying assumption is that randomized DFS always achieves better coverage of a transition graph compared to a random walk. We do not consider comparisons with BFS because variants of BFS often have prohibitively large frontier sizes that render BFS techniques ineffective for error discovery in the benchmark set.
3.1
Experiment Design
To compare path error density and observed R-DFS error density we conduct random walk and randomized DFS trials on a cluster of 618 nodes. Every node in the cluster has 8 GB of RAM and two Dual-core Intel Xeon EM64T processors (2.6 GHz). The execution time for a single randomized DFS trial is bounded at one hour. We pick the time bound to be consistent with the other recent studies [6, 5]. Later in this section we also study the affects of changing the time bound. The programs in this study are compiled using Java 1.5 and verified by the Java PathFinder (JPF) v4.0 model checker with partial order reduction turned on [28]. For each model in test we conduct 100 randomized DFS trials to compute its semantic hardness. We experimented with different number of trials to pick an upper bound on the required number of trials for predicting the semantic hardness. For the models in our test suite we found that 100 trials are sufficient to compute the semantic hardness. To compute the path error density, we execute 10,000 trials of random walk, where one trial is a single random walk execution or single path in the program. The original study of [6] uses between 1000 and 10,000 random walk trials to estimate the path error density of the model.
3.1.1
Independent Variable
We vary models, the independent variable, in our study to test whether randomized DFS provides a tighter bound on hardness of benchmarks used in explicit state directed model checking. We conduct the study on a set of 36 models used in the benchmarking analysis of [6] and have not been previously analyzed with a randomized DFS. The set of benchmarks encompasses a wide variety of Java programs with concurrency errors. The test suite includes programs derived from concurrency literature, small to medium-sized realistic programs, models designed to exhibit Java-specific errors described in [10], and models developed at IBM to support their analyses research [9]. Many models have been made parameterizable to control the number of threads for studying their effect on the path error density. 3.1.2
Dependent Variables and Measures
The dependent variables in this study are the path error density and the observed R-DFS error density values. We compute the values of the path error density rather than report the values in [6]1 . We also compute the observed R-DFS error density which is the ratio of randomized DFS trials that find an error over the total number of randomized DFS trials executed. On the scale of hardness, an observed R-DFS error density of 1.00 indicates an extremely easy model while an observed R-DFS error density of 0.00 indicates a very hard model. Note that this scale is consistent with the path error density hardness scale of [6] where probabilities close to one indicate easy models whereas probabilities close to zero indicate hard models. We measure the number of states generated during the randomized DFS trials to gain a better understanding on the effort required for error discovery by the randomized DFS trials in terms of time and memory resources.
3.2
Results
The results of the study are presented in Table 1 where the first column indicates the name of the subject, and the maximum number of threads created in the subject is indicated in the parenthesis (Name(Thread Num)). The second column specifies the input parameters (Params) used by the subject (see [6] for parameter details and other syntactic metrics such as thread count, class count, location count, etc.). In the section of Table 1 labeled randomized DFS trials, we present four statistics: the observed R-DFS error density, the minimum and maximum number of states generated in a single trial of randomized DFS among the error discovering trials, and the average number of states generated across all randomized DFS trials that find an error. 1 The values in [6] are computed on JPF3.1.2 while we do our analysis on JPF4.0.
Table 1. Comparing path error density and randomized DFS Subject Name(Thread Num) Account-NoDeadlkCk(6) Account-NoExcpCk(6) AccountSubtype(10) Airline(21) Airline(7) Airline(7) Airline(21) Alarm Clock(4) Alarm Clock(4) AllocateVector(3) AllocateVector(3) AllocateVector(3) AllocateVector(3) Clean(21) Clean(3) Deadlock(3) Deadlock(3) Deos(4) LinkedlistSync(5) Piper(17) Piper(9) ProducerConsumer(11) ProducerConsumer(7) ProducerConsumer(5) RaxExtended(6) Reorder(3) Reorder(7) ReplicatedWorkers(9) RWNoExcepChk(5) TwoStage(3) TwoStage(8) TwoStage(5) WrongLock(12) WrongLock(12) WrongLock(3)
Params none none 8,1 20,8 6,2 6,1 20,2 9 4 8,20,1 2,20,4 2,20,1 2,100,1 10,10,1 1,1,12 1 2 abstracted 4,100 2,8,4 2,4,4 2,8,4 2,4,4 2,2,4 2,3 1,1 1,5 8,2,0,10,.001 2,2,100 1,1 2,5 2,2 10,1 1,10 1,1
Path error density[6] 0.549 0.077 0.152 0.069 0.030 0.003 0.000 0.093 0.083 0.441 0.294 0.084 0.017 0.289 0.033 0.450 0.379 0.190 0.000 0.083 0.029 0.967 0.956 0.768 0.128 0.030 0.043 0.948 0.769 0.043 0.028 0.022 0.478 0.200 0.068
The analysis in Table 1 shows that for a large number of models that have near zero path error densities with random walk, almost all of the randomized DFS trials find an error. For example, the model Clean with parameters (1,1,12) has a path error density of 0.033 while its observed R-DFS error density is 1.00. The parameterized versions of the TwoStage and Reorder models have a path error density of less than 0.050 but have an observed R-DFS error density of 1.00. In 26 examples presented in Table 1 out of the total 36 subjects, all 100 trials of randomized DFS find an error. Furthermore, in some models with a low path error density and high observed R-DFS error density, the minimum and average number of states generated in the randomized trials is very small. This indicates that the computation cost in terms of memory for error discovery in these models is very low. Fourteen models with an observed R-DFS error density of 1.00 generate less than 1000 average states before error discovery. In fact, some models like TwoStage with parameters (1,1) and ProducerConsumer with parameters (2,4,4) generate a maximum of only 127 states and 372 states respectively in a single randomized DFS trial out
observed R-DFS error density 1.00 0.48 0.34 0.49 1.00 1.00 0.01 1.00 1.00 0.99 1.00 1.00 1.00 0.96 1.00 1.00 1.00 1.00 1.00 0.96 1.00 1.00 1.00 1.00 1.00 1.00 1.00 0.97 0.80 1.00 1.00 1.00 1.00 1.00 1.00
Randomized DFS trials Number of States Minimum Average Maximum 182 27,928 1,089,171 405 1,749,259 13,151,326 250 248,714 3,245,340 101 571,214 6,479,374 40 226,846 5,112,586 50 1,618,915 6,401,539 5,249 5,249 5,249 28 112 288 41 111 147 33 198,206 4,623,001 34 5,646 143,866 34 4,832 7,773 34 28,406 40,248 206 283,357 5,497,056 12 907 987 12 17 33 5 6 8 7 747 2,638 9,324 10,014 12,351 146 621,340 7,921,766 1,611 189,872 1,288,076 127 261 12,334 97 116 372 93 112 210 25 1,783 19,502 16 55 80 15 49,151 65,490 1,739 1,801 1,866 52 533 2,031 20 57 127 30 1,759,759 3,702,115 34 3,301 8,638 61 94 167 25 1,574,058 2,966,459 13 25 43
of the 100 trials. The small state counts further show for these models that a stateful search technique is effective in finding an error when compared to random walk. The fact that most models have a hardness of 1.00 under the observed R-DFS error density metric shows that the set of models used in [6] severely lacks in diversity when evaluating directed model checking approaches. It also indicates that the more varied distribution of hardness values computed by the path error density in [6] is not representative of the amount of effort required to find errors in these models with stateful search methods. The examples in Table 1 that appear hard in terms of the observed R-DFS error density are interesting to study in order to identify factors that cause a low observed R-DFS error density in the models. For example, the Accountsubtype model with parameters (8,1) is a moderately hard model with an observed R-DFS error density of 0.34, and the average number of states generated before error discovery is significant. Further examination of the Accountsubtype model may assist in identifying the factors affecting the low observed R-DFS error density.
There are two other parameterized subjects that have a low observed R-DFS error density: Airline with parameters (20,2) and Piper with parameters (2,16,8). These are interesting subjects because other parameterized versions of these models have a high observed R-DFS error density. For example, Piper with parameters (2,4,4) and Airline with parameters (6,1) have an observed R-DFS error density of 1.00.
Observed R-DFS error density
3.3
1
Effect of the Time Bound
The observed R-DFS error density measure in Table 1 is dependent on the time bound of 1 hour set for the randomized DFS trials. We test the effect of the time bound on the observed R-DFS error density by running randomized DFS trials on a set of hard models using different time bounds. In the next section we show how to create the hard models. The independent variable in this study is the time bound while the dependent variable is the observed R-DFS error density. We expect the observed R-DFS error density to increase with the time bound. In Table 2 we present results of the study. Table 2. Increasing Time Bound Subject Name (Thread Num) Airline(21) Reorder(11) TwoStage(9) TwoStage(10) TwoStage(12) Wronglock(22)
Params 20,2 9,1 7,1 8,1 10,1 1,20
observed R-DFS error density 1 hour 2 hours 3 hours 0.01 0.00 0.00 0.06 0.45 0.37 0.41 0.69 0.93 0.04 0.03 0.07 0.00 0.00 0.00 0.18 0.20 0.20
In certain models, the observed R-DFS error density steadily increases with time while in others, it is not clear how the observed R-DFS error density changes. In the TwoStage model with parameters (7,1), the observed RDFS error density increases from 0.41 to 0.93. This still shows that Twostage(7,1) is a moderately hard model for stateful search techniques because it takes an upper bound of 300 computation hours—a significant amount of resources—to obtain an observed R-DFS error density of 0.93 in the model. In essence, the time bound allows researchers to set their own threshold of hardness. In general, we expect a decrease in time bound makes a model progressively harder and vice-versa. In the following section, we use models defined as hard in terms of the observed R-DFS error density measure to identify the factors that contribute toward hardness other than the time bound. In other words, given a fixed time bound, how do we make an easy model hard? We show that the number of threads that manifest an error in the model and the depth of the transition graph at which errors occur
0.8
0.6
0.4
0.2
0 (8,2) (9,1) (7,10) (1,16) (16) (16) Account- ProducerPiper subtype Consumer
(7,1) (4,4) TwoStage
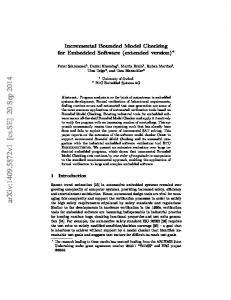
Figure 2. Same thread count in a model yields different hardness results
assist in making hard models. We also use these factors to convert some easy models into hard models in a given time bound.
4
Controlling Factors for Hardness
The total thread count in a model is not a good indicator of its hardness based on our new metric. Even though the state space of the model grows exponentially with an increase in the total number of threads in the model, it does not necessarily make it harder for randomized DFS to find the errors. In Figure 2 we show two versions of four different models. The two versions of each model have the same total number of threads; however, one version is extremely easy with a high observed R-DFS error density while the other version is hard with a low observed R-DFS error density. For example, the model Accountsubtype with the parameters (8,2) and (9,1) have an observed R-DFS error density of 0.20 and 0.99 respectively. We observe a similar disparity in observed R-DFS error density for the other models in Figure 2. Simply increasing threads or concurrency does not reduce the number of errors in the model which motivates a need to identify other factors that affect hardness in models. In an empirical study in this section we show that the number of threads that actually manifest an error in the model and the depth of the errors are the controlling factors of hardness in models based on the new metric. The empirical study in this section uses the same experiment design described in the previous section for Table 1; however, we specifically vary models in this study based on the control-
Table 3. Summary of what makes certain models from [6] hard Subject Accountsubtype
Wronglock ProducerConsumer
Reorder TwoStage Piper
Airline
(Params) : Making models Hard (#correctAccounts, #incorrectAccounts) : We increase the number of threads that create #correctAccounts and keep the number of threads that create #incorrectAccounts constant because only threads that create #incorrectAccounts cause an error condition. (#dataLockers, #classLockers) : We increase the #classLockers while keeping the #dataLockers constant; dataLockers check for the data inconsistency created by classLockers. (#producers, #consumers, #items) : We increase #consumers and keep #producers constant because the error condition, deadlocked consumer threads, is detected after the correctly running consumer threads complete execution. (#setters, #checkers) : We increase the #setters and keep #checkers constant; setter threads create the error while checker threads manifest the error. (#twoStagers, #readers) : We increase the #twoStagers and keep #readers constant; twoStager threads cause the error while reader threads manifest the error. (#seatRequests, #producers and #consumers, bufferSize) : Errors are pushed deeper in the transition graph when we increase the bufferSize and keep the number of threads, #producers and #consumers, constant. (#ticketsIssued, cushion) : The minimum depth of the error is pushed deeper in the execution trace when we increase the value of cushion and keep the total possible number of threads, #ticketsIssued, constant.
ling factors. Finally, we compute the observed R-DFS error density, number of states generated, and error depth statistics which are the dependent variables and measures in this study. Note that the benchmarks developed in this study are artificial and meant for in-lab testing and algorithmic development before deployment to real systems. A summary of what makes certain models of [6] hard using the controlling factors is presented in Table 3. In Table 4 we present evidence of the factors by making models hard using these factors. We present in Table 4 the observed RDFS error density, the minimum (Min), maximum (Max), and average (Average) number of states generated, and the minimum (Min), maximum (Max) and average (Average) depth of errors observed during the randomized DFS trials.
9 to 20 while fixing the number of threads that create errorcausing accounts at 1, the corresponding observed R-DFS error density value drops from 0.20 to 0.00 as shown in Table 4. In contrast, when we fix the number of threads that create error-free accounts at 8 while increasing the number of threads that create error-causing accounts from 1 to 8, the observed R-DFS error density value dramatically increases from 0.34 for parameters (8,1) seen in Table 1 to an observed R-DFS error density of 1.00 for parameters (8,8) as seen in Table 4. As described in Table 3, we manipulate the type of threads that manifest an error in the Wronglock, ProducerConsumer, Reorder, and TwoStage models to create hard models. The results on the observed RDFS error density are shown in Table 4.
4.1
4.2
Specific Thread type
The type and number of threads that actually manifest an error is a key factor in determining the hardness of the model. In the Accountsubtype model there are two kinds of threads where one type of thread creates error-free accounts and the other creates error-causing accounts. In this example, the amount of effort required to find an error in the model depends on the number of threads that create error-causing accounts. If there is a large number of errorcausing accounts, the total number of errors in the model increases and this causes a high observed R-DFS error density of the model. If we specifically decrease the number of threads that manifest an error in the model, we can design hard benchmarks for directed model checking. To test this hypothesis, in the Accountsubtype model we increase the number of threads that create error-free accounts from
Depth of Errors
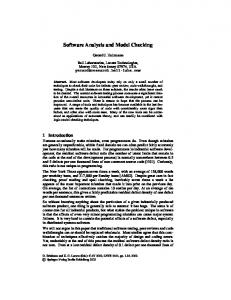
Another important factor that controls the hardness in models is the depth of errors in the transition graph. The hardness in the Piper and Airline models is controlled by varying the depth of the error for a specific thread configuration. The distribution of error depths for the Piper model with parameters (2,4,4) as observed during the error discovering runs from a total of 5000 randomized DFS trials is plotted in Figure 3. We ran 5000 trials to get a large enough pool of samples to study the distribution of the error depths for the model. The Piper model with parameters (2,4,4) has a moderately-deep distribution of errors as seen in Figure 3. The depth of errors in the Piper model can be controlled by increasing the size of the global buffer as described in Table 3. The increase in depth is because a larger buffer requires more execution steps in the
Table 4. Making models hard as measured by the observed R-DFS error density Subject Name(Thread Num) Accountsubtype(17) Accountsubtype(11) Accountsubtype(11 ) Accountsubtype(12) Accountsubtype(13) Accountsubtype(22) Wronglock(22) ProducerConsumer(10) ProducerConsumer(12) ProducerConsumer(14) ProducerConsumer(18) Reorder(7) Reorder(10) Reorder(11) Reorder(12) TwoStage(8) TwoStage(9) TwoStage(10) TwoStage(12) Piper(17) Piper(17) Piper(17) Airline(21) Airline(21) Airline(21) Airline(21) Airline(21) Airline(21)
Params 8,8 8,2 9,1 10,1 11,1 20,1 1,20 1,8,4 1,10,4 1,12,4 1,16,4 5,1 8,1 9,1 10,1 6,1 7,1 8,1 10,1 2,8,5 2,8,6 2,8,7 20,7 20,6 20,5 20,4 20,3 20,1
observed R-DFS error density 1.00 0.99 0.20 0.19 0.13 0.00 0.18 0.97 0.73 0.74 0.67 1.00 1.00 0.06 0.00 1.00 0.41 0.04 0.00 0.59 0.10 0.01 0.30 0.19 0.10 0.03 0.01 0.00
States Average 569 66798 115200 404441 5471 42 177838 120234 226531 42657 23412 2753141 6024276 1566880 5534023 6454082 3100522 2825817 7016824 881910 233024 497437 946680 2839090 -
Max 1526 6297122 1149916 5045723 37580 69 4651467 2099605 4352859 2741804 34573 4324228 6928518 3889834 9472266 8350644 8611433 7200552 7016824 8120367 2936562 2716582 2092517 2839090 -
Error Depth Statistics Min Average Max 540 558 575 281 305 319 275 282 293 302 311 321 331 339 347 25 41 68 90 107 128 99 117 135 110 128 153 127 147 173 33 38 47 46 55 66 57 61 63 53 60 69 63 68 73 75 76 76 143 150 164 141 147 159 144 144 144 109 118 123 117 120 122 113 120 122 118 121 123 120 120 120 -
transition graph to fill. The Piper model with parameters (2,8,5) and 17 threads has an observed R-DFS error density of 0.59 as shown in Table 4. If we fix the number of threads and increase the buffer size from 5 to 7, the corresponding observed R-DFS error density rapidly drops to 0.01. The minimum depth of the errors also dramatically increases as shown in Table 4. A strong dependence on the depth of errors in the Piper model allows us to create hard versions of the Piper model in terms of the observed RDFS error density. The Airline model is made hard in the same fashion as described in Table 3. By controlling the value of the cushion parameter the Airline models with 21 threads get progressively harder as shown in Table 4.
1200 1000 Number of Errors
Min 541 294 281 309 332 26 92 100 111 128 3411 460500 5228089 57080 330917 4412764 152 160 7016824 116 166 183 26404 2839090 -
800 600 400 200
5
0 60
65
70
75 80 Search Depth
85
Threats to Validity
90
Figure 3. Distribution of error depths for the Piper model with parameters 2,4,4
Path error density [6] and observed R-DFS error density, semantic based hardness measures, do not generalize across different tools. The computed values are dependent on the implementation of the tool and need to be computed on a per-tool basis. In fact, a simple comparison between two versions of JPF shows that the hardness measures also change in different versions of the same tool. There are even a few models where the hardness is reversed in the two versions of the tool; a model is hard in one version of the tool and easy in the other. This discrepancy indicates that the
models need to be characterized for a specific tool before being used to evaluate the directed model checking techniques in the tool. Differences in the implementations of partial order reduction, symmetry reduction, and state storage techniques across tools and tool versions might cause the variance in semantic measures of hardness. Despite the implementation differences, the observed R-DFS error density provides a tighter bound on the hardness of the model compared to path error density in a given tool.
6
Related Work
In recent years tremendous progress has been made in the field of software model checking [1, 14, 3, 15]. Java Pathfinder model checks the actual Java bytecode using a Java virtual machine [28]. Similar approaches use simulators and debuggers for other machine architectures [18, 19]. These approaches retain a high-fidelity model of the target execution platform while retaining a low-level control of scheduling decisions. There is a growing interest in developing tools and models for benchmarking different model checking approaches used to verify multi-threaded programs [8, 9, 10]. Recent work [6] makes a good first attempt in trying to evaluate the hardness of models used for benchmarking directed model checking by using random walk to estimate the number of paths in a model that contain an error. It is the first time random walk is used to evaluate the quality of directed model checking benchmarks. Other researchers have often used variants of random walk as an error discovery mechanism with limited success [12, 25, 17, 20]. Randomization techniques have been used in tandem with different model checking approaches by various researchers. Stoller uses randomized scheduling to find thread interactions that lead to an error in Java programs [26], while Jones and Mercer randomize a decentralized parallel guided search to disperse the search in different parts of the transition graph [16]. The work in [6] shows that the default search order used by an algorithm in a model significantly affects the results for error discovery in empirical analysis. The analysis in [6] demonstrates that by simply randomizing the default search order, the same algorithm may perform worse than other algorithms. The PRSS approach in [5] overcomes the limitations of the default search order by using a depth-first search that randomizes the order of successors.
rently, we do not have the syntactic metrics for this classification and characterization. As such, this paper defines the observed R-DFS error density as a semantic metric suitable for directed model checking empirical studies. The observed R-DFS error density is based on a rudimentary search technique and provides a lower bound on the number of errors in a model. Our analysis in this paper of the most comprehensive benchmark set of Java programs for explicit state directed model checking shows the set to be lacking in diversity and hardness. We study the few Java models that have a low observed R-DFS error density to understand the factors that contribute toward making them hard. Our analysis of the hard models seems to indicate that a model can be made hard by pushing errors deep in the transition graph and manipulating the thread count of specific threads reducing the number of errors. We use these factors to systematically lower the observed R-DFS error density of several easy models. In a follow-on work, [24], we test the effectiveness of heuristics in JPF, [11], on models defined as hard in this paper. The study in [24] shows that the most-blocked, interleaving and choose-free heuristics are not effective in error discovery on hard models. Note that we test the performance of these heuristics only on the class of subjects for which they are designed. The prefer-thread heuristic consumes more resources in terms of time and memory, as the models get harder, to find errors effectively in a certain class of subjects. The empirical evidence of [24] shows that the observed R-DFS error density measure of hardness provides a good starting point in defining the quality of the models for evaluating directed model checking techniques. In future work, we want to identify additional factors that affect the observed R-DFS error density of a model and tie those factors to syntactic constructs in the model. Some interesting factors to study are the depths of the transition graph where the randomized DFS spends a large portion of its search time and the structure of the transition graph derived from the branching factor.
8
Acknowledgments
We thank Matt Dwyer and Suzette Person at the University of Nebraska and Shmuel Ur at the IBM Research Center in Haifa. We also thank Ira and Mary Lou Fulton for their generous donations to the BYU Supercomputing laboratory.
References 7
Conclusions and Future Work
Characterized and classified experimental benchmarks for directed model checking are critical to understand the performance in explicit state directed model checking. Cur-
[1] T. Ball and S. Rajamani. The SLAM toolkit. In G. Berry, H. Comon, and A. Finkel, editors, 13th Annual Conference on Computer Aided Verification (CAV 2001), volume 2102 of Lecture Notes in Computer Science, pages 260–264, Paris, France, July 2001. Springer-Verlag.
ˇ a, P. Moravec, P. Roˇckai, and [2] J. Barnat, L. Brim, I. Cern´ ˇ P. Simeˇcek. DiVinE – A Tool for Distributed Verification (Tool Paper). In Computer Aided Verification, volume 4144/2006 of LNCS, pages 278–281. Springer Berlin / Heidelberg, 2006. [3] E. Clarke, D. Kroening, and F. Lerda. A tool for checking ANSI-C programs. In K. Jensen and A. Podelski, editors, Tools and Algorithms for the Construction and Analysis of Systems (TACAS 2004), volume 2988 of Lecture Notes in Computer Science, pages 168–176, Barcelona, Spain, April 2004. Springer. [4] D. L. Dill. The Murφ verification system. In CAV ’96: Proceedings of the 8th International Conference on Computer Aided Verification, pages 390–393, London, UK, 1996. Springer-Verlag. [5] M. B. Dwyer, S. Elbaum, S. Person, and R. Purandare. Parallel randomized state-space search. In ICSE ’07: Proceedings of the 29th International Conference on Software Engineering, pages 3–12, Washington, DC, USA, 2007. IEEE Computer Society. [6] M. B. Dwyer, S. Person, and S. Elbaum. Controlling factors in evaluating path-sensitive error detection techniques. In SIGSOFT ’06/FSE-14: Proceedings of the 14th ACM SIGSOFT international symposium on Foundations of software engineering, pages 92–104, New York, NY, USA, 2006. ACM Press. [7] S. Edelkamp, A. L. Lafuente, and S. Leue. Directed explicit model checking with HSF-SPIN. In Proceedings of the 7th International SPIN Workshop, number 2057 in Lecture Notes in Computer Science. Springer-Verlag, 2001. [8] Y. Eytani, K. Havelund, S. D. Stoller, and S. Ur. Towards a framework and a benchmark for testing tools for multi-threaded programs: Research articles. Concurrency and Computation: Practice & Experience, 19(3):267–279, 2007. [9] Y. Eytani and S. Ur. Compiling a benchmark of documented multi-threaded bugs. In Proceedings of the Workshop on Parallel and Distributed Systems: Testing and Debugging, page 266a, Los Alamitos, CA, USA, 2004. IEEE Computer Society. [10] E. Farchi, Y. Nir, and S. Ur. Concurrent bug patterns and how to test them. In IPDPS ’03: Proceedings of the 17th International Symposium on Parallel and Distributed Processing, page 286.2, Washington, DC, USA, 2003. IEEE Computer Society. [11] A. Groce and W. Visser. Model checking Java programs using structural heuristics. In International Symposium on Software Testing and Analysis, pages 12–21, July 2002. [12] P. Haslum. Model checking by random walk. In Proceedings of ECSEL Workshop, 1999. [13] K. Havelund and T. Pressburger. Model checking Java programs using Java PathFinder, 1998. [14] T. A. Henzinger, R. Jhala, R. Majumdar, and G. Sutre. Software verification with Blast. In T. Ball and S. Rajamani, editors, Proceedings of the 10th International Workshop on Model Checking of Software (SPIN), volume 2648 of Lecture Notes in Computer Science, pages 235–239, Portland, OR, May 2003.
[15] G. J. Holzmann. The model checker SPIN. IEEE Transactions on Software Engineering, 23(5):279–295, 1997. [16] M. D. Jones and E. Mercer. Explicit state model checking with Hopper. In International SPIN Workshop on Software Model Checking (SPIN’04), number 2989 in LNCS, pages 146–150, Barcelona, Spain, March 2004. Springer. [17] M. D. Jones and J. Sorber. Parallel search for LTL violations. Software Tools for Technology Transfer, 7(1):31–42, 2005. [18] P. Leven, T. Mehler, and S. Edelkamp. Directed error detection in C++ with the assembly-level model checker StEAM. In Proceedings of 11th International SPIN Workshop, Barcelona, Spain, volume 2989 of Lecture Notes in Computer Science, pages 39–56. Springer, 2004. [19] E. G. Mercer and M. Jones. Model checking machine code with the GNU debugger. In 12th International SPIN Workshop, volume 3639 of Lecture Notes in Computer Science, pages 251–265, San Francisco, USA, August 2005. Springer. [20] R. Pelanek, T. Hanzl, I. Cerna, and L. Brim. Enhancing random walk state space exploration. In FMICS ’05: Proceedings of the 10th International Workshop on Formal methods for industrial critical systems, pages 98–105, New York, NY, USA, 2005. ACM Press. [21] Robby, M. B. Dwyer, and J. Hatcliff. Bogor: An extensible and highly-modular model checking framework. ACM SIGSOFT Software Engineering Notes, 28(5):267–276, September 2003. [22] N. Rungta and E. G. Mercer. A context-sensitive structural heuristic for guided search model checking. In 20th IEEE/ACM International Conference on Automated Software Engineering, pages 410–413, Long Beach, California, USA, November 2005. [23] N. Rungta and E. G. Mercer. An improved distance heuristic function for directed software model checking. In FMCAD ’06: Proceedings of the Formal Methods in Computer Aided Design, pages 60–67, Washington, DC, USA, 2006. IEEE Computer Society. [24] N. Rungta and E. G. Mercer. Generating counter-examples through randomized guided search. In Proceedings of the 14th International SPIN Workshop on Model Checking of Software, pages 39–57, Berlin, Germany, July 2007. Springer–Verlag. [25] H. Sivaraj and G. Gopalakrishnan. Random walk based heuristic algorithms for distributed memory model checking. In Proceedings of Workshop on Parallel and Distributed Model Checking, 2003. [26] S. D. Stoller. Testing concurrent Java programs using randomized scheduling. In Proc. Second Workshop on Runtime Verification (RV), volume 70(4) of Electronic Notes in Theoretical Computer Science. Elsevier, July 2002. [27] J. Tan, G. S. Avrunin, L. A. Clarke, S. Zilberstein, and S. Leue. Heuristic-guided counterexample search in flavers. In SIGSOFT ’04/FSE-12: Proceedings of the 12th ACM SIGSOFT twelfth International symposium on Foundations of software engineering, pages 201–210, New York, NY, USA, 2004. ACM Press. [28] W. Visser, K. Havelund, G. P. Brat, S. Park, and F. Lerda. Model checking programs. Automated Software Engineering, 10(2):203–232, 2003.