Steffen SCHOSTAN, Klaus-Dieter DETTMANN, Ilir PURELLKU, Detlef SCHULZ Helmut-Schmidt-University, University of the Federal Armed Forces Hamburg, Germany
Harmonics and powers of doubly fed induction generators at balanced sinusoidal voltages Abstract. Measurements at a test-bench of a wind energy converter performed with an ideal balanced and sinusoidal voltage source instead of a grid are necessary for the identification of the harmonics or subharmonics caused by the generator and converter. The produced significant frequencies as well as their interaction with the voltage source are analyzed. The stator side collective power components are calculated and their effect on the time variable asymmetry of the stator current of the three-phase system is investigated. Streszczenie. Identyfikacja harmonicznych i subharmonicznych wprowadzanych przez generatory i przekształtniki energii wiatrowej wymaga pomiarów laboratoryjnych w warunkach zasilania napięciem sinusoidalnym i symetrycznym. W artykule analizowane są wytwarzane w takich układach znaczące składowe częstotliwościowe a także ich oddziaływanie na źródło zasilania. Obliczane są także składowe mocy po stronie stojana oraz badany jest ich wpływ na czasową zmienność asymetrii prądu stojana. (Harmoniczne i moce dwustronnie zasilanych generatorów indukcyjnych przy sinusoidalnych i symetrycznych napięciach zasilających).
Keywords: asymmetries, balanced sinusoidal voltage, DFIG, harmonics, wind turbine, power components Słowa kluczowe: asymetrie, symetryczne napięcie sinusoidalne, DFIG, harmoniczne, turbina wiatrowa, składowe mocy.
Introduction Wind energy converters must comply with standards like those described in EN 50160 [1] or IEC 61000 [2]. Especially harmonics can distort the grid and must not exceed the given limits. In practice harmonics or subharmonics caused by the wind turbine are difficult to measure, because the grid itself is also distorted. Better conditions exist with a test-bench. Instead of a distorted power grid it can be operated with an ideal voltage source, which has nearly no internal impedance and gives a pure sinusoidal balanced voltage. In this way, all harmonics in the measurement arise from the doubly fed induction generator with its converters. Their propagation from rotor to stator is described in [3], which is the basis for the following explanations. The sources of the measured harmonics are also investigated. Furthermore, the influences of harmonics and subharmonics on the power output are analysed. I.
Description of the Test-Bench Measurements are taken with a test-bench that is shown in Fig. 1. It consists of a doubly fed induction generator (DFIG) with a back-to-back voltage source converter in the rotor circuit, a DC-machine as a model of the wind torque and an ideal voltage source instead of a grid. The 23 kW DC-machine is separately excited. It creates the needed torque and angular velocity, which are regulated by a 4-quadrant converter. For each wind speed an optimal angular velocity with maximum mechanical power is chosen. With the controller of the DC-machine the rotation speed can be varied from the nominal value of 1500 rpm to a range of 1200-1800 rpm.
A 5 kW slip-ring induction machine with two pole pairs is used as a generator. Its stator coils are star-connected with star point not grounded; the coils of the rotor are deltaconnected. The rotor is fed by a back-to-back-converter and a transformer, see Fig. 1. The filter in the rotor circuit minimizes distortion caused by the pulses of the converter. For the measurements described in this paper the machine is operated in super-synchronous mode with a rotation speed of 1650 rpm, i.e. with a slip of 0.1 and controller set values of a collective active power of -3 kW and a symmetric 50 Hz reactive power of 0.4 kvar. Fig. 1 shows that the grid is substituted in the test-bench by an ideal voltage source Videal and an impedance ZGrid . The voltage is generated by a 4-quadrant-amplifier. It includes two oscillators, which can generate three separate phase-to-ground voltages with a maximum signal frequency of 5 kHz. The voltage harmonics of each phase and the asymmetry of the three phase system can also be set. For the described analysis a symmetrical and pure sinusoidal three-phase voltage system is used. It has a phase-toground voltage with an RMS-value of 230 volts and a frequency of 50 Hz, which is identical to the fundamental frequency of the grid. The three phase grid impedance ZGrid for this frequency is chosen to (0.24+j0.15) Ω in conformity with the specifications of EN 61000-3 [4]. There are four points in the test-bench, where the measurements are performed. Point A gives the voltages and currents of the stator, where the voltages are measured against its star point. At point B the rotor currents are recorded. In the measurements on the rotor side (point B) only lower harmonics up to some hundred Hz are taken into account. Higher harmonics, caused by the pulses of the converters, are neglected for this discussion. They are described e.g. in [5] and [6]. Values of powers fed into the grid from the rotor circuit are taken at point C; the voltages of the ideal source are measured at point D. At the investigated operation point of 1650 rpm the electrical fundamental frequency fr,1 in the rotor can be calculated by (1)
Fig.1. Test-bench with ideal voltage source for measurements of voltages and currents at points A, B, C and measurements of voltages at point D
f r,1 f s,1 p
n 1650 rpm 50 Hz 2 5 Hz 60 60
with generator speed n, pole pairs p, stator fundamental frequency fs,1 (50 Hz). This equation outlines that rotor frequencies can become very low. For this reason current transformers for a specified frequency range of 0-8000 Hz
PRZEGLĄD ELEKTROTECHNICZNY (Electrical Review), ISSN 0033-2097, R. 87 NR 1/2011
51
are used. Their measuring accuracy is 2 % of the upper limit of the effective range. The sampling rate of the measurements is 10 kHz, i.e. much higher than the considered harmonic frequencies. L1
Table 1. Relative collective voltage and current harmonics in supersynchronous mode Harmonic U A (10 Hz)
L3
L2
*
U
vA [V]
400
*
U
0 -400 0
0.04
0.08
0.12
0.16
0.2
time [sec]
iA [A]
10
0.08
0.12
0.16
0.2
IA,RMS [A]
time [sec] 5 4.5 4 3.5 0.02
0.03 %
0.45 %
A
(20 Hz)
7.29 %
I*A (80 Hz)
3.58 %
I*A (110 Hz)
0.37 %
A
(150 Hz)
1.44 %
*
0.06
0.10
0.14
0.18
0.22
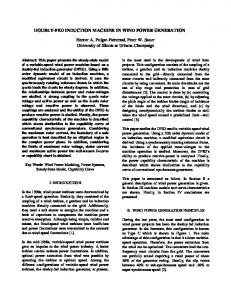
The negative sign in (1) indicates that the fundamental frequency in the rotor has a negative sequence. Therefore, its field in the air gap rotates opposite with the field of the fundamental stator current and the mechanical speed. The frequency itself, of course, is always positive. II. Measurement results The measurements are performed in super-synchronous mode with a speed of 1650 rpm. At the stator of the generator (point A at Fig. 1) the voltages and currents are recorded with the same sampling rate of 10 kHz. These values are necessary for the calculation of harmonics and power components. In the same manner the voltages and currents as well as the powers in point B and C are determined. To verify the balanced pure sinusoidal 50 Hz ideal voltage source, the three phase-to-ground voltages are measured at point D. Their harmonics are calculated. In all four points the measurements were synchronized. With the help of input filters with a cut-off frequency of 5 kHz aliasing effects were avoided. A) Harmonics in voltages and currents First, the voltages and currents at points A and B are discussed; see Fig. 2 and Fig. 3. The calculated harmonics in these voltages and currents are shown in Table 1. L1
L2
L3
15 10
iB [A]
(80 Hz)
(10 Hz)
I
Fig.2. Stator voltages and currents at measurement point A (time curves of measurements and of RMS-values)
0
0
A
A
*
time [sec]
-10 -15
0.08 %
5.36 %
I
0.04
(20 Hz)
U*A (150 Hz)
*
-10
A
0.02 %
I
0
0.02 %
U*A (110 Hz)
*
0
Uh∑*, Ih∑*
*
0.2
0.4 time [sec]
0.6
0.8
I B (25 Hz)
0.87 %
I*B (35 Hz)
3.37 %
I*B (55 Hz)
0.92 %
*
0.50 %
*
0.16 %
I B (65 Hz) I B (95 Hz)
The harmonics of ordinal number h are calculated as collective root-mean square-value Ih∑ of the corresponding frequency in the three phases: (2)
3
2 I h Σ I h, l . l 1
The resulting values are normalized with the collective root-mean square-value I1∑ of the three-phase fundamental current: (3)
I h* Σ
IhΣ I1
100% ,
where I1Σ,A, I1Σ,B equal 7.52 A and 12.56 A respectively. The same procedure is applied for the star-voltages, in which case the collektive voltage U1Σ,A has a value of 402.5 V. The root-mean-square-values are averaged over ten times the fundamental period. The stator voltage contains essentially a third harmonic with 150 Hz, while in the current the frequencies of 20 Hz, 80 Hz and 150 Hz are significant. In the rotor the seventh harmonic with 35 Hz is strong; further significance have the fifth, eleventh and thirteenth harmonic with 25 Hz, 55 Hz and 65 Hz. These harmonics must originate from the generator and its converters during active power feeding in the super-synchronous operating mode, because the threephase ideal voltage source is pure sinusoidal 50 Hz and symmetric. Fig. 4 shows the measured voltages at the ideal voltage source (point D). All magnitudes of the considered harmonic and sub harmonic frequencies are less than 0.1 % of the amplitude of the fundamental frequency. This verifies that all measured harmonics at points A, B and C originate only from the DFIG and its converters.
Fig.3. Rotor currents at measurement point B
52
PRZEGLĄD ELEKTROTECHNICZNY (Electrical Review), ISSN 0033-2097, R. 87 NR 1/2011
L1
L3
L2
200 0 -200 -400
0
0.05
0.1 time [sec]
0.15
0.2
videal [p.u.]
1 0.001
0
100
200 300 frequency [Hz]
400
500
0 -4 -8
Seeking the reason for the additional frequencies at measurement points A and B, let’s at first have a look at the rotor circuit. The rotor side converter works as a 6-pulse double bridge rectifier. This device causes current harmonics with ordinal numbers of k:
8
k 1 6 g
with
0
0.04
0.08
0.12
0.16
0.2
iA L1 [A]
time [sec] iA L1 (50Hz+20Hz)
iA L1
4 0 -4 -8
g 0, 1, 2,
Hence, significant values of k are –5, +7, –11 and +13. Because the fundamental rotor frequency is a negative sequence of 5 Hz, the corresponding rotor harmonics are +25 Hz, –35 Hz, +55 Hz and –65 Hz. According to the explanations in [3], these harmonics correspond to stator current frequencies of 80 Hz, 20 Hz, 110 Hz and 10 Hz. Thus the strongest harmonics of 20 Hz and 80 Hz in the stator current (7.29 % and 3.58 %) arise from the seventh and fifth harmonic in the rotor current, caused by the rotorside converter. These stator current harmonics occur also in the voltage of the stator, although the voltage source is pure sinusoidal. The reason is that the current creates a voltage drop at the grid impedance ZGrid , which is proportional to the current. In that way, the harmonics of the currents couple to the voltages of the stator. Still not discussed is the third harmonic with 150 Hz in the stator voltage. It is a consequence of the nonlinear magnetisation characteristic of the iron core. For the magnetisation a third harmonic is needed. If the star point is connected to the source star point, this frequency develops in the current and usually is a zero sequence. Such a zero sequence cannot exist in the stator current, because its star point is not connected. But if you excite an iron core e.g. with a sinusoidal current, the third harmonic will occur in the voltage, however inverse to the third current harmonic. As the measurments show, this 150-Hz-component is a pure zero sequence. Nevertheless, the stator currents contain also a 150-Hzharmonic. This component is composed of a positive and a negative sequence. According to [3] and [7] the positive sequence corresponds to a rotor frequency of 95 Hz, which has a value of 0.16 %. The negative sequence creates a rotor harmonic of 205 Hz that exceeds the range of Table 1.
iA L1 20Hz
4
Fig.4. Measured values of the three-phase ideal voltage source at point D during active power feeding in super-synchronous mode (time curves and the corresponding harmonics)
(4)
iA L1 50Hz
iA L1
8
iA L1 [A]
videal [V]
400
B) Asymmetries in stator currents Besides harmonics, Fig. 2 reveals another effect. The stator currents have a significant asymmetry. Furthermore, this asymmetry is not static, but changing with time. In Fig. 2 the alternating averaging rms-values of the phase currents at point A verify this statement. The described effect cannot be caused by the construction of the machine. Tests showed that the machine itself has only neglectable asymmetries. Furthermore, if the machine construction was the cause, the asymmetries would be static. The reason for this effect is the strong 20-Hz-frequency in the stator currents. This low frequency varies the currents with a shape, which repeats every 100 ms, because 20 Hz is no divisor of 50 Hz.
0
0.04
0.08
0.12
0.16
0.2
time [sec] Fig.5. Time curves of the stator current L1 at measurement point A, consisting of the 50 Hz and 20 Hz components exclusively
This effect differs in the three phases; therefore the current amplitudes are also different, seeming to be an asymmetry. This asymmetry varies about 100 ms. So the currents can show asymmetric amplitudes, although everything is symmetrical in itself. In Fig. 5 the time curves of the stator currents demonstrate this effect of the 20 Hz component considered, exemplarily at phase L1. For reference the fundamental component is also illustrated. The calculation of harmonics in time domain is described in [3]. The sum of the 20 Hz and 50 Hz components characterise substantially the time curve of the respective stator phase current. The fluctuating currents are difficult to control and are a challenge for the controller concept. Moreover, these fluctuations have also an impact on the power components of the generator. C) Influences of Stator Harmonics on Powers The power output is calculated by the measured voltages and currents at the stator (point A) and at the converter-transformer (point C), where the rotor power is fed in. At first, the instantaneous collective power Pcoll,inst(t) of the three phases is determined by using the equation (5)
3
3
l 1
l 1
Pcoll,inst (t ) Pl ,inst (t ) vl (t ) il (t ) ,
where Pl ,inst(t) is the instantaneous power of phase l, which can be written as a product of the respective values of the phase-to-neutral voltage vl (t) and the phase current il (t). The instantaneous collective powers PA,coll,inst(t) and PC,coll,inst(t) of all three phases at these two points as well as the sum P∑,coll,inst(t) of both are shown in Fig. 6.
PRZEGLĄD ELEKTROTECHNICZNY (Electrical Review), ISSN 0033-2097, R. 87 NR 1/2011
53
The time curves of these collective power components are shown in Fig. 7. SA,coll,T1 is composed of the single values from SA,coll for every respective fundamental term T1 within the total time interval. The apparent power curve SA,coll,T1 is not constant over the entire time interval, it oscillates around the constant apparent power SA,coll,tot = 3.034 kVA, which is taken over 0.2 sec. This effect is caused by the non-static collective active power PA,coll and the time variation of the collective non-active power component QA,coll.
-3 0
0.04
0.08 0.12 time [sec]
0.16
0.2
0
0.04
0.08 0.12 time [sec]
0.16
0.2
0
SA,coll,T1
SA,coll,inst [kVA]
-0.2
-4 -3 -2
0
0.04
0.08
0.12
0.16
0.2
time [sec] Fig.6. Time curves of instantaneous collective measurement points A, C and the sum of both
power
at
The collective power curves contain additional frequencies. Particularly, the power curves have a characteristic that repeats also every 100 ms. This fact shows that even the power curves are strongly influenced by the 20-Hz-component of the stator current and voltage. The components of the stator power at measurement point A, which is dominant in the used operation point, are further investigated. III. Collective power components of the stator For the calculation of the collective power components DIN EN 40110-2 is applied [8]. Three components of collective power are investigated: the apparent power SA,coll of the three-phase system, the collective active power PA,coll and the collective non-active component QA,coll. At first, the apparent power SA,coll of the stator is calculated:
S
(6)
A, coll
U A, coll I A, coll
In (6) the collective rms-values of voltage UA,coll and current IA,coll of the three-phase system are given by: (7)
3
U 2A,l
U A,coll
I A, coll
l 1
3
I 2A,l
l 1
In this context, UA, l and IA, l are the phase RMS-values. In our investigation these rms-values are calculated over two different time periods T: the fundamental term T1 = 0.02 sec and the total interval of ten times T1 (tot), which is equal to 0.2 sec and represents the entire considered time interval. Next the stator side collective active power PA,coll is determined by using the following equation: (8)
PA,coll
1T Pl (t ) vl (t ) il (t ) dt l 1 l 1 T 0 3
3
PA,coll represents the balanced active power of a threephase system over a considered time interval T. At last the collective non-active power QA,coll is investigated, which is given by: (9)
54
SA,coll,tot
3.2 3 2.8
0
0.04
0.08
0.12
0.16
0.2
time [sec]
Q
A, coll
S2
A,coll
-P2
A,coll
|P|A,coll,inst [kW]
-2
|PA,coll,T1|
|PA,coll,tot|
3.2 3 2.8
0
0.04
0.08
0.12
time [sec]
QA,coll,inst [kvar]
PA,coll,inst [kVA] PC,coll,inst [kVA]
0.2
PS,coll,inst [kVA]
-4
0.16
QA,coll,T1
0.2
QA,coll,tot
0.5 0.4 0.3
0
0.04
0.08
0.12
0.16
0.2
time [sec]
Fig.7. Collective power components at measurement point A with respect to time
For a better comparison, in Fig. 7 the absolute values of both time curves PA,coll,T1 and PA,coll,tot of the collective active power component are shown. The active power curve of the composed single values of |PA,coll,T1| varies strongly within a power range of 2.83 kW and 3.16 kW. The second curve |PA,coll,tot| with a constant value of 3.006 kW is approximately equal to the absolute set value of (| 3 kW|) for the controller of the collective active power. In a further step, the collective non-active power curves at stator side are investigated. The curve of the collective non-active power QA,coll,T1 varies, too. There is an oscillation within the range of 0.32 kvar to 0.46 kvar, while the controller has a set value of 0.4 kvar for the symmetric 50 Hz reactive power. This fact shows that the fluctuations, caused by the 20 Hz frequency of the stator current, are significantly higher in the collective active power than in the collective non-active power. Next the collective non-active power QA,coll,T1 is split up into a proportional component QA,coll,T1||u and an orthogonal component QA,coll,T1┴. The proportional component is calculated in each of the three phases with that part of the non-active current, which is proportional to the respective phase voltage. From the RMS-values of these currents IT1,µ||u the collective proportional current Icoll,T1||u results: (10)
I
coll,T1||u
3
I T21,||u
1
Multiplied by UA,coll we get the collective proportional component QA,coll,T1||u of the non-active power, which describes the unbalance of the stator currents [8]. This part is sometimes referred to as variation power, because it varies the time curves of the active powers in the three phases without changing the mean value of their sum. Nevertheless, in each phase the mean values of these
PRZEGLĄD ELEKTROTECHNICZNY (Electrical Review), ISSN 0033-2097, R. 87 NR 1/2011
QA,coll,T1 [kvar]
components can be less or greater than zero within every interval T1. The remaining part of the non-active current is the orthogonal component QA,coll,T1┴ . It consists of reactive power and distortion components. The time curves of the collective non-active power QA,coll,T1 and its components are shown in Fig. 8. These values are calculated over the fundamental period of 0.02 sec. Both the collective orthogonal part and the proportional component of the nonactive power vary over the total time interval. The fluctuations of QA,coll,T1┴ are stronger than those of QA,coll,T1||u . This effect is caused by the 20 Hz stator current, which shapes the non-static asymmetry. 0.45 0.35 0
0.04
0.08
0.12
0.16
QA,coll,T1 ^ [kvar]
REFERENCES
0.2
[1]
time [sec]
[2] [3]
0.45 0.35 0
0.04
0.08
0.12
0.16
0.2
time [sec]
QA,coll,T1 || u [kvar]
At the stator side a non static asymmetry at the currents can be observed. The analysis of the stator current harmonics shows a dominant 20-Hz-component, which originates from the propagation of the seventh current harmonics from the rotor side. Furthermore it is observed that the 20-Hz-components of the stator currents and voltages have also an impact on the collective power curves. The power components, which are calculated over the fundamental period, are not constant over the entire time interval. This effect, though, is much higher at the collective active power than at the collective non-active power. The described effects have been measured on a testbench with a 5-kW-generator. They are also valid for highpower wind turbines, because the used theory of harmonics propagation from rotor to stator does not depend on the rated power of the machine.
[4] [5]
0.1 0.05 0
0
0.04
0.08
0.12
0.16
0.2
[6]
time [sec] Fig.8. Collective non-active power component splitted up into an orthogonal and proportional part at measurement point A with respect to time
IV. Conclusion This paper evaluates measurements on a test-bench with a doubly fed induction generator connected to an ideal balanced voltages source. The focus of the investigation lies on the determination of the harmonics, which originate mainly from the power electronics components of the doubly fed induction generator. Furthermore the propagation of these harmonics from rotor to stator and their effect on the powers is analysed. The measured data were recorded during a supersynchronous operating point exclusively.
[7]
[8]
EN 50160, “Voltage characteristics of electricity supplied by public distribution systems”, 2005 IEC 61000, “Electromagnetic compatibility (EMC)”, 1996 S. Schostan, K.-D. Dettmann, T. Do Thanh, D. Schulz, “Harmonic Propagation in a Doubly Fed Induction Generator of a Wind Energy Converter”, IEEE Conference on Compatibility and Power Electronics (CPE 2009), Badajoz (Spain), May 2009, ISBN 978-1-4244-2856-4 (CD), pp. 101-108 EN 61000-3, “Electromagnetic compatibility (EMC)”, 1996 M. Lindholm, T. W. Rasmussen, “Harmonic analysis of Doubly Fed Induction Generators”, The Fifth International Conference on Power Electronics and Drive Systems, 2003. (PEDS 2003), vol.2, pp. 837-841. D. Schulz, E. Tognon, R. Hanitsch, „Investigation of the Harmonic Transformation Properties of Double Fed Induction Generators in Wind Energy Converters”, Power electronics conference (PCIM), Nürnberg, Germany, May 2003 K.-D. Dettmann, S. Schostan, D. Schulz “Wind Turbine Harmonics caused by Unbalanced Grid Currents”, 2007 Compatibility in Power Electronics (CPE 2007), 29 May – 1 June 2007, Gdynia, Poland. DIN EN 40110-2, “Quantities used in alternating current theory (in German: Wechselgrößen)”, part 2, “Multi-conductor circuits (in German: Mehrleiter-Stromkreise)”, 2002
Authors: Steffen Schostan, E-mail:
[email protected]; Dr.-Ing. Klaus-Dieter Dettmann, E-mail:
[email protected]; Ilir Purellku, E-mail:
[email protected]; Prof. Dr.-Ing. habil Detlef Schulz, E-mail:
[email protected]; Electrical Power Systems, Helmut-Schmidt-University, University of the Federal Armed Forces Hamburg, Holstenhofweg 85, D-22043 Hamburg
PRZEGLĄD ELEKTROTECHNICZNY (Electrical Review), ISSN 0033-2097, R. 87 NR 1/2011
55