International Journal of Future Generation Communication and Networking Vol. 3, No. 3, September 2010
HATS: High Accuracy Timestamping System Based on NetFPGA Zhiqiang Zhou 1, Lin Cong 1, Guohan Lu 2, Beixing Deng 1, Xing Li 1 1
Department of EE Tsinghua University, Beijing, China 2 Microsoft Research Asia, Beijing, China
[email protected]
Abstract. The delay and dispersion of the packet train have been widely used in most network measurement tools. The timestamp of the packet is critical for the measurement accuracy. However, timestamping performed either in the application or the kernel layer would be easily affected by the source and destination hosts especially in high-speed network. Therefore, to evaluate the impact of the timestamp precision on the measurement, a high accuracy timestamping hardware system (HATS) based on NetFPGA was designed and implemented. With HATS, the deviation of timestamp accuracy among the application, the kernel and the hardware layers was analyzed. Keywords: network measurement; timestamp accuracy
1
Introduction
Nowadays, as the high-speed development of network, the measurement of network state is important for various network applications. The algorithms and tools of network measurement can be used for the design of transport protocols, selection of the optimal path, evaluation of the Quality of Service (QoS), traffic monitoring to detect the bottleneck bandwidth, etc. There are two methods to measure the network, passive measurement and active measurement. Algorithms for actively measuring network state have been studied for many years. In active measurements, the source host injects a train of timestamped probe packets into the traffic, then the destination host receives and timestamps the probe packets. Active algorithms estimate the network state by the delay or dispersion of the probe packets. In the circumstances, the timestamp precision is essential for the measurement accuracy. To accurately measure the network state, the timestamp record the time when probe packets get out of source NIC into the Ethernet or out of the Ethernet into destination NIC. Almost all measurement tools timestamp probe packets in either the application or the kernel layer, therefore the state measured can be easily affected by the source and destination hosts. The timestamp accuracy is critical for network state measurement. However, up to now, few researches have focused on the effects of timestamp accuracy on the network state measurement. Little attention has been paid to the importance of timestamp accuracy. HATS is built to timestamp the probe packets in hardware with high time resolution. It can eliminate the effect caused by host architecture. With HATS, we can measure and estimate the network behavior accurately. It is also possible to evaluate the effect of the host behavior on timestamp precision. HATS is based on NetFPGA, which is an open Linux platform with high-speed network hardware. The outline for this paper is as follows. Part 2 introduces the NetFPGA platform. This is followed by part 3 and 4 where we discuss the design and implementation of HATS. In part 5 we describe the design of experiments evaluating the timestamp accuracy. The analysis of the timestamp accuracy among the application, the kernel and the hardware layer is performed in part 6. Related work about the timestamp precision is presented in part 7. At last we conclude in part 8.
1
International Journal of Future Generation Communication and Networking Vol. 3, No. 3, September 2010
2
Platform Architecture
NetFPGA is an open network platform for high-speed network research and design. It has a core clock running at 125MHz, with a timer resolution of 8ns. There are NetFPGA packages (NFPS) with source code implementing various network functions on the Internet [1]. NFPS include three parts, the kernel module, the software used to communicate with the hardware and the reference hardware designs. Four reference designs are available, reference router, reference NIC, reference switch and reference hardware accelerated Linux router. In the reference designs, the hardware is divided into modules. That is helpful for users to modify the reference design. The registers module is independent of the pipeline modules. That is specially designed to simplify the process of adding a module to the design as it doesn't require modifying the central pipeline. With the reference designs and NFPS, one can verify his thought, extend his own design based on the reference design or implement a completely new design without care of the reference design.
3
System Design
Based on the NetFPGA, the system ought to be attached to a desktop PC or server via the PCI and run as a Gbps NIC. It can accurately timestamp each packet passing through without consideration of the packet size, packet rate and the interval with the adjacent packets. Simultaneously, the timestamp module can affect neither receiving nor sending of the probe packets. The design of the system is described as follows. 3.1
Reference NIC
To achieve accurate timestamp for each probe packet, we should timestamp the packet with the NetFPGA core clock. HATS can be designed and implemented based Ethernet Interface (Rcv)
MAC RxQ
Ethernet Interface (Rcv)
CPU RxQ
CPU TxQ
MAC RxQ
MAC TxQ
Ethernet Interface (Rcv)
MAC RxQ
PCI HOST (Snd)
MAC TxQ
Output Queue
MAC RxQ
Ethernet Interface (Rcv)
Output Port Lookup
Input Arbiter
MAC RxQ
User Data Path
CPU TxQ MAC TxQ
MAC TxQ
MAC RxQ
CPU TxQ
SRAM Interface
Ethernet Interface (Snd) Ethernet Interface (Snd)
CPU TxQ
MAC RxQ
Registers IO
Ethernet Interface (Snd)
DRAM Interface
Ethernet Interface (Snd) PCI HOST (Rcv)
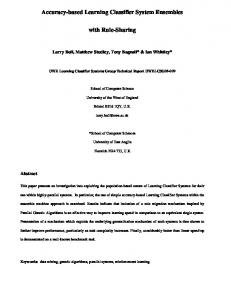
Figure. 1. Reference NIC on the reference NIC. The block diagram of the reference NIC is shown in Figure. 1. The pipeline includes 8 transmit queues, 8 receive queues and a user data path comprised of input arbiter, output port lookup and output queues modules. The packet from Ethernet ports (receiving) or the PCI over DMA (sending) arrives at receive queues first. The input arbiter in the user data path decides which receive queue to service next. The packet is pulled from the receive queue and transmitted to the output port lookup module (OPL). OPL decides
2
International Journal of Future Generation Communication and Networking Vol. 3, No. 3, September 2010
which port the packet should go out of and submits it to the corresponding output queue. The transmit queues are responsible for sending the packets to the driver via PCI (receiving) or Ethernet ports (sending). In the registers module, each module has a group of registers which show its state. These registers can be easily read and written in certain functions via PCI. 3.2
Time Stamp
3.2.1 Format To timestamp packets in the hardware layer with the NetFPGA core clock, we can use the stamp counter module in NFPS. As the probe packets may get lost or out of order, to identify which packet the timestamp corresponds to, it is not enough to record the sending or receiving time only. Therefore a 16-bit identifier which can identify the packet uniquely is defined. The identifier can be different for varied protocols. It is the 16-bit urgent pointer for TCP, the 16-bit identification for IPV4, the low 16 bits of the flow label for IPV6 and etc. Both the identifier and the time are recorded in the timestamp. 3.2.2 Storage Up to now, the timestamp is usually processed in two ways, either stored in the NIC
Figure. 2. Synchronization Mechanism registers, or inserted into the packet data. In the former case, the register read is performed after each packet having been received and transmitted. That can be implemented by polling in the software. Otherwise the registers would be flushed by the following packet and the timestamp could be lost. That might be all right in low-speed network, but in high-speed network there will be PCI access conflict. Reading registers via PCI will influence the receiving and sending of the packet which needs to be transferred between the kernel and NetFPGA via PCI bus. Considering the latter case, there are limitations in two folds. First, writing the timestamp to the packet data may increase the packet processing time. Second, what’s more, we can only put the receiving timestamp into the receiving packet. But for transmitting packets, the timestamp comes forth after the packets leaving the hardware. It's impossible to insert the timestamp into the transmitting packet. Inserting the timestamp into the
3
International Journal of Future Generation Communication and Networking Vol. 3, No. 3, September 2010
following packet will also increase the packet processing time. By comprehensive consideration, we use the RAM in the NetFPGA to store the probe packet timestamp in our design. 3.3
Synchronization Mechanism
As the application can’t access the RAM directly, the timestamp is read through registers. As a result, it requires synchronization between the application and the hardware. The synchronization mechanism for RAM read is shown in Figure. 2. The state of the application is presented in (a), while that of the hardware in (b). First, the application writes STATE_READ into the flag register. Then if the hardware detects that, one timestamp is read out of the RAM. In the meantime the
Figure. 3. High Accuracy Timestamping System state of the flag register changes to STATE_READ_RAM. The timestamp is stored in the time registers in the next clock. If the application detects the flag register state to be STATE_READ_RAM, it will read the two time registers and writes the flag register again. It is repeated in such way until the read for all timestamp has finished. Then the flag register state changes to STATE_FINISHED. If that is detected by the application, it means that the RAM read is finished.
4
System Implementation
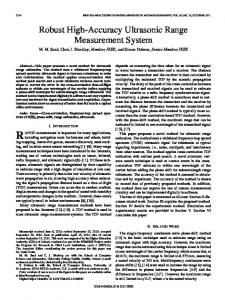
The block diagram of HATS, as shown in Figure. 3, consists of a time counter, RAM to store the timestamp and registers to access RAM. The detailed implementation of the system is described as follows. 4.1
Time Stamp Counter
There is a 64-bit time counter in the time stamp counter module. It records the relative time with 8 ns resolution from when the bitfile is downloaded to the NetFPGA.
4
International Journal of Future Generation Communication and Networking Vol. 3, No. 3, September 2010
4.2
Time Stamp
The time stamp module is placed in the junction of the NIC and Ethernet. It will
Figure. 4. Timestamp Format timestamp each probe packet sent from the NetFPGA to the Ethernet or received from the Ethernet to the NetFPGA there. Consequently, the most accurate timestamp can be obtained to estimate the network behavior, eliminating the influence of the end host. In the subsequent experiments with UDP probe packets, the 16-bit sequence number of UDP packets generated by Iperf can be used as identifiers. The format of the time stamp is shown in Figure. 4. With low 48 bits recording the receiving and sending time, the maximum time recorded can be 2^48ns=281475s=78.2h. That is more than sufficient for network measurement tools. Once the packet is received or transmitted in the NIC, the hardware writes the timestamp into the RAM. If the receiving and transmitting have been finished for all probe packets, all timestamp can be read out of the RAM. 4.3
RAM
There are two pieces of RAM in the FPGA to record the timestamp for receiving and transmitting probe packets respectively. Limited by the resources in the FPGA, the RAM size can't be unreasonably large. Taking into account both the limited resources and the requirement of network measurement tools, the RAM size is set at 24576×64. That means the number of timestamp kept in the RAM is less than 24576. For the prevention of overflow, the hardware writes the RAM circularly. If the RAM address reaches 24575, the next data is written in the RAM address 0 and replaces the old data. As the new data is much more meaningful than the older one in the measurements, this way is reasonable. On finishing receiving or transmitting a probe packet, we enable the corresponding RAM. The timestamp will be written into the RAM in the next clock. 4.4
Registers
As all registers in the NetFPGA are 32 bits, we need three registers for RAM read, two for timestamp storage and one for synchronization between the application and the hardware.
5
Experiment Design
As mentioned above, timestamps in the application, the kernel and the hardware layers are different. In this section, experiments are designed and deployed to evaluate the deviation of timestamp accuracy among them. There are many factors which
5
International Journal of Future Generation Communication and Networking Vol. 3, No. 3, September 2010
Figure. 5. Testbed Topology Table 1. Testbed ConFigureuration Kernel
OS
CPU
PCI
Kernel timer frequency
NIC(used)
M0
2.6.22.6
CentOS release 5.3
Intel Pentium4 3.06GHz×2
66MHz
1000
1000Mbps(NetFPGA)
M1
2.6.22.14
Ubuntu 7.10
66MHz
250
10/100/1000 Mbps
M2
2.6.12.9
66MHz
250
10/100 Mbps
M3
2.6.22.6
66MHz
250
10/100/1000 Mbps
Ubuntu 5.10 Ubuntu 7.10
Intel XeonE5310 1.60GHz×4 Intel Pentium4 3.00GHz Intel Pentium4 3.00GHz×2
S: BitWay 3226TGS
S0/S1: ZTE ZXR10 3928
affect the timestamp accuracy. To explain the application of HATS, only network cross traffic and the probe packet rate are chosen as examples. The systematical experiments will be performed in the near future. 5.1
Experimental Environment
The testbed, as shown in Figure. 5, has a dumbbell topology which is usually used in network measurement. Table 1 shows the conFigureurations of hosts M0-M3, 1Gbps switch S and 100Mbps switches S0-S1. VLAN is conFigureured in S0 and S1 to isolate M0/M2 and M1/M3. As the NetFPGA installed in M0 doesn’t function as auto-negotiation, it can’t be attached to S0 directly. So we attach it to S0 through S. All Table 2. Program Deployed in Hosts M0-3 Test
M0
M1
M2
M3
A
Iperf(sending)/ poisson_rcv
Iperf(receiving)
——
poisson_snd
6
International Journal of Future Generation Communication and Networking Vol. 3, No. 3, September 2010
B
Iperf(receiving)/ poisson_snd
Iperf(sending)
——
poisson_rcv
link capacities are 100Mbps. 5.2
Traffic Generation
The probe packets used for the system are generated by Iperf [2], which is developed by NLANR/DAST as a modern alternative for measuring maximum TCP and UDP bandwidth performance. It allows the tuning of various parameters such as packet protocol, packet length, connection port, testing time, etc. The UDP packet generated by Iperf contains a 16-bit sequence number. It can be used as the timestamp identifier in the test. While sending and receiving UDP packets, Iperf is modified to export the departure and arrival timestamp of the packets in the application layer. The poisson cross traffic is generated by the tool developed by ourselves. In the following tests, the UDP packet length is fixed to be 1500bytes. The UDP packet rate ranges from 0.01 to 100Mbps and the cross traffic rate ranges from 10 to 100Mbps. The step sizes are both 10Mbps. As the link capacity is 100Mbps, the sum of the probe packet rate and the cross traffic rate is limited no more than 100Mbps. The smallest unit used for the accuracy of time is microsecond (us). 5.3
Experiment Design
To evaluate timestamp accuracy for both sending and receiving ends, two groups of tests are performed in the testbed shown in Figure. 5. As the delay and dispersion of the packet train may be affected by the network cross traffic and the probe packet rate, the program deployed in host M0-M3 is described in Table 2. All tests run for 6 times to collect enough data for analysis. Both Iperf and poisson_snd last for 60s each time. Then the RAM on the NetFPGA board can be full filled each time. About 24576×6=147456 group of data is collected in each test. 5.4
Data Collection and Metrics
Iperf exports the timestamp in the application layer, while tcpdump records the timestamp in the kernel layer in the pcap file. HATS is responsible for keeping the timestamp in the hardware layer.
memory bus
PCI
bus
memory bus
PCI
bus
7
International Journal of Future Generation Communication and Networking Vol. 3, No. 3, September 2010
Figure. 6. Timestamp Interval in three layers As shown in Figure. 6, the timestamp interval in the application layer is denoted as A , in the kernel as K and in the hardware as H . The absolute deviation between K and H is denoted as ADK , between A and H as ADA . The relative deviation between K and H is denoted as RDK , between A and H as RDA , where
RDA = A− H / H = ADA / H ,
(1)
RDK = K − H / H = ADK / H .
6
Evaluation and Analysis
6.1
Preprocess
In consideration of packet loss, the collected data is preprocessed. We extract the identifiers in all timestamp and only keep probe packets with the same identifier in all three layers for the following analysis. Others are discarded. A , K and H for all reserved packets are calculated in this step. Table 3. ANOVA Table of CTR for Sending (
ADA )
Source
SS
df
MS
F
Prob>F
Columns
0.2
6
0.03
1.4e-5
1
Error
2483793433.4
10131779
2407.29
——
——
Total
2483793433.6
10131785
——
——
——
Table 4. ANOVA Table of CTR for Sending (
ADK )
Source
SS
df
MS
F
Prob>F
Columns
0.03
6
0.005
5.4e-5
1
Error
96279276.20
10131779
93.3139
——
——
Total
96279276.23
10131785
——
——
——
Table 5. ANOVA Table of PPR for Sending (
ADA )
Source
SS
df
MS
F
Prob>F
Columns
1.3
5
0.27
0
1
Error
2230752360.7
884202
2522.9
——
——
Total
2230752362.0
884207
——
——
——
8
International Journal of Future Generation Communication and Networking Vol. 3, No. 3, September 2010
Table 6. ANOVA Table of PPR for Sending (
ADK )
Source
SS
df
MS
F
Prob>F
Columns
7.7
5
1.538
0.01
0.999
Error
98576388.9
884202
111.486
——
——
Total
98576396.6
884207
——
——
——
Table 7. ANOVA Table of CTR for Receiving (
ADA )
Source
SS
df
MS
F
Prob>F
Columns
0.05
6
0
6.1e-7
1
Error
14907654031.05
10131562
1445105
——
——
Total
14907654031.10
10131568
——
——
——
Table 8. ANOVA Table of CTR for Receiving (
ADK )
Source
SS
df
MS
F
Prob>F
Columns
0.01
6
0.0015
2.3e-5
1
Error
65210966.99
10131562
63.2158
——
——
Total
65210967.00
10131568
——
——
——
Table 9. ANOVA Table of PPR for Receiving (
ADA )
Source
SS
df
MS
F
Prob>F
Columns
9.7
5
1.9
7.7e-5
1
Error
22305934803.3
884028
25232.2
——
——
Total
22305934813.0
884033
——
——
——
Table 10.
ANOVA Table of PPR for Receiving (
ADK )
Source
SS
df
MS
F
Prob>F
Columns
10.2
5
2.0437
0.02
0.9997
Error
75742611.8
884028
85.679
——
——
Total
75742622.0
884033
——
——
——
Table 11.
AD and RD of various PPR for Sending (CTR=30Mbps)
Packet rate(Mbps) ADA (us)
10
20
30
40
50
60
70
28.1
25.3
25.4
25.3
23.8
25.7
26.1
RDA (%)
2.5
4.4
6.6
9.2
11.7
17.6
22
ADK (us)
16.1
14.9
14.8
15.2
14.3
15.9
16.1
9
International Journal of Future Generation Communication and Networking Vol. 3, No. 3, September 2010
RDK (%) Table 12.
1.5
2.6
3.9
5.6
6.8
9.7
12.1
AD and RD of various PPR for Receiving (CTR=30Mbps)
Packet rate(Mbps) ADA (us)
10
20
30
40
50
60
70
21.4
20.9
21.2
22.1
22.4
23.3
22.3
RDA (%)
1.8
3.4
5.2
7.2
9.2
11.5
12.7
ADK (us)
7.0
7.9
8.0
8.2
10.1
9.0
9.7
RDK (%)
0.6
1.3
1.9
2.6
4.1
4.3
5.5
6.2
One-way Analysis of Variance
Analysis of variance (ANOVA) is a technique for analyzing the way in which the mean of a variable is affected by different types and combinations of factors. One-way analysis of variance is the simplest form. It is an extension of the independent t-test. It can be used to compare more than two groups or treatments. It compares the variability between the samples (caused by the factor) with the variability within the samples (caused by systematic error). Rejecting the null hypothesis means the factor is significant. In this section, one-way analysis of variance is used to evaluate the effect of different probe packet rate (PPR) and cross traffic rate (CTR) on ADA and ADK . As the two factors are independent, CTR is set at 40Mbps for testing PPR, while PPR is set at 40Mbps for testing CTR. The results for sending are shown in Table 3-6. Table 7-10 show the results for receiving. The first column of each table shows the source of the variability. The second shows the Sum of Squares due to each source. The third shows the degrees of freedom associated with each source. The fourth shows the Mean Squares for each source. The fifth shows the F statistic. The sixth shows the pvalue, which is derived from the cdf of F. As the p-values in Table 3-10 are all approximate to 1, we should accept the null hypothesis. That means neither PPR nor CTR is significant for the absolute measurement error. 6.3
Relative Deviation Analysis
In this section, the timestamp interval relative deviation of different probe packet rates is analyzed. The cross traffic rate is set at 30Mbps for the following analysis. The results report 90% confidence interval. As shown in Table 11 and 12, absolute deviation of various PPR for both sending and receiving is similar. That is consistent with the One-way ANOVA above. However, as the probe packet rate increases, RDA and RDK increase significantly. The reason for this is that, as the PPR increases, absolute deviation varies little, while the interval between probe packets decreases linearly, as a result, RD increases obviously. Observed from the tables above, there is another point that needs to be noticed. ADA is obviously larger than ADK . So the timestamp in the application layer is more inaccurate than that in the kernel layer.
7
Related Work
Most measurement tools are affected by the timestamp accuracy. There are many researches focusing on modifying the network state measurement algorithm, but few researches have been done to analyze
10
International Journal of Future Generation Communication and Networking Vol. 3, No. 3, September 2010
and evaluate the deviation of timestamp accuracy among the application, the kernel and the hardware layers. There are several methods to improve the timestamp accuracy. The Global Positioning System (GPS) is widely used in network time synchronization to measure the one way delay (OWD) [3]. It can provide reliable clock synchronization with high accuracy in the order of tens to hundreds of nanoseconds. Li Wenwei proposed to remove the timestamping place from application to network driver to elevate timestamp precision [4]. Some network cards (including SysKonnect) have an onboard timestamp register which can provide information on the exact packet arrival time, and pass this timestamp to the system buffer descriptor [5]. Then the NIC timestamp can replace the system clock timestamp. Endace DAG NICs provide 100% packet capture, regardless of interface type, packet size or network loading. They supply packets through their own API, which provide nanosecond timestamp [6]. However, they're not regular networking cards, as they capture packets bypassing the kernel, network stack and libpcap. Also, they are relatively expensive and requiring custom hardware at the end points limits the flexibility of the framework. Reference [7] presented a method that estimated the timestamp accuracy obtained from measurement hardware Endace DAG 3.5E and software Packet Capture Library. Reference [8] quantified and discussed various impacts on timestamp accuracy of application-level measurements. They used the Distributed Passive Measurement Infrastructure (DPMI), with Measurement Points (MPs) instrumented with DAG 3.5E cards for the reference link-level measurements. Reference [9] investigated how measurement accuracy was affected by hardware and software that was used to collected traffic traces in networks. They compared the performance of the popular free softwares tcpdump and windump with the dedicated measurement card DAG in terms of packet inter-arrival times and data loss.
8
Conclusions
An accuracy timestamping system HATS was designed and implemented based on NetFPGA. With HATS, the deviation of timestamp accuracy among the application, the kernel and the hardware layers was evaluated and analyzed. The experiments demonstrated that the timestamp in the application or the kernel layers, affected by the end hosts, was not as accurate as that in the hardware layer. The relative deviation increased a lot as the packet rates increased. Therefore the timestamp in the application or the kernel layer is only suitable for low-speed network measurement, while in high-speed network it requires to timestamp probe packets in the hardware layer. Next, we plan to perform more experiments with HATS to evaluate the errors induced by the application and the kernel layer timestamp for different measurement algorithms and tools. Moreover, we will attempt to improve the performance of the measurement tools in high-speed network based on these results. Acknowledgments. This work is supported by National Basic Research Program of China (973 Project, No.2007CB310806) and National Science Foundation of China (No.60850003).
References 1. NetFPGA, http://www.netfpga.org 2. Iperf, http://dast.nlanr.net/Projects/Iperf/ 3. Daniel M. Batista, Luciano J. Chaves, Nelson L.S. da Fonseca, Artur Ziviani: “Performance analysis of available bandwidth estimation”, The Journal of Supercomputing, October, 2009 4. Li Wenwei, Zhang Dafang, Xie Gaogang, Yang Jinmin: “A High Precision approach of Network Delay Measurement Based on General PC”, Journal of Software, February, 2006 5. SysKonnect, http://www.syskonnct.com 6. Endace DAG NICs, http://www.endace.com/dag-network-monitoring-cards.html
11
International Journal of Future Generation Communication and Networking Vol. 3, No. 3, September 2010
7. Patrik Arlos, Markus Fiedler: “A Method to Estimate the Timestamp Accuracy of Measurement Hardware and Software Tools”, PAM, 2007 8. Katarzyna Wac, Patrik Arlos, Markus Fiedler, Stefan Chevul, Lennart Isaksson, Richard Bults: “Accuracy Evaluation of Application-Level Performance Measurements”, Proceedsings of the 3rd EURO-NGI Conference on Next Generation Internet Networks Design and Engineering for Heterogeneity (NGI07), May, 2007 9. Patrik Arlos, Markus Fiedler: “A Comparison of Measurement Accuracy for DAG, Tcpdump and Windump”, http://www.its.bth.se/staff/pca/aCMA.pdf, verif. January, 2007
12