HDBTracker: Monitoring the Aggregates On Dynamic Hidden Web Databases Weimo Liu1 , Saad Bin Suhaim1 , Saravanan Thirumuruganathan2 , Nan Zhang1 , Gautam Das2 , Ali Jaoua3
The George Washington University1 ; University of Texas at Arlington2 ; Qatar University3 {wliu,
ssuhaim, nzhang10}@gwu.edu; {saravanan.thirumuruganathan@mavs, gdas@cse}.uta.edu;
[email protected] ABSTRACT Numerous web databases, e.g., amazon.com, eBay.com, are “hidden” behind (i.e., accessible only through) their restrictive search and browsing interfaces. This demonstration showcases HDBTracker, a web-based system that reveals and tracks (the changes of) userspecified aggregate queries over such hidden web databases, especially those that are frequently updated, by issuing a small number of search queries through the public web interfaces of these databases. The ability to track and monitor aggregates has applications over a wide variety of domains - e.g., government agencies can track COUNT of openings at online job hunting websites to understand key economic indicators, while businesses can track the AVG price of a product over a basket of e-commerce websites to understand the competitive landscape and/or material costs. A key technique used in HDBTracker is RS-ESTIMATOR, the first algorithm that can efficiently monitor changes to aggregate query answers over a hidden web database.
1.
INTRODUCTION
We propose to demo HDBTracker, a prototypical system we built for monitoring the real-time changes of various types of aggregates, e.g., COUNT, SUM, and AVG queries with or without selection conditions, over frequently-changed web databases that are hidden behind proprietary search and/or browsing interfaces. Hidden Web Databases: Many web databases are “hidden” behind restrictive search/browsing interfaces that allow a user to specify the desired values for one or a few attributes (i.e., form a conjunctive search query), and return to the user a small number (e.g., k = 50 or 100) of tuples that match the user-specified query, selected and ranked according to a proprietary scoring function. Examples of such databases include Yahoo! Autos, amazon.com, eBay, CareerBuilder.com, etc. Motivations for Aggregate Tracking: The ability to track and monitor aggregates has applications over a wide variety of domains. We briefly discuss a few motivating examples as follows. • Tracking the number of tuples in a web database is by itself an important problem. For example, the number of active job post-
This work is licensed under the Creative Commons AttributionNonCommercial-NoDerivs 3.0 Unported License. To view a copy of this license, visit http://creativecommons.org/licenses/by-nc-nd/3.0/. Obtain permission prior to any use beyond those covered by the license. Contact copyright holder by emailing
[email protected]. Articles from this volume were invited to present their results at the 40th International Conference on Very Large Data Bases, September 1st - 5th 2014, Hangzhou, China. Proceedings of the VLDB Endowment, Vol. 7, No. 13 Copyright 2014 VLDB Endowment 2150-8097/14/08.
ings at Monster.com or listings at realestate.com can provide an economist with real-time indicators of US economy. Similarly, tracking the number of apps in Apple’s App Store and Google Play provides us a continuous understanding of the growth of the two platforms. Note that while some web databases (e.g., App Store) periodically publish their sizes for advertisement purposes, such published size is not easily verifiable, and sometimes doubtful because of the clear incentive for database owners to exaggerate the number. • More generally, there is significant value in monitoring a wide variety of aggregates. For example, a sudden drop on the COUNT of used Ford F-150s on a used-car trading website may indicate a subsequent increase of prices. Similarly, a rapid increase of AVG salary offered on job postings which require a certain skill (e.g., Objective C) may indicate a fast expansion of the corresponding market (resp. iOS/Mac OSX development). Throughout this demo proposal, a running example we shall use is the monitoring of average bidding price for certain categories of products (e.g., watches) on eBay.com, and the comparison with that over amazon.com. Key Technical Challenges: Since most real-world web databases do not allow aggregate queries to be specified through their public web interfaces, a key technical challenge facing a third-party1 aggregate tracking/monitoring system is that it must somehow “translate” the aggregates being tracked to a number of search queries that are supported by the public web interfaces. Prior work have introduced sampling-based algorithms (e.g., [1]) and system implementations (e.g., see demo [3]) that enable such a translation for producing unbiased estimations of SUM and COUNT aggregates. Like any sampling-based technique, the more queries the system issues (i.e., the longer delay one can tolerate before receiving an aggregate estimation), the smaller the estimation error (caused by the variance of estimations) will be. Nonetheless, all these existing techniques were designed under one crucial assumption: the database does not change over time. This is obviously an unrealistic assumption in practice - indeed, in many cases it is exactly the change of aggregates that are of interest - e.g., the aforementioned monitoring of the count of job openings as an economic indicator. A seemingly simple approach to tackle a dynamically changing web database is to repeatedly execute (e.g., at a fixed time interval) the techniques designed for static hidden databases. Unfortunately, this “patch” has two critical problems: • Many real-world web databases limit the number of search queries one can issue through per-IP (for web interface queries) or per1 Here we use “third-party” to refer to a system that is unaffiliated with - i.e., does not have back-end full access to - the web databases being monitored.
1569
developer key (for API based queries) limits. In many cases, this daily limit is too low to sustain a complete execution of the static algorithm (to reach a reasonable accuracy level). For example, eBay limits API calls to 5,000 per day, making it extremely difficult for a third party user to track changes that occur to the database. The existing (static) techniques handle this by stretching its execution over a longer period of time (e.g., several days/weeks), and assume that the database does not change within the execution period - an assumption that often does not hold for frequently updated web databases such as eBay. • Even when the daily limit is high enough, repeated executions actually waste a lot of search queries. To understand why, consider an extreme-case scenario where the underlying database remains unchanged. With repeated execution, the estimation error remains the same as the first-day estimate, even after numerous queries have been issued in later days. On the other hand, it is easy to see that if one somehow detects the fact that the database changes little over time, then all queries issued afterwards can be used to improve the estimation accuracy and reaching a significantly lower error than the simple patch “repeated execution”.
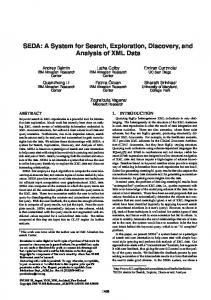
We now discuss the architecture of HDBTracker as depicted in Figure 1. One can see from the figure that the system contains five main components: web server, sampling server, sample database, user credential database, and web database interface server. We introduce the design of these components respectively as follows.
aggregate query
ARCHITECTURE
2 Note that while some web databases do display a list of recently added items (e.g., “New and Noteworthy” for App Store), such a list is rarely comprehensive. In addition, there is no direct way to identify tuples that were recently deleted (e.g., cancelled job listings at monster.com) or updated - which are important for understanding how the database changes over time.
estimations
samples
estimation aggregate search stream Client Web query Web query Interface Server Sampling Server
HTTP request result HTML
Deep Web Database
Web-DB Interface Server HDEstimator
Figure 1: Architecture of HDBTracker
2.1
Another straightforward approach is to track all changes that occur to the underlying database - i.e., to determine which tuples got inserted/deleted - and then use these changes to update the previous aggregate estimations. This approach, however, likely requires an extremely large number of queries in most real-world settings2 , as shown in previous studies of web database crawling [4]. Enabling Technique Behind HDBTracker: In [2], we proposed RS-ESTIMATOR, an algorithm for estimating and tracking various types of aggregates over a dynamically changing hidden web database (i.e., with insertions, deletions, and updates) by issuing search queries supported by (the public web interfaces of) these web databases on a low-frequency basis. The key idea of RS-ESTIMATOR is a set of subtle inference rules that indicate how one can take advantage of historic query answers to reduce the number of search queries that a future aggregateestimation task is translated to. Equipped with these inference rules, RS-ESTIMATOR first uses a small number of bootstrapping queries to estimate how much change has occurred to the underlying database. It then uses this information to allocate the search queries it is about to issue across two categories: (1) for updating the aggregate estimations generated before, and (2) for directly producing new aggregate estimations. Specifically, the more changes occurred to the database, the more search queries RS-ESTIMATOR will spend on updating previous estimations. On the other hand, if little change has occurred to the database, then almost all newly issued search queries will be for generating new (independent) estimations, leading to a smaller estimation error. In the rest of this demonstration proposal, we shall first describe the system architecture of HDBTracker, including its technical contributions beyond RS-ESTIMATOR, and then discuss our demonstration plan, which showcases the broad class of aggregate queries and real-world web databases supported by HDBTracker as well as its practical limits.
2.
user credentials
Sample DB
Web Server
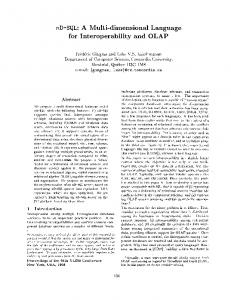
The key task of the web server is to provide users with a web interface that allows the specification of aggregate queries (as input) and the display the change of estimated aggregates (i.e., output) at real-time through animated charts (e.g., bar chart, line chart, etc.). Input Interface: HDBTracker allows users to specify an aggregate query through an intuitive, step-by-step, web interface. Figure 2 depicts an example. One can see from the figure that a user can specify three elements of the aggregate query: (1) filters, i.e., the selection conditions in the aggregate query, (2) control, i.e., the GROUPBY attribute in the aggregate query - which will serve as the X axis in the output charts, and (3) features, i.e., one or more aggregate functions and the corresponding attributes (that is aggregated)3 - i.e., the Y axis(es) in the output charts. The example illustrated in Figure 3 is an aggregate query a user specifies over the Watch department of amazon.com. Specifically, Gender = Women’s, Age = Modern, and Band Material = Carbon Fiber are selected as filters; Style is specified as control, while two features are selected - i.e., COUNT(*) and AVG(Price). One can see that through these tri-element specification, the user is essentially defining aggregate SELECT COUNT(*), AVG(Price) FROM D WHERE Gender = Women’s AND Age = Modern AND Band Material = Carbon Fiber GROUP BY Style. Output Interface: The output interface displays the estimated aggregates in a 2D chart, and visualizes the change of estimations using an animation. Note that each feature specified in the input query is represented as a line (or a group of bars, etc.) in the chart. Figures 4 and 5 depict examples of the output interface. One can see from Figure 4 that the X-axis is the control attribute Style, while the feature attributes, COUNT(*) and AVG(Price), are represented as two lines respectively in the chart. Historic Aggregate Tracking: A user of HDBTracker may be interested in both short-term (real-time) and long-term aggregate tracking. Thus, the web interface allows a user to save an aggregate query and later check back in to retrieve the change of aggregate estimations over days or weeks. To this end, we store each userspecified aggregate query as a tuple in the query database (which contains huser, aggregate queryi information). When a user leaves the front-end web interface, we stop the streaming of aggregates from the sample database to the web server, but does not stop the periodic estimation of saved aggregate queries (as initiated by the sampling server, executed through the web-database interface server, and eventually has samples and estimations stored in the sample database). When a user logs back into our front-end interface and 3 Note that no attribute is needed when the aggregate function being specified is COUNT(*)
1570
Figure 2: Request Figure 3: The Re- Figure 4: The ReInterface quest sult Graphic
reuse module which aims to maximize the reuse of search queries among all aggregate-tracking tasks over the same web database. In addition, HDBTracker also dynamically determines the number of search queries spent on each aggregate-tracking task based on an estimation of the confidence interval (for both current estimation and estimation of change from historic estimations), in order to avoid overspending search queries on aggregate estimations that are already highly accurate and/or rarely change in history.
2.3
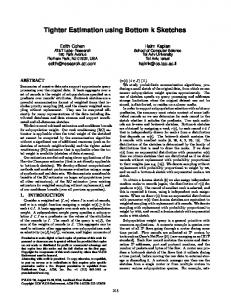
Figure 5: Amazon
Figure 6: eBay
retrieves a saved aggregate query, the web server retrieves past estimations for the aggregate query from the sample database, and then displays the historic change of aggregate estimations as a 2D chart with a timeline control.
2.2
Sampling Server
The task of the sampling server is to translate a user-specified aggregate query to a small number of individual search queries supported by the corresponding hidden web database, and then send these search queries to the web-database interface server. The key technique used in the sampling server is the aforementioned RSESTIMATOR. While we refer readers to [2] for technical details of the algorithm, here we provide a brief summary of the algorithm in order to present a more comprehensive picture of the system implementation. Summary of RS-ESTIMATOR: The key idea behind Algorithm RS-ESTIMATOR is to leverage answers of historic queries to infer (1) the amount of change happened to the database, and (2) what is the minimum set of search queries to issue in order to update a previous aggregate estimation. To understand how the inference works, consider a simple example where RS-ESTIMATOR needs to update a sample tuple obtained before. For each sample tuple t, we associate with it a designated valid query qt (i.e., a query which returned t and matched at most k tuples). When we need to “update” the sample tuple (i.e., generate a sample tuple for the changed database), instead of repeating the sampling process all over again, we directly start from issuing qt and compare its results with the historic query answer. If qt returns fewer tuples, it means the database “shrinks” (at least on the part containing t). As such, we make qt “broader” by randomly removing (conjunctive) selection conditions from it, and then generate a new sample tuple from the broader query. On the other hand, if qt returns more tuples, we make qt narrower by appending new random conditions, and generate the sample from the narrower qt . Interestingly, this update strategy not only saves queries, but maintains the unbiasedness of SUM and COUNT aggregate estimations produced by the updated samples [2]. In addition to this key idea, RS-ESTIMATOR also allocates the number of search queries used for updating previous samples and generating new ones dynamically based on the estimated changes to the database, in order to achieve the smallest estimation variance (and error) in a way similar to the sample allocation in stratified sampling. Besides the optimization strategies used in RSESTIMATOR, HDBTracker also includes new technical ideas to further improve the performance of aggregate tracking. For example, since multiple users may be tracking aggregate queries over the same web database, we implement in sampling server a query
Web-DB Interface Server and User Credentials Database
The task of the web-DB interface server is two-fold: (1) to translate a search query issued by the sampling server to an HTTP GET or POST request that can be sent to the hidden web database, and (2) to parse the returned web page (which contains the search query answer) and translate it to the corresponding (structured) tuples that are then sent to the sample database. There are two important issues related to the design of the webDB interface server: First, each web database may require a different wrapper design for the translation of search query to HTTP request. Some web databases allow relatively easy translations e.g., both amazon.com and eBay provide APIs that directly return JSON/XML that can be easily casted into structured tuples in the sample database. On the other hand, API-less web databases may require more complex techniques - e.g., DOM parsing and/or regular expressions. In HDBTracker, we specify the translation process for each website in a separate script file which is then read by the web-DB interface server and executed to enable the translation. The second design issue here is the per-user query that is often enforced by web databases. For example, eBay.com only allows each registered user 5,000 search queries per day. While some web databases/APIs allow anonymous access (e.g., YouTube), logging in with user credentials often significantly increase the quota limit on search queries. To support a large number of concurrent users, the user credential database of HDBTracker is designed to store such user-credential information of end users and ’forward’ it to the corresponding web database. Specifically, we require each user to contribute his/her login information for the web database he/she wants to monitor. Then, we pool the allowable quota (of search queries) from end users together for use by the sampling server.
3.
DEMO PLAN
In this section, we discuss our plan for demonstrating HDBTracker. Specifically, we shall first describe the hardware setup, the interactions with audience, and the backup plan in case of slow/nonexistent Internet connections. Then, we describe a specific example of how the audience can interact with our system to estimate interesting aggregates at real time from real-world web databases.
3.1
Overview
Hardware Setup and Backup Plan: Since our HDBTracker system is web based, it naturally supports access from multiple platforms. During the demo, we shall use an iPad connected with a portable projector to demonstrate our system, so as to ease interactions with the audience. Meanwhile, we shall also provide 3 laptops with access to our system, so visitors who are interested in more interactions with our system can try it out on these computers. All demo tablets and laptops connect to our web server of HDBTracker (to be hosted at EC2 Singapore for shorter latency for access from China) by default. As a backup plan in case of slow Internet connectivity, we also host the HDBTracker locally at one of the demo laptops, and access this local server through a local adhoc wireless network. Similarly, while the default setting is to
1571
access the target web databases (e.g., amazon.com) at real time, we also include in the local deployment of HDBTracker a lightweight web server simulating these web databases (using the real historic data we collected). System Setup and Audience Interactions: While the design of HDBTracker is generic to any web database featuring a form-like search interface, the web-DB interface server component does require a pre-configured specification file for each web database. The demo system shall contain a large number of pre-configured specification files, including popular web databases in a variety of domains such as e-commerce (e.g., amazon.com, eBay.com), realestate (e.g., zillow.com), car trading (e.g., Yahoo! Autos), etc. Visitors to the demo can freely select the web database of interest, specify the aggregate query of interest, and then observe the tracking of such aggregates over the selected web database at real time. To demonstrate during the short demo session the effectiveness and utility of our HDBTracker system over a longer period of time (e.g., tracking an aggregate for months), we also setup the aforementioned web-DB simulator with days/months’ historic data collected from popular web databases (e.g., amazon.com, eBay.com). If a visitor to our demo is interested in seeing how long-term tracking of an aggregate works, we shall replay the historic data in a faster speed, and demonstrate to the visitor (1) what information our system provides on an aggregate being tracked for a returning user, and (2) animations of how the aggregates change over days/months. As we shall show in the following subsection, a visitor may be able to observe interesting yet intuitive patterns from such long-term aggregate tracking results. Finally, we also plan to demonstrate the limitations of our HDBTracker system, again with the help of the web-DB simulator. For example, we shall show that, with an artificially small value of k (as in the top-k tuple output interface for search queries) or extremely volatile changes of the web databases (both can be set in the simulator), HDBTracker might take a long time to converge and/or produce inaccurate estimations. We shall also demonstrate (by changing input data to the simulator) why HDBTracker might not produce accurate estimations for MIN or MAX aggregates.
3.2
Case Studies: Tracking of Average Price
To provide an intuitive description of how a visitor to our demo may interact with HDBTracker, we discuss here two case studies of using the system to track the change of average price over amazon.com and eBay.com, on a longer and shorter time frame, respectively. Both case studies will be available as the aforementioned “historic data sets” in our demo, so visitors may observe the same results discussed below and draw their own conclusions. For amazon.com, we used HDBTracker to monitor AVG(Price) of all watches sold by amazon.com during Thanksgiving week, 2013, in order to test whether the price would fluctuate significantly during the most anticipated shopping week in US. During the demo, a visitor will be able to choose various system parameters including selection conditions (e.g., men’s watches only), aggregate query of interest (e.g., percentage of women’s watches), number of web requests issued to amazon.com (our default setting was 1,000 queries per day), etc. Figure 5 depicts what the audience will see as the tracking results from the HDBTracker system. One can observe from the figure an interesting pattern: The average price (estimations) had a sharp drop (∼$50) on Thanksgiving day (Nov 28) and Black Friday (Nov 29) - consistent with the common belief that most sellers ran promotions during this period - yet quickly went back to normal after Black Friday. Meanwhile, the other aggregates being tracked, i.e., the percentage of men’s and wrist watches, did not change significantly during the time period.
While the above case study shows what a visitor can observe for the long-term tracking of an aggregate query, the following case on eBay.com demonstrates how a visitor can interact with HDBTracker system to conduct real-time monitoring of aggregates, and draw meaningful conclusions right away during the demo session. Specifically, Figure 6 shows what a visitor can see with HDBTracker by monitoring two aggregates, the average price of all women’s wrist watches for “bidding” and “Buy It Now” at eBay, respectively, during a few hours. One can see that the visitor can draw a number of interesting conclusions from the results: (1) Consistent with intuition, Buy It Down items are more expensive than items for bid. (2) Unlike what intuition would suggest (e.g., since most bidding activities from US happen at night, one might conjecture that bidding prices in the afternoon would be lower), bidding prices do not change significantly during the day. One can see from the figure that HDBTracker can also be configured to plot more technical information in the output chart - e.g., the confidence interval of aggregate estimations, the comparisons between different aggregate estimation algorithms (e.g., a comparison with the repeated execution of aggregate estimation algorithms for static databases [1]), etc. Like what was discussed in the last case study, during the demo session, a visitor will be able to adjust a variety of parameters and make interesting observations - e.g., whether the average bidding price at exact hour is higher than the half-hour mark.
4.
SUMMARY
We proposed to demonstrate HDBTracker, a system that efficiently tracks and monitors aggregate query answers over a dynamically changing hidden web databases by only issuing (at low frequency) search queries through the public web interfaces of these databases. As one can see from the demonstration, HDBTracker not only provides analysts with valuable information for data analytics, but has the potential for enabling a multitude of third-party applications, e.g., mashups, infographics, market research, etc.
5.
ACKNOWLEDGMENTS
Nan Zhang was supported in part by the National Science Foundation under grants 0852674, 0915834, 1117297, and 1343976. The work of Saravanan Thirumuruganathan and Gautam Das was partially supported by National Science Foundation under grants 0812601, 0915834, 1018865 and grants from Microsoft Research. Any opinions, findings, conclusions, and/or recommendations expressed in this material, either expressed or implied, are those of the authors and do not necessarily reflect the views of the sponsors listed above.
6.
REFERENCES
[1] A. Dasgupta, X. Jin, B. Jewell, N. Zhang, and G. Das. Unbiased estimation of size and other aggregates over hidden web databases. In SIGMOD, 2010. [2] W. Liu, S. Thirumuruganathan, N. Zhang, and G. Das. Aggregate estimation over dynamic hidden web databases. In VLDB, 2014. [3] A. Maiti, A. Dasgupta, N. Zhang, and G. Das. Hdsampler: revealing data behind web form interfaces. In Proceedings of the 2009 ACM SIGMOD International Conference on Management of data, pages 1131–1134. ACM, 2009. [4] C. Sheng, N. Zhang, Y. Tao, and X. Jin. Optimal algorithms for crawling a hidden database in the web. In VLDB, 2012.
1572