Heart Rate Turbulence Detection Using Mean Shape Information D Smith1 , K Solem1 , P Laguna2,3 , JP Mart´ınez2,3 , L S¨ornmo1 1
Signal Processing Group, Dept of Electrical and Info Tech, Lund University, Lund, Sweden Arag´on Institute for Engineering Research (I3A), University of Zaragoza, Zaragoza, Spain 3 CIBER de Bioengenier´ıa, Biomateriales y Nanomedicina (CIBER-BBN), Zaragoza, Spain
2
Abstract
tection was considered in relation to the integral pulse frequency modulation (IPFM) model, but extended to account for HRT [5]. It was assumed that the observed signal can be viewed as the summation of HRV, modeled by additive white Gaussian noise, and HRT, modeled as a linear combination of Karhunen–Lo`eve (KL) basis functions. Results from simulated data suggested that the resulting generalized likelihood ratio test (GLRT) detector offers better performance than does T S since at least twice the number of VEBs for averaging are needed for T S to attain a performance which is identical to that of the GLRT detector [5]. Following the work published in [5], it was found that the assumption of HRT being modeled as an unrestricted linear combination of basis functions sometimes lead to turbulence shapes which have nonphysiological characteristic i.e., the signal model is not restricted to the accelerationdeceleration response which is usually referred to as a turbulence shape. In order to solve this problem, a revised model is presented here, where certain a priori information on turbulence shape is incorporated. Further the white noise assumption is examined in terms of HRV and HRT power spectra and its feasibility for modeling HRV is considered; the corresponding GLRT detector is derived and evaluated.
In this study, we propose a generalized likelihood ratio test statistic for detection of heart rate turbulence (HRT) based on a linear signal model. The new test statistic, which expands our previous original detector, takes a priori information regarding HRT shape into account. The detector structure is based on the extended integral pulse frequency modulation model which accounts for the presence of ectopic beats and HRT. The spectral relationship between heart rate variability (HRV) and HRT is investigated for the purpose of modeling HRV “noise” present during the turbulence period.The performance was studied for both simulated data and real data obtained from the Long-Term ST database. The results show that the new detector is superior to the original one as well as to the commonly used parameter turbulence slope (T S) on both types of data.
1.
Introduction
Heart rate turbulence (HRT) refers to a short-term fluctuation in heart rate triggered by a single ventricular ectopic beat (VEB) [1, 2]. Such turbulence is considered to be a blood pressure regulating mechanism which, in normal subjects, compensates for the VEB-induced drop in blood pressure by an accelerated sinus rate. The heart rate then decelerates to its baseline level and the blood pressure returns to its preextrasystolic level [3]. Blunted or missing turbulence reflects autonomic dysfunction and is associated with various conditions. In particular, HRT has been established as a powerful risk predictor of mortality and sudden cardiac death following acute myocardial infarction [1, 2]. To date, turbulence slope (T S) and turbulence onset (T O) are the two most commonly employed parameters for assessing HRT. It has been demonstrated that T S suffers from certain shortcomings, notably that T S is overestimated when few VEBs are available for averaging or when considerable heart rate variability (HRV) is present [4]. Recently a model-based approach to HRT de-
ISSN 0276−6574
2.
Materials
2.1.
Simulated signals
The IPFM model can be used to create a series of heartbeat occurrence times from a continuous-time modulating signal m(t) which reflects the autonomic influence on the cardiac rhythm [6]. An extended IPFM model was recently proposed which accounts for HRT by introducing a feedback branch which is triggered by an ectopic beat [5]. The observations xl of the lth VEB can be written as xl = hl + ml ,
(1)
where hl and ml are the N × 1 discrete time vectors of HRT and HRV, respectively. The HRT response to the lth
153
Computers in Cardiology 2009;36:153−156.
VEB is modeled linearly with a truncated set of KL basis functions, hl = Bθ l , (2)
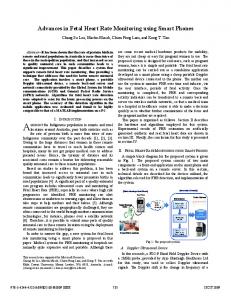
their power spectra. A segment before a VEB is denoted IA and a segment after a VEB is denoted IB . If the IB segments adhering to a specific record is averaged prior to power spectral estimation, HRV largely cancels out and the power spectrum from such a segment will reflect HRT only. The averaged segment is denoted IB¯. Each segment contain 15 s of data. By calculating the average power spectrum of every IA , IB and IB¯ segment one can evaluate the relation between HRV and HRT. Figure 1 shows the average power spectra for segments IA , IB , and IB¯ when HRT is present. These observations show that a substantial spectral overlap exists between IA and IB segments. Since the HRT spectrum PB¯ (ejω ) is largely confined inside the HRV spectrum P¯A (ejω ), a noise whitening operation would also whiten the HRT signal and render detection improvement difficult. It is therefore concluded that the white noise assumption is feasible to adopt in a model for HRT detection.
where B is an N × r matrix whose r columns contain the KL basis functions, and θ l is an r × 1 vector containing the KL coefficients associated with the lth VEB. The basis functions in B, together with θ l , define the turbulence shape. It is assumed that HRT has a known deterministic shape which can be obtained from the KL representation of the datasets described previously. The vector ml , accounting for HRV, is generated by a 7th order autoregressive (AR) model, representing variability during resting conditions [5]. The desired SNR between HRV and HRT is obtained by changing the ratio between the energy of hl and ml .
2.2.
ECG signals
The Long-Term ST database contains 86 ECG Holter recordings of 80 subjects, acquired during clinical routine in USA and Europe [7]. A selection of VEBs was gathered from this database where the VEBs adhered to the criteria given in [2]. These criteria ensure that the sinus rhythm immediately preceding and following the VEB is free of artefacts, arrhythmia, and false classifications and is thus suitable for HRT analysis. Dataset for spectral study: When analyzing the spectral properties of HRT and HRV, two additional criteria were introduced: The recording should contain ≥ 40 VEBs to ensure that the variance of the spectral estimate is significantly reduced through averaging and T S < 15 so that outlier HRTs are excluded from further analysis. Application of these two additional criteria together with the criteria in [2] resulted in a total of 3498 VEBs from 22 recordings. Datasets for detector evaluation: The following two datasets were used: one containing recordings with HRT, denoted S1 , and another without HRT, denoted S0 . A recording was included in S1 if it contained ≥ 15 VEBs, which all complied with the criteria in [2] and with a T S > 2.5. Application of these two additional criteria together with the criteria in [2] resulted in a total of 5764 VEBs from 26 recordings. The set S0 is constructed by extracting 26577 segments from 10 patients without any VEBs. The set S1 is randomly divided into a learning set (S1,l ) and a test set (S1,t ), whereas the whole data set S0 is used for testing.
3.
4.
HRT detection
Our approach to HRT detection is based on the extended IPFM model and an equidistantly sampled signal xl , obtained after the lth VEB in a recording. Dropping the index l, the detection problem is formulated as H0 : x = m H1 : x = Bµ + m,
(3)
where hypothesis H0 represents when HRT is absent and hypothesis H1 when present. The N × 1 observation vector x in (3) is obtained from the RR intervals subjected to detection, m is an N × 1 vector and represents HRV, here treated as random observation noise. The N × r matrix B contains r different KL basis functions which model HRT, cf. (2). The vector µ is an r × 1 vector containing the KL coefficients of the mean turbulence shape which is estimated a priori from a learning set. Based on the observations made in Sec. 3, HRV is characterized by the Gaussian probability density function N (0, σ 2 I), where I denotes the identity matrix and σ 2 the variance which here is assumed to be unknown and therefore subjected to estimation. The resulting test statistic Tµ (x) of the GLRT is used for HRT detection. Hypothesis H1 is decided if Tµ (x) =
xT x > γ′, (x − Bµ)T (x − Bµ)
(4)
where γ ′ is a threshold determined for a given probability of false alarm (PFA ).
HRV/HRT spectral relation
5. The spectral relation between HRV and HRT is investigated by extracting RR-segments before and after every VEB in the spectral study dataset and thereafter comparing
Detector evaluation
In the evaluation, the original test statistic denoted Tθ (x) [5] and the new test statistic Tµ (x) use basis func-
154
1 0.8
0.6 0.4 0.2
PB¯ (ejω )
1 0.8 P¯B (ejω )
P¯A (ejω )
1 0.8
0.6 0.4 0.2
0 0.25
0.5
0.4 0.2
0 0
0.6
0 0
f (Hz) (a)
0.25
0.5
0
0.25
f (Hz) (b)
0.5
f (Hz) (c)
Figure 1. The average power spectra reflecting (a) HRV, (b) the combined influence of HRV and HRT, and (c) HRT, respectively. One standard deviation is displayed for each power spectrum using dashed lines. ˆ l ), whereas tions that resulted from S1,l , (i.e. B = B the extended IPFM model use basis functions that resulted ˆ t ). Both B ˆ l and B ˆ t are obtained as from S1,t , (B = B the three most significant eigenvectors (i.e., r = 3) of two ¯ x estimated from the obseraverage correlation matrices R vations xl of the two sets S1,t and S1,l . Each observation xl is 10 s, resulting in a 21 × 1 vector. Evaluation of detector performance using different SNRs was performed using the simulation model. The model employed a mean shape resulting from S1,t (µ = ˆ t ), whereas the detector employed a mean shape resultµ ˆ l ). A total of 4000 signals were ing from S1,l , (µ = µ simulated for each of the evaluated SNRs, divided in 2000 signals with HRT and 2000 without. In order to evaluate how variations in mean shape affects detection performance, simulations were performed where the model uses a set of varying mean shapes to generate signals. A set of 100 mean shape vectors were produced according to the Cholesky decomposition of the covariance matrix estimated from the KL coefficients calculated from dataset S1 , thus producing a set of generated KL coefficients. Further, detection performance was evaluated on real ECG signals using the datasets S0 and S1,t .
Turning to the ECG signals, detector performance is evaluated on the test set (S0 , S1,t ), using parameters determined from the learning set (S1,l ). Applying the three detectors to single VEBs, i.e., without resorting to averaging, the ROCs in Fig. 4(a) show that Tµ (x) performs better than both Tθ (x) and T S. Increasing the SNR by averaging 10 VEBs, it is obvious from Fig. 4(b) that Tµ (x) offers superior performance when compared to the other two detectors. A further increase of the SNR, obtained by averaging 50 VEBs, results in an almost perfect ROC for Tµ (x) since the PD = 1 for almost all values of PFA , see Fig. 4(c). The performance of Tθ (x) and T S is still inferior.
6.
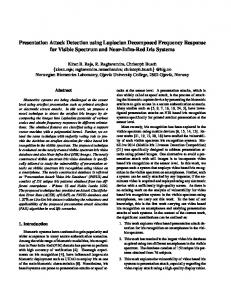
Figure 2. Receiver operating characteristics for Tµ (x) (solid line), Tθ (x) (dashed line), and T S (dotted line) when analyzing simulated signals. The performance is evaluated at an SNR of (a) −10 dB and (b) 0 dB.
SNR = -10 dB
SNR = 0 dB
1
1
0.8
0.8
0.6
0.6
0.4
0.4
0.2
0.2
PD
0
0 0
Results
Figure 2(a) presents the receiver operating characteristics (ROCs), plotting the probability of detection (PD ) against PFA for Tµ (x), Tθ (x), and T S at a very low SNR (−10 dB) of the simulated signals, showing that Tµ (x) performs better than both Tθ (x) and T S. Increasing the SNR to 0 dB, Tµ (x) outperforms the other two, see Fig. 2(b). For an SNR of 10 dB (not shown), the performances of all three detectors are essentially perfect. Figure 3 shows the detection performance for simulated signals when using 100 different mean shapes in the model at an SNR of 0 dB. Tµ (x) clearly offers better performance than do Tθ (x) and T S when variations in the mean shape are present.
7.
0.2
0.4 0.6 PFA (a)
0.8
1
0
0.2
0.4
0.6 PFA (b)
0.8
1
Conclusion
Introducing the mean turbulence shape µ, a large improvement in performance was found on both simulated and real signals when compared to the original GLRT detector Tθ (x) and the commonly used parameter T S. Also, the white noise assumption was concluded as feasible to use in a HRT detector.
155
1
1
1
0.8
0.8
0.8
0.6
0.6
0.6
0.4
0.4
0.4
0.2
0.2
0.2
PD
0
0 0
0.2
0.4
0.6 PFA
0.8
1
0 0
0.2
0.4
(a)
0.6 PFA
0.8
1
0
0.2
0.4 0.6 PFA
(b)
0.8
1
(c)
Figure 3. Receiver operating characteristics obtained when evaluating performance on simulated signals generated using 100 different mean shapes. Solid line describes ROC for the 50th percentile, dashed lines for the 10th and 90th percentile for (a) Tµ (x), (b) Tθ (x) and (c) T S using an SNR of 0 dB. 1 VEB
1
10 VEB S
1
50 VEB S
1
0.8
0.8
0.8
0.6
0.6
0.6
0.4
0.4
0.4
0.2
0.2
0.2
PD
0
0 0
0.2
0.4
0.6 PFA
0.8
1
0 0
0.2
0.4
(a)
0.6 PFA
0.8
1
0
0.2
0.4
(b)
0.6 PFA
0.8
1
(c)
Figure 4. Receiver operating characteristics for Tµ (x) (solid line), Tθ (x) (dashed line), and T S (dotted line) when analyzing ECG signals. The performance is evaluated for (a) single VEBs, (b) averaging of 10 VEBs, and (c) averaging of 50 VEBs.
Acknowledgements
[5] Solem K, Laguna P, Martinez J, S¨ornmo L. Model-based detection of heart rate turbulence. IEEE Trans Biomed Eng 2008;55(12). [6] S¨ornmo L, Laguna P. Bioelectrical Signal Processing in Cardiac and Neurological Applications. Amsterdam: Elsevier (Academic Press), 2005. [7] Jager F, Taddei A, Moody GB, Emdin M, Antolic G, Dorn R, Smrdel A, Marchesi C, Mark RG. Long-term ST database: a reference for the development and evaluation of automated ischaemia detectors and for the study of the dynamics of myocardial ischaemia. Medical and Biological Engineering and Computing 2003;41(2):172–183.
This study was supported by grants from The Swedish Research Council, Gambro AB, Lund, Sweden, CICYT (TEC2007-68076-C02-02), and the Grupo Consolidado T30, DGA, Spain.
References [1] Schmidt G, Malik M, Barthel P, Schneider R, Ulm K, Rolnitzky L, Camm AJ, Bigger JT, Sch¨omig A. Heart-rate turbulence after ventricular premature beats as a predictor of mortality after acute myocardial infarction. Lancet 1999; 353:1390–1396. [2] Schneider R, Barthel P, Watanabe M. Heart rate turbulence on Holter. In Malik M, Camm AJ (eds.), Dynamic electrocardiography. New York: Futura Publ., 2004; 190–193. [3] Watanabe M, Schmidt G. Heart rate turbulence: A 5-year review. Heart Rhythm 2004;1:732–738. [4] Hallstrom A, Stein P, Schneider R, Hodges M, Schmidt G, Ulm K. Structural relationships between measures based on heart beat intervals: Potential for improved risk assessment. IEEE Trans Biomed Eng 2004;51:1414–1420.
Address for correspondence: Danny Smith Dept. of Electrical and Information Technology Lund University P.O. Box 118 SE-221 00 Lund
[email protected]
156