Recent Researches in Circuits, Systems, Multimedia and Automatic Control
Heartbeat Detection Applying Activity Index on Optical Interferometric Signal Sebastijan Šprager, Denis Đonlagić, Damjan Zazula University of Maribor, Faculty of Electrical Engineering and Computer Science Smetanova ulica 17, SI-2000 Maribor SLOVENIA
[email protected] Abstract: - A method for heartbeat detection based on analysis of optical interferometric signal with activity index is presented. Optical interferometer is a sensitive device that detects physical changes of the length of optical fibre. When used as bed sensor, heartbeats cause its perturbation, when a subject lying on the mattress, allowing continuous monitoring of heartbeat in completely unobtrusive way. Experiments were performed on 16 subjects. Interferometric and referential ECG signals were acquired simultaneously for about 60 s. Results were validated by using referential ECG signal. The obtained results show high recognition rate; a sensitivity of 98.03±2.78% and precision of 97.62±2.43%. Key-Words: - heartbeat detection, optical interferometer, monitoring of human vital signs, activity index.
1
interferometric signal. First method for detecting heartbeats from interferometric signals was proposed on zero-crossings in this signals and filter banks tuned to possible heartbeat frequencies [1]. The second approach applied was based on timefrequency representation by using pseudo WignerVille distribution [4]. In this paper, we present a more efficient heartbeat detection method. It is based on optical signal transformed with Hilbert transformation and analysed by using activity index. The sensor and method are described in Section 2. Section 3 explains experimental protocol and Section 4 evaluates the obtained results. A discussion follows in Section 5, while Section 6 concludes the paper.
Introduction
Heart activity is most important human vital function. There are plenty of methods available for monitoring heartbeat, such as electrocardiography (ECG) used as golden standard, plethysmography, etc. All these methods require special knowledge and, usually, clinical environment to perform the measurements. High amount of sensors and electrodes used by these methods can be uncomfortable and disturbing for the patient and impractical for the physician. A crucial question is whether this can be changed and if unobtrusive monitoring of heart rate is feasible without assistance of trained medical staff in home environments. The answer lies in the different types of sensors that can detect electrical, audible, or mechanical activity of the heart, even when there is no direct contact of the sensor and a person’s body. Such advanced sensors receive signals generated by heart through the transmitting medium that is in a direct contact with the person, e.g. the bed or clothes. Heartbeat is detected indirectly, conveyed by the medium, in an entirely unobtrusive way. This field of research is lately quite popular and many approaches for unobtrusive heartbeat monitoring have been developed (a short survey is given in [1]). Feasibility of measuring heart rate by using optical interferometer has already been examined in [1] and [4]. Optical fibres were installed into a mattress, so that mechanical forces produced by heartbeats perturbed the fibres, what affected the
ISBN: 978-1-61804-085-5
2 2.1
Methodology Optical sensor and signal
Our heartbeat detection method relies on a fibre optic Michelson interferometer [2, 3]. It consists of laser diode (in our case telecom distributed feedback laser diode – DFB), sensing fibre, reference fibre, optical coupler, optical detector, and electronic converter (Fig. 1). Reference fibre is shielded mechanically by placing it in a loss tube, while the sensor fibre is put in a good contact with bed surface. The optical coupler connects the laser diode and optical detector on one side with sensing and reference fibres on the other side. Unconnected fibre ends are covered by thin silver layer to enhance back reflection of the light waves. The coupler then functions as a splitter and combiner of back reflected light waves. Back reflected waves
77
Recent Researches in Circuits, Systems, Multimedia and Automatic Control
are added-up in the coupler (e.g. interfered). Minute changes in sensing fibre length thus cause significant changes in the phases of reflected light. This further means changes of the optical power that is detected by optical detector. The device has a cosine transfer characteristic. One period corresponds to a fibre length change that is equivalent to the half wavelength of the used optical source, which is 0.65 m in our particular case (we used 1300 nm telecom DFB diode). Optical power detected by optical detector is sampled at 50 kHz and represented as interferometric signal i(n) (Eq. (1) and Fig. 2 a).
n s n (n) tan 1 y(n).
The contributions of the other impacts n on optical fibre elongation are assumed minimal, thus we can expect: n s n.
In our experiment, we observed minute changes of the sensing fibre length, caused by heartbeats of a person when lying still on the fibre. These, denoted by s(n), and all other impacts on fibre elongation change in time, n , i.e. noise from the environment, thermal drift, etc., and make the signal i(n) highly nonstationary. In order to derive the signal that represents such shortening and stretching of optical fibre, interferometric signal must be transformed by using phase demodulation. A model of the interferometric signal i(n) is shown in the following equation:
Fig. 2: Interferometric signal transformation: (a) a two and a half second segment of optical signal; (b) unwrapped phase of interferometric signal by first using Hilbert transformation; (c) high-pass filtered signal from (b).
(1)
Analytic representation of such signal can be derived by using Hilbert transform: y ( n) x ( n) j H x ( n ) A(n) cos s(n) (n) j sin s(n) (n) .
2.2
sin s(n) (n)
cos s(n) (n)
tan s(n) (n).
(2)
I a (n) sTe (n)Rs1se (n),
(3)
Thus:
ISBN: 978-1-61804-085-5
Activity index
If a compound signal is to be decomposed to its constituent signal components, activity index [5, 6 and 7] has been recognised capable of supporting this goal. Activity index indicates the level of activity of input sources that produce individual signal components, and is computed as follows:
Phase angle can be expressed as tan (n)
(5)
Therefore, signal s(n) is obtained by computing tan 1 y(n) , which produces a wrapped phase n . The phase must, afterwards, be unwrapped (Fig. 2.b). Finally, in order to measure mechanical activity of the heart by fibre-optic interferometer, we preserve only that part of frequency spectrum of which is characteristic for s(n) ballistocardiographic signals. In our case, s(n) is filtered by using 2nd ordered Butterworth bandpass filter between 0.5 Hz and 30 Hz (Fig. 2.c). Finally, in order to reduce computational complexity, s(n) is downsampled to the sampling frequency of 500 Hz. We found out empirically that a downsampling by factor 100 still preserves the influence of heartbeat we want to measure.
Fig.1: Optical interferometer.
i(n) A n cos s(n) (n).
(4)
78
(6)
Recent Researches in Circuits, Systems, Multimedia and Automatic Control
where Rs stands for correlation matrix of observations se(n). These are obtained by the following extension: T (7) se (n) s(n), , s(n M e 1) ,
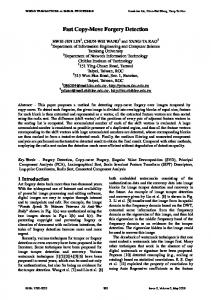
of this source contributing to fibre-optic signal. Therefore, heartbeats can be simply detected as peaks of activity index Ia,k(n). Activity index is computed according to (10) and smoothed by a moving average window afterwards, as seen in Fig. 3. Heartbeats are located by searching local maxima of activity index.
where Me stands for an extension factor. Linear extension of observations in (7) suffices when the observations are multi-channel. Fibre-optic observation is a single-channel signal, this is why it needs additional transformation. It has been shown [7] that in the case when a compound signal consists of non-overlapped components, mainly, a nonlinear extension can be applied to a singlechannel observation. Hence, signal se(n) must additionally be extended in a nonlinear way. A matrix of the k-th order moments can be calculated as
3
M k ( 1 , 2 ,..., k 1 ) E se (n)se (n
Fig 3: Influence of heartbeats as seen in activity index of a fibre-optic signal: heartbeat events occur as prominent peaks, shown along with the referential ECG signal (in red).
1)
se (n
k 1)
,
(8)
The experiment was performed with 15 males and 1 female with average age of 29.13±4.69 years, average height of 177.88±4.71 cm and average weight of 76.63±11.13 kg. Each subject was asked to lie back down on the mattress with the inserted optical fibre. When the subject’s heartbeat settled, signal acquisition was performed for one minute. For about the first half of minute, the subject was asked to lie still and to breathe normally. For the second half of minute, the subject was asked to lie still and hold their breath.
where E stands for mathematical expectation and τ1, τ2, …, τk-1 denote shifts of the extended observations se. The matrix dimension of Mk is k. Any 2D cross-section of this matrix can replace correlation matrix Rs in the definition (6) of activity index. Eq. (6) computes the inverse of correlation matrix on the observations that pre- and postmultiply this inverse at the same time. To keep to this principle, we have to divide the set of k repetitions of observations se from (7) into two subsets, say S1,j and Sj+1,k: S1, j Sj
s e ( n) 1, k
se (n
se (n
1)
j)
se (n
se (n j 1)
j 1)
se (n
k 1)
(9)
where the operator stands for Hadamard (entrywise) product. The generalised definition of activity index based on higher-order moments can now be written as: I a,k (n)
T 1 S1, j (n)RS S j
1,k (n)
Fig 4: Experimental protocol set-up. In order to verify heartbeats after the detection by using proposed method, a Schiller ECG device was attached to each subject during each trial. We applied 4 electrodes on the extremities and lead II was taken as the referential. The acquired referential ECG signals were used to validate the efficiency and accuracy of heartbeat detection from interferometric signal of fibre-optic sensor. R waves in the ECG signal were detected by the method published in [8]. Complete experimental set-up is schematised in Fig. 4. Signals were acquired by our own four-channel sampling device.
(10)
with RS
S1, j STj
1,k .
(11)
Heart activity can be considered an individual signal source, and heartbeats are signal components
ISBN: 978-1-61804-085-5
Experiment setup
79
Recent Researches in Circuits, Systems, Multimedia and Automatic Control
Amplified and anti-aliasing filtered signals were digitised by a 12-bit A/D converter built in the microcontroller PIC18F4458. Optical interference signals were sampled at 50 kHz, whereas the referential ECG signal was sampled at 196 Hz. Hardware signal synchronisation was implemented. Activity index was computer according to Eq. (10) by using moments up to the 2nd order (k = 2) with lags up to 2. The obtained sequence was smoother by running-average in a rectangular window of length 0.5 s.
4
In order to estimate efficiency of the proposed method, reference ECG signals were consulted. From Fig. 3, it is evident that the peaks in smoothed activity index coincide with the ECG R waves. Detection efficiency is determined regarding to each separate reference heartbeat. We refer to the R wave peaks in ECG reference signal and look for a possible detection of a heartbeat within a certain interval tied the R wave position. Due to delay of mechanical activity of the heart in comparison with ECG signal, the detected heartbeats will be delayed regarding to reference R waves. They fall into an interval between two consecutive reference R waves. In the ideal case, in each RR interval exactly one detected heartbeat should appear. In this way, all detected heartbeats are grouped in 3 classes regarding to individual observed reference R wave:
Duration [s]
No. reference beats
1 2 3 4 5 6 7 8 9 10 11 12 13 14 15 16 OVERALL
66.22 66.55 66.88 64.82 64.99 56.67 60.87 65.07 64.90 64.74 56.94 68.11 61.28 63.26 63.34 63.10 63.61±3.27
65 77 81 58 61 49 54 72 79 50 77 60 61 90 79 65 67.38±12.19
No. detected [TP] 65 76 75 58 61 49 54 70 79 50 75 60 61 83 75 62 65.81±10.56
false negative (FN) – the number of all undetected heartbeats in intervals between two consecutive R waves.
sensitivity:
precision:
TP , TP FN
TP . TP FP
The results for all 16 persons using the proposed metrics are shown in Table 1. One of the most important facts when estimating the regularity of heart rate is a stable reference-to-detected heartbeat delay. It appears due to delayed mechanical pressure on the optical fibre caused by physical activity of the heart in comparison to the electrical activity measured by the referential ECG signal. We expect the delay should be about constant. Reference-to-detected heartbeat delay stability can be estimated by standard deviation of these delays. The results for delay estimation for all test signals are depicted in Fig. 5. The overall deviation of heartbeat estimated delays of about ±100 ms can be considered stable enough for the purpose of heartbeat detection, but too low for more accurate studies of heart-rate variability.
true positive (TP) – the number of first detected heartbeats in intervals between two consecutive R waves (if they exist),
ID
false positive (FP) – the number of all (false) detected heartbeats in intervals between two consecutive R waves, after the first one in the interval,
With the three classes, the following two metrics for efficiency estimation of proposed method are introduced:
Results
No. false detected [FP] 0 0 2 0 1 2 2 3 0 5 0 1 2 1 2 3 1.50±1.41
No. undetected [FN] 0 1 6 0 0 0 0 2 0 0 2 0 0 7 4 3 1.56±2.31
Sensitivity TP/(TP+FN) [%] 100.00 98.70 92.59 100.00 100.00 100.00 100.00 97.22 100.00 100.00 97.40 100.00 100.00 92.22 94.94 95.38 98.03±2.78
Precision TP/(TP+FP) [%] 100.00 100.00 97.40 100.00 98.39 96.08 96.43 95.89 100.00 90.91 100.00 98.36 96.83 98.81 97.40 95.38 97.62±2.43
Table 1: Efficiency of heartbeat detection based on fibre-optic sensor and proposed method.
ISBN: 978-1-61804-085-5
80
Recent Researches in Circuits, Systems, Multimedia and Automatic Control
Fig. 5: Mean and standard deviation of delays between reference and detected heartbeat instants for 16 tested subjects.
Fig. 6: Reference and detected heart rates calculated as mean, standard deviation and median of delays between two consecutive heartbeat time instants for 16 test subjects: crosses with bars show reference mean heart rate and its standard deviation; asterisks represent median reference heart rate, and circles with bars represent detected mean heart rate and its standard deviation, while squares represent median detected heart rate. Important information about the efficiency of proposed approach arises from a comparison of detected versus reference heart rate. Heart rate in our experiments was calculated in two different ways. First, the mean and standard deviation of distances between consecutive time instants of the beats are given. Due to false detected beats, which could significantly affect the calculated mean value, more reliable heart rate is given by calculating the median of time distances between detected heartbeats. The results are depicted in Fig.6.
5
separated, meaning that irregular breathing effect appeared in the signal, which slightly affects recognition rate. The delays between reference and detected heartbeat time instants are almost the same, about 400 milliseconds in all processed signals. Standard deviation of delays is around 100 milliseconds. Comparing the value with the method proposed in [4] (around 230±46 milliseconds), the deviation obtained by proposed method is higher. This can be attributed to the peak shapes in activity index. As these are rather wide and flat, looking for local maxima to locate heartbeats is inclined to inaccuracies. A comparison between reference and detected heart rates (mean, standard deviation and median of the delays between consecutive heart beats) confirms the obtained results. The mean reference and detected rates do not differ much, only the deviation of detected rates is a bit higher with comparison to the deviation of referential rates, which is a consequence of false detected beats. Therefore, if we take a look at median rates, the differences between reference and detected median rates are minimal; that proves a considerable temporal accuracy of proposed method.
Discussion
High efficiency of proposed method for heartbeat detection is shown in Table 1 for 16 test subjects. Sensitivity of 98.03±2.78% and precision of 97.62±2.43% indicate better recognition rates as obtained in [1] (5 tested subjects, 97.1% in segments without breathing and 94.6% in segments with breathing) and is comparable to the method proposed in [4] (6 tested subjects, recognition rate about 98% in segments without breathing and 97% in segments with breathing). Moreover, proposed method is tested on a larger population and the breathing and non-breathing segments are not
ISBN: 978-1-61804-085-5
81
Recent Researches in Circuits, Systems, Multimedia and Automatic Control
6
Conclusion
We proposed a method for heartbeat detection by using activity index on optical interferometric signals. Presented results show high efficiency of the method applied to 16 subjects in terms of recognition rate and temporal accuracy of detected heartbeats. The method outperforms the approaches proposed in [1] and [4]. However, it must be emphasised that the results were obtained under controlled conditions – subjects during rest and no movement while lying on the optical fibre. Further research will be focused on experiments in more demanding circumstances and subjects with heartbeat abnormalities in clinical environment.
[4]
[5]
References
[6]
[1] S. Šprager, D. Đonlagić, D. Zazula, "Monitoring of Basic Human Vital Functions Using Optical Interferometer", IEEE 10th International Conference on Signal Processing ICSP 2010, Beijing, China, vol. 2, pp. 17381741, 2010. [2] E. Udd, "Fiber Optic Sensors - An Introduction for Engineers and Scientists", John Wiley & Sons, 1991. [3] S. Šprager, B. Cigale, D. Đonlagić, D. Zazula, "A wavelet-based detection of active segments in optical interferometer caused by fibre strain", Proceedings of the 10th WSEAS international conference on communications, electrical & computer engineering, and 9th
ISBN: 978-1-61804-085-5
[7]
[8]
82
WSEAS international conference on Applied electromagnetics, wireless and optical communications, pp. 123-127, 2011. S. Šprager, D. Đonlagić, D. Zazula, “Heart Beat Monitoring Using Optical Interferometric Signal and Pseudo Wigner-Ville Distribution”, The 7th International Conference on Information Technology and Applications ICITA 2011, Sydney, Australia, pp. 271-275, 2011. R. Istenič, D. Zazula, “Estimation of the Number of Signal Sources in Compound Signals Using Activity Index Variance”, Digital Signal Processing Workshop and 5th IEEE Signal Processing Education Workshop, pp. 178-181, 2009. D. Zazula, R. Istenič, “Properties of activity index extended by higher-order moments”, WSEAS Proceedings of the 4th international conference on Circuits, systems and signals, pp. 151-157, 2010. D. Zazula, R. Istenič, “Segmentation of Compound Signals Using Higher-Order Activity Indexes”, WSEAS International journal of circuits, systems and signal processing, No.3, vol. 4, pp. 120-128, 2010. J. Pan, W. J. Tompkins, “A real-time QRS detection algorithm”, IEEE Transactions on Biomedical Engineering, No. 3, pp. 230-236, 1985.