Copyright 2003 by the Genetics Society of America
Heterogeneous Selection at Specific Loci in Natural Environments in Arabidopsis thaliana Cynthia Weinig,*,1 Lisa A. Dorn,* Nolan C. Kane,* Zachary M. German,* Solveig S. Halldorsdottir,† Mark C. Ungerer,† Yuko Toyonaga,* Trudy F. C. Mackay,† Michael D. Purugganan† and Johanna Schmitt* *Department of Ecology and Evolutionary Biology, Brown University, Providence, Rhode Island 02912 and †Department of Genetics, North Carolina State University, Raleigh, North Carolina 27695 Manuscript received July 24, 2002 Accepted for publication April 2, 2003 ABSTRACT Genetic variation for quantitative traits is often greater than that expected to be maintained by mutation in the face of purifying natural selection. One possible explanation for this observed variation is the action of heterogeneous natural selection in the wild. Here we report that selection on quantitative trait loci (QTL) for fitness traits in the model plant species Arabidopsis thaliana differs among natural ecological settings and genetic backgrounds. At one QTL, the allele that enhanced the viability of fall-germinating seedlings in North Carolina reduced the fecundity of spring-germinating seedlings in Rhode Island. Several other QTL experienced strong directional selection, but only in one site and seasonal cohort. Thus, different loci were exposed to selection in different natural environments. Selection on allelic variation also depended upon the genetic background. The allelic fitness effects of two QTL reversed direction depending on the genotype at the other locus. Moreover, alternative alleles at each of these loci caused reversals in the allelic fitness effects of a QTL closely linked to TFL1, a candidate developmental gene displaying nucleotide sequence polymorphism consistent with balancing selection. Thus, both environmental heterogeneity and epistatic selection may maintain genetic variation for fitness in wild plant species.
E
XPLAINING the maintenance of quantitative genetic variation in the wild is an important problem in evolutionary biology. The level of standing genetic variation is thought to depend upon the balance between purifying selection, which erodes genetic variation in fitness-related traits, and the introduction of new alleles through mutation (Mousseau and Roff 1987; Barton and Turelli 1989). However, estimates of selection and mutation rates in some species suggest that observed levels of genetic variation are higher than can be explained solely by mutation-selection balance (Houle 1992; Mackay et al. 1995; Nuzhdin et al. 1995; Houle et al. 1996). Possible additional mechanisms for maintaining genetic variation include several forms of heterogeneous natural selection. For example, selection may favor different genotypes in different environments, depending in part on the frequency with which alternative environments are encountered and dominance relations (Levene 1953; Felsenstein 1976; Gillespie and Turelli 1989; Prout and Savolainen 1996). Similarly, epistatic interactions among loci may maintain genetic variation if the fitness effects of an allele at one locus reverse depending on the allelic genotype at another locus (Leips and Mackay 2000). However, the impor-
1 Corresponding author: Department of Plant Biology, University of Minnesota, 230 Biosciences Center, 1445 Gortner Ave., St. Paul, MN 55108. E-mail:
[email protected]
Genetics 165: 321–329 (September 2003)
tance of such gene ⫻ environment and gene ⫻ gene interactions in natural plant populations remains to be determined. The role of heterogeneous selection is of particular interest for the colonizing annual plant Arabidopsis thaliana (L.) Heynh. (Brassicaceae). This genetic model species exhibits variation in quantitative traits both within and between natural populations (Kuittinen et al. 1997; Nordborg and Bergelson 1999; Dorn et al. 2000; Pigliucci and Marlow 2001). In addition, studies of nucleotide sequence variation at specific loci reveal an excess of low-frequency within-species polymorphism in this species relative to the neutral expectation (Purugganan and Suddith 1998, 1999). Such excess polymorphism may result from the inefficient elimination of mildly deleterious mutations in small inbreeding populations (Bustamante et al. 2002), but may also be maintained by active balancing selection (Levene 1953; Stahl et al. 1999). Several studies have detected intermediate-frequency nucleotide polymorphism, which is also consistent with heterogeneous selection at specific loci in Arabidopsis (Purugganan and Suddith 1998, 1999; Aguade 2001; Olsen et al. 2002), but reports of present-day selection at these loci under field conditions are lacking. Moreover, genome-wide patterns of natural selection on allelic variation have not been measured directly in natural environments. The genetic tools and ecological information avail-
322
C. Weinig et al.
able for A. thaliana make this species ideal for tests of locus-specific selection in heterogeneous natural environments (Mitchell-Olds 2001). A. thaliana is a largely although not exclusively self-fertilizing colonizing annual species (Jones 1971a; Abbott and Gomes 1989), naturalized over a broad latitudinal and climatic range. Consequently, the genetic structure of this species is likely to be shaped by rare outcrossing events among colonists, followed by generations of self-fertilization to produce recombinant inbred lineages ( Jones 1971b). The recombinant inbred lines (RILs) recently developed for QTL mapping and gene discovery in A. thaliana (Lister and Dean 1993; A. Alonso-Blanco et al. 1998; Wilson et al. 2001) are therefore a realistic approximation to the natural genetic structure of wild populations. RILs are ideal for field studies of selection because they express a wide range of phenotypic variation and because siblings within a line are genetically identical and can be replicated across environments (Mackay 2001). The importance of heterogeneous selection in the wild is also an especially interesting question for A. thaliana because natural populations or “ecotypes” of this widely distributed species experience very different climatic and seasonal environments (Nordborg and Bergelson 1999; Pigliucci and Marlow 2001). In particular, A. thaliana ecotypes differ in germination timing (NappZinn 1985; Munir et al. 2001). Most North American populations have been characterized as winter annuals (Baskin and Baskin 1983; Nordborg and Bergelson 1999), in which all seedlings germinate in fall, overwinter as rosettes, and flower and set seed in the spring. Where winters are mild and summers harsh (i.e., sites at southern latitudes), winter annual life histories are selectively advantageous because plants attain a large size at reproduction. However, some populations at northern latitudes in North America flower and set seed in the fall or germinate, flower, and set seed in the spring (L. A. Dorn, personal observation). These life histories presumably evolve as a result of selection to minimize over-winter mortality. It is therefore important to ask whether the strength or direction of natural selection differs among geographic regions or between spring and fall germination cohorts within populations. In addition, the increasing evidence for epistatic interactions among genes in developmental pathways in A. thaliana (Simpson and Dean 2002) suggests the importance of testing whether selection on natural allelic variation depends upon the genetic background. Terminal flower 1 (TFL1), a critical gene in the developmental pathway to flowering in A. thaliana, is a strong a priori candidate for heterogeneous selection under field conditions because it displays striking evidence of balancing selection at the nucleotide level. HudsonKreitman-Aguade´ tests of selection demonstrate that the TFL1 promoter/5⬘ untranslated region (UTR) and coding regions have been subject to differing selective forces (Olsen et al. 2002). The polymorphisms in the
TFL1 promoter/5⬘ UTR define two distinct classes of alleles (haplogroups), distinguished by 20 nucleotide and 10 insertion/deletion polymorphisms, and present at equal frequency in the 14 sampled A. thaliana ecotypes (Olsen et al. 2002). The presence of these two haplogroups results in a distribution of segregating sites that differ significantly from expectations of the neutral model of molecular evolution with low recombination (Olsen et al. 2002). Moreover, the allelic polymorphism at TFL1 is unique in that it is restricted solely to the promoter/5⬘ UTR sequence. To the 5⬘ side of this region, there is no evidence for significant haplogroup differentiation at the proximal rps28 gene (M. D. Purugganan, unpublished data). To the 3⬘ side, the haplogroup dimorphism does not extend to the adjacent coding region, which has very low levels of nucleotide variation apparently associated with a recent selective sweep (M. D. Purugganan, unpublished data). The localization of allelic polymorphism to the TFL1 promoter region is consistent with the action of balancing selection in this region. Here we report evidence for heterogeneous selection on quantitative trait loci (QTL) in A. thaliana under natural field conditions. We show that selection acts on different loci in different natural environments and that alternative alleles are favored in different ecological settings and genetic backgrounds. Moreover, although there is no evidence for a significant main effect of TFL1 on fitness, the fitness effects of the marker locus nearest TFL1 reverse, depending on variation elsewhere in the genome. This result suggests the interesting hypothesis that variation at TFL1 is maintained by epistatic selection. MATERIALS AND METHODS Mapping population and experimental field settings: To map quantitative trait loci for fitness components, we used recombinant inbred lines of Arabidopsis thaliana (L.) Heynh. (Brassicaceae) developed from a cross between the Landsberg erecta (Ler) ⫻ Columbia (Col) accessions and advanced through single-seed descent to the F8 (Lister and Dean 1993). Because siblings within a line are genetically uniform, we were able to compare QTL expression in the same set of genotypes across experimental field plantings. Seedlings of each RIL were planted in field sites in fall 1999 and spring 2000 in both Rhode Island and North Carolina to simulate natural fall and spring germination cohorts. For all plantings, seeds of the 98 RILs were initially sown into randomly assigned cells in each of 30 98-celled flats and cold stratified for 4 days (fall plantings) or 14 days (spring plantings). Following cold stratification, seeds were germinated in the greenhouses of Brown University and North Carolina State University (NCSU). Germination began within a few days of placing germination trays in the greenhouse, and the stratification treatment effectively stimulated synchronous germination (i.e., seedlings germinated within 3–4 days of one another). Slight variation was observed among RILs in the number of emerging seedlings, but all RILs had ⬎20 replicate plants. After 2–3 weeks in the greenhouse, seedlings were transplanted in the order of sowing into 30 randomized blocks (each corresponding to a 98-cell flat) in prepared field plots
QTL Under Directional and Epistatic Selection at Brown’s Haffenreffer grant, Bristol, Rhode Island (latitude 40⬚N 41⬘W) and NCSU’s Clayton agricultural test field, Clayton, North Carolina (latitude 35⬚N 46⬘W). For the Rhode Island fall germination cohort, seeds were sown in flats October 13–15, 1999 and transplanted November 4–6 into plowed field blocks at Haffenreffer. Seedlings were spaced at 10-cm intervals to prevent competitive interactions. The spring germination cohort was sown between March 3 and 5, 2000 and transplanted into the field between April 5 and 7. In North Carolina, the fall germination cohort was sown between October 27 and 29 and transplanted to the field between November 16 and 18. The spring germination cohort was sown between February 8 and 10 and transplanted between March 7 and 9. Blocks for the fall and spring plantings were arranged in a checkerboard array in each site, such that neighboring blocks alternated cohorts. All plants were harvested at senescence and scored for fruit number. A subset of blocks was used in North Carolina due to the large number of fruits to be counted on plants in the fall germination cohort and the high mortality resulting from transplant shock of plants in some blocks of the spring cohort; totals of 14 and 16 blocks were used for the fall and spring germination cohorts, respectively. Estimates of selection: We estimated three fitness components: over-winter survivorship, spring survivorship, and spring fruit production. Both fall and spring survivorship were estimated as the proportion of replicates within a genotype that survived to reproduction (i.e., differentiation of a flowering inflorescence). In A. thaliana, fruit production is highly correlated with seed production and is thus a good estimate of fecundity in this largely self-fertilizing species (Westerman and Lawrence 1970; Mauricio et al. 1997). These three selection episodes determine the number of seeds produced by a genotype and therefore its genetic representation in successive generations. We could thus screen genome-wide for loci experiencing selection in different natural environments. Moreover, Columbia and Landsberg ecotypes differ in their TFL1 promoter haplotype (Olsen et al. 2002), providing the opportunity to test for evidence of heterogeneous selection at the adjacent marker, pAtT80, segregating in the Col ⫻ Ler RILs. Analysis of variance for components of fitness: Randomeffects ANOVA was used to partition variance for a given fitness component into sources originating from line (L ) and error according to the model, y ⫽ ⫹ L ⫹ error, where is the overall mean. The mixed model, y ⫽ ⫹ L ⫹ Se ⫹ Si ⫹ L ⫻ Se ⫹ L ⫻ Si ⫹ Se ⫻ Si ⫹ L ⫻ Se ⫻ Si ⫹ error, was used to account for variation attributable to environment, where Se is the seasonal growth environment (fall or spring), Si is the geographic site (Rhode Island or North Carolina), and both Se and Si are treated as fixed effects. The significance of these variance components was tested using Proc Catmod and GLM (SAS 1999) for survivorship and fruit number, respectively. Proc Catmod is more suited than Proc GLM to analyses of binomial data and was used to test the significance of the line ⫻ season and line ⫻ site interactions for survivorship in two separate models. However, Catmod could not calculate the chi-square test statistic for the two- and threeway interactions in analyses including the Rhode Island spring cohort, presumably due to the absence of line variation (see results below) in this cohort and resulting low cell counts. Because ANOVA is typically robust to the assumption of normality, Proc GLM was used to determine the significance of the three-way interaction for survivorship. The GLM results were entirely consistent with the results of the two-way analyses performed by Proc Catmod; GLM results are presented so that the same statistical tests are used in one-way and higherorder ANOVA. We calculated across-season correlations (rGE) from the components of variance as cov12/公(VL1 ⫻ VL2), where cov12 repre-
323
sents the covariance of fecundity or survivorship across the two seasonal environments and VL1 and VL2 are the amongline variance components within each of the two environments (Robertson 1959). Significant correlations across the fall and spring seasonal environments within each geographic region are of particular relevance, because genetic similarity of fitness components across seasonal cohorts could constrain adaptive evolution within each environment. Results from the two-way ANOVA including line and season as main effects are used to determine whether estimates of rGE differ significantly from zero or unity: across-season genetic correlations are significantly different from 1 if the L ⫻ Se interaction terms are significant and are significantly different from 0 if the amongline variance is significant in the same analysis. Linkage map construction: Although a large number of polymorphic marker loci have been identified in the Ler ⫻ Col RI lines, not all RILs have been genotyped at all loci. A subset of marker loci (n ⫽ 225) was therefore used to construct the linkage map. Markers genotyped in 80% or more of the lines were selected to provide even coverage of the genome. Genotypic data for these lines are publicly available from the Nottingham Arabidopsis Stock Centre and were downloaded from the website, http:/nasc.nott.ac.uk/. Maps were constructed using Mapmaker/Exp 3.0 (Lander et al. 1997); exact methods are described in greater detail elsewhere (Ungerer et al. 2002). QTL mapping of fitness components: RIL means for fruit production were nonnormally distributed in all experimental cohorts. We therefore square-root transformed the phenotypic values for individual replicates and mapped the RIL means of the transformed data. We used composite interval mapping (Zeng 1994) as implemented by QTL Cartographer software (Basten et al. 1994, 1999) to test for the presence of significant QTL. This procedure tests for a QTL between two adjacent markers while statistically controlling for the effects of additional QTL segregating outside the test interval. Controls for variation at other QTL (i.e., cofactors) were initially selected using forward-backward stepwise regression. The likelihoodratio (LR) test statistic evaluates the hypothesis of a significant QTL in the test interval. Within each experimental environment, the significance threshold of the LR for a QTL was determined through permutation analyses (Doerge and Churchill 1996). Additive effects of a given QTL were estimated as the difference between the two homozygous classes divided by two. QTL-by-environment interactions were tested using analysis of variance (Fry et al. 1998). The ANOVA model included season and marker loci nearest all QTL that were significant in the genome-wide screen. When all possible two-way interactions are tested, ANOVA effectively corrects for potential type I error resulting from multiple tests. Maximum-likelihood techniques are also available to test for QTL-by-environment interactions, but these analyses were inappropriate for our data, due to the large number of cofactors present within each environment for a given fitness component. We also used ANOVA to test for epistatic selection, including the marker loci nearest all significant fitness QTL from the composite interval mapping (CIM) analyses as main effects and all pairwise interactions among those markers. In the same model, we included pAtT80, the marker closest to TFL1, in the ANOVA model as an a priori candidate for epistatic selection on the basis of the strong molecular signature of balancing selection at this locus. Change in allele frequency resulting from selection at a given QTL: Selection coefficients were calculated from the relative fitness of different allelic classes at a QTL, such that w22 ⫽ 1 ⫺ s, where w22 is the ratio of the allelic class with lower relative to higher fitness (Hedrick 1985; Hartl and Clark 1989). The change in allele frequency across generations was then calculated from the haploid model, ⫺sq(1 ⫺ q )/(1 ⫺
324
C. Weinig et al. TABLE 1
TABLE 2
Restricted maximum-likelihood estimates of the among-line variance component, VLINE, for each fitness estimate in each environment and the associated P value
Three-way ANOVA for survivorship and fecundity
Source Environment
VLine
Verror
P value
d.f.
Mean square
Variance P value component
Survivorship
Rhode Island—fall survival 0.002 0.179 0.0319 Rhode Island—spring survival ⬍0.001 0.035 0.3678 North Carolina—fall survival 0.005 0.193 0.0002 North Carolina—spring survival 0.001 0.155 0.0074 Rhode Island—fall fecundity 0.620 14.774 ⬍0.0001 Rhode Island—spring fecundity 0.749 15.711 ⬍0.0001 North Carolina—fall fecundity 8.293 153.008 0.0170 North Carolina—spring fecundity 0.603 10.312 0.0006
Line 97 0.2251 0.8380 Season 1 42.0234 ⬍0.0001 Site 1 21.1876 ⬍0.0001 Line ⫻ season 97 0.1741 0.4646 Line ⫻ site 97 0.2676 0.0143 Season ⫻ site 1 10.9784 ⬍0.0001 Line ⫻ season ⫻ site 97 0.1710 0.0488 Error 9092 0.1367
sq), where q is the frequency of the allele with lower relative fitness and s is the selection coefficient (Hedrick 1985).
Line 97 110.80 0.4598 Season 1 25,244.00 ⬍0.0001 Site 1 1,394.89 0.0002 Line ⫻ season 97 96.10 0.3153 Line ⫻ site 97 97.96 0.2826 Season ⫻ site 1 88,304.00 ⬍0.0001 Line ⫻ season ⫻ site 97 87.13 ⬍0.0001 Error 5931 43.37
⬍0.0001 — — ⬍0.0001 0.0014 0.0039 0.0007 0.1371
Fecundity
RESULTS AND DISCUSSION
Genetic variation in the expression of fitness components across natural seasonal environments: We examined variation in the expression of fitness (i.e., survival to reproduction and fruit production) in 98 RILs grown in two seasonal environments (fall and spring) within each of two geographic regions (Rhode Island and North Carolina). RILs within cohorts differed significantly in over-winter mortality, which ranged from 8 to 48% in Rhode Island on average within an RIL and from 7 to 57% in North Carolina (apparently due to an atypical
0.0986 — — 0.2701 0.4195 80.3577 0.4677 44.3242
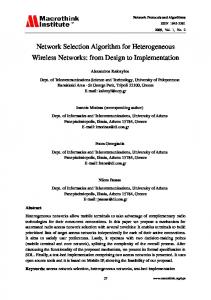
December snowstorm; Table 1). RILs also differed significantly in prereproductive mortality of the spring cohort in North Carolina, which ranged from 5 to 70% of seedlings per RIL due to hot spring temperatures that reached 27⬚–28⬚ shortly after planting. In contrast, prereproductive mortality was only 3% and did not difFigure 1.—QTL for fitness components (survival to reproduction and fecundity) in natural seasonal environments and geographic regions experienced by A. thaliana. All QTL displayed significant QTL ⫻ environment interactions (P ⬍ 0.05), with the exception of the North Carolina QTL at CATTS039 and KG31 for spring survivorship and the Rhode Island fall QTL for over-winter survivorship (P ⬎ 0.10). Because these traits determine genetic representation in successive generations, season- and site-specific effects indicate that selection on individual QTL varies across environments. Circles on linkage groups denote the position of markers. Symbols beside linkage groups indicate the position of QTL peaks in centimorgans, while lines to either side of the QTL symbols show the 2-LOD support limits.
QTL Under Directional and Epistatic Selection
325
TABLE 3 Significant QTL for fecundity and survivorship
Trait RI fall over-winter survivorship RI fall fecundity RI spring fecundity
NC fall over-winter survivorship NC spring survivorship NC spring fecundity
Chrom.a 4 5 1 1 1 4 5 5 5 5 1 5 1 1 5 2
QTL map position (cM) (nearest marker) 33.83 4.32 26.27 42.93 78.80 45.98 51.37 95.34 116.57 139.72 129.42 137.33 20.64 54.33 21.20 38.99
(m518a) (o5629) (mi113) (g17286) (mi208) (g4564a) (mi219) (mi61) (h2a1) (g2368) (agp64) (g2368) (cds7) (CATTS039) (KG31) (O802F )
cM range of the 2-LOD support limit
Likelihood ratiob
Additive effect/c
[r 2]
Change in frequency d
Selection coefficient
33.51–39.51 0.01–12.32 16.21–33.95 0.01–12.32 78.73–83.09 43.83–52.33 44.38–49.17 85.46–124.08 106.48–123.98 124.94–144.08 122.12–140.22 131.72–148.27 14.93–30.95 49.98–58.74 18.68–26.12 32.35–49.77
14.4 16.1 21.9 21.2 14.5 32.8 15.4 15.1 22.4 20.3 24.8 20.9 14.4 21.7 29.9 14.2
0.41 0.35 0.41 0.38 0.40 0.44 ⫺0.33 0.27 0.34 0.32 ⫺0.40 ⫺0.43 ⫺0.39 0.47 ⫺0.48 0.38
0.10 0.10 0.14 0.14 0.08 0.19 0.08 0.07 0.10 0.09 0.15 0.12 0.08 0.14 0.20 0.12
0.019 0.021 0.014 0.014 0.003 0.008 0.004 0.007 0.009 0.008 0.027 0.011 0.004 0.010 0.015 0.011
0.041 0.042 0.055 0.054 0.012 0.032 0.015 0.026 0.037 0.031 0.039 0.023 0.007 0.020 0.032 0.049
RI, Rhode Island; NC, North Carolina. a Chromosomal location (linkage group) of a given QTL. b The significance threshold for an experiment-wide error rate of ␣ ⫽ 0.05 was ⬍14.2 for all traits. c Signs refer to the additive effect of the allele from Col relative to Ler parent; i.e., a positive value indicates an increase in the average trait value among plants possessing the Col allele at a focal QTL. d Because selection distinguishes among phenotypes, we calculated the change in allele frequency at a single QTL without controlling for the effects of QTL segregating elsewhere in the genome. As a result, the change in allele frequency at a specific QTL does not necessarily reflect the variance explained by that QTL.
fer among lines in the Rhode Island spring seasonal cohort (Table 1). In both Rhode Island and North Carolina, plants in the fall cohort that survived the winter flowered and senesced earlier in the spring season than did those in the spring cohort, suggesting that physiological factors rather than environmental severity imposed a limit on lifespan. Fruit production varied significantly among RILs in all cohorts, with genotypic means ranging from 11 to 115 fruit in Rhode Island fall, 76 to 242 fruit in Rhode Island spring, 75 to 1428 fruit in North Carolina fall, and 3 to 63 fruit in North Carolina spring cohorts (Table 1). Thus, strong natural selection acted on the genetic variation present in these lines for all three fitness components. Patterns of natural selection differed substantially between sites and seasonal cohorts. The relative fitness of individual RILs differed significantly across sites and seasons, as indicated by significant line ⫻ site ⫻ season interactions for both survivorship and fecundity (Table 2). Acrossseason genetic correlations were fairly small, as follows: rGE ⫽ 0.46 (line P ⫽ 0.02, line ⫻ season P ⫽ 0.03 from two-way ANOVA) for fruit number in Rhode Island and rGE ⫽ 0.37 (line P ⫽ 0.31, line ⫻ season P ⬍ 0.0036) in North Carolina. For survivorship, rGE ⫽ 0.27 (line P ⫽ 0.18, line ⫻ season P ⫽ 0.03) in Rhode Island and rGE ⫽ 0.20 (line P ⫽ 0.02, Line ⫻ season P ⫽ 0.05) in North Carolina. Genetic correlations across seasons were significantly ⬍1 in both sites and not significantly different
from zero for fruit number in North Carolina and survivorship in Rhode Island. Heterogeneous natural selection across seasons and geographic regions: CIM analyses detected one to six QTL with significant effects on fitness for every selection episode except for fruit production by the North Carolina fall cohort (Figure 1, Table 3). PAtT80, the marker closest to the TFL1 promoter polymorphism, had no main effect on fitness in any environment, in contrast with the molecular evidence for balancing selection at this locus. Thus, there was no evidence that geographical or seasonal variation in selection could maintain the observed allelic variation at TFL1. However, consistent with the small across-season genetic correlations and the significant two- and three-way interactions, we observed substantial environmental variation in selection at other QTL. Nearly all of the observed QTL were site and season specific, exhibiting significant QTL ⫻ environment interactions (Figure 1, Table 3). Thus, natural selection acted at different loci in different environments. Selection coefficients were on the order of 0.01–0.06, and the estimated change in allele frequency in one generation resulting from variation among genotypes in survivorship and fecundity ranged from 0.003 to 0.02 at individual QTL (Table 3). Thus, strong directional selection acted at specific loci in each site and season. Heterogeneous natural selection can maintain quantitative genetic variation in the wild if it favors different
326
C. Weinig et al.
Figure 2.—Epistatic interactions for fruit production in the Rhode Island spring cohort between marker loci (A) mi61 and h2a1, (B) g2368 and g4564a, (C) pAtT80 and mi61, and (D) pAtT80 and h2a1 (the marker locus nearest the candidate gene, TFL1). Least-squares means ⫾ 1 standard error are shown. See Table 4 for significance tests of the interactions.
alleles in different environments. We observed such heterogeneous selection for one QTL associated with marker g2368 at the bottom of chromosome 5. At this QTL, the Columbia allele reduces over-winter survivorship in the North Carolina fall cohort, but enhances fecundity in the Rhode Island spring cohort (Table 3). This trade-off between fitness components in different geographic regions may select for locally adapted populations and maintain allelic variation among northern vs. southern ecotypes. Either pleiotropy or physical linkage may account for the antagonistic fitness effects of this QTL. However, either of these genetic mechanisms is sufficient to impose an evolutionary constraint and a performance trade-off in the short term. This geographically heterogeneous selection would maintain variation among ecotypes, the level at which molecular polymorphism is usually assessed in A. thaliana (Purugganan and Suddith 1999; Aguade 2001; Olsen et al. 2002).
However, additional mechanisms are needed to explain the maintenance of the quantitative genetic variation observed within natural populations ( Jones 1971b; Dorn et al. 2000). Seasonal heterogeneity in selection within sites may be one contributing mechanism because temporal variation can slow the rate at which genetic variation is eroded, even if it cannot permanently protect polymorphisms in the haploid case (Felsenstein 1976). Allelic effects did not reverse across seasonal environments for fitness QTL detected within the geographic regions examined here, but most QTL had environment-specific fitness effects. Thus, different loci were exposed to selection in different ecological settings. Such conditional neutrality for fitness can slow the erosion of genetic variation within a population if the population experiences selection in both environments, resulting in higher levels of variation maintained by mutation-
QTL Under Directional and Epistatic Selection
selection balance (Fry et al. 1996). However, most theoretical models examining the effects of environmental heterogeneity on the maintenance of genetic variation assume a diploid, randomly mating population. Bearing in mind that the population genetics of A. thaliana violate model assumptions, natural populations of Arabidopsis with two seasonal germination cohorts do meet the condition of temporally varying selective environments encountered in potentially similar frequency. If seasonally heterogeneous selection contributes to maintenance of quantitative genetic variation, we should expect to find higher levels of standing variation in such populations than in natural populations with a fixed winter annual life history. Epistatic selection and the maintenance of genetic variation within populations: Genetic variation may also be maintained within natural Arabidopsis populations by epistatic interactions among loci. Just as selection at specific loci may vary with environment (Fry et al. 1998; Leips and Mackay 2000) or between sexes (Vieira et al. 2000; Mazer 2002), fitness effects of specific alleles may vary with genetic background. When genetic backgrounds are mixed by migration among populations, epistasis for fitness can constrain fixation of allelic variants at specific loci, resulting in higher levels of standing variation (Wade 2001). Our experiment revealed epistatic selection as a significant interaction between several QTL at markers h2a1, mi61, g4564a, and g2368 (Figure 2, A and B, Table 4) for fruit production in the Rhode Island spring cohort. Of particular interest, the Landsberg allele at marker mi61 reversed in effect with genetic background, conferring higher fitness than the Columbia allele in the Columbia h2a1 background, but lower fitness than the Columbia allele in the Landsberg h2a1 background (Figure 2A). The advantage of the repulsion phase distinguishes these loci as independently significant QTL, despite the overlap of their confidence intervals. We also observed significant epistatic selection in the vicinity of TFL1. The closest marker, pAtT80, displayed significant epistatic interactions with both mi61 and h2a1 for spring fruit production in Rhode Island (Table 4), reversing in allelic effect depending upon the genotype at each of these loci (Figure 2, C and D). This fitness reversal with genetic background explains our inability to detect a QTL for fitness in the region of pAtT80 in our initial analysis using exclusively additive genetic models and indicates that strong selection is nevertheless acting near this marker. The observation that the direction of selection at a QTL closely linked to TFL1 reverses with genetic background suggests the interesting hypothesis that epistatic selection may help to maintain the observed nonneutral polymorphism in the promoter of this gene. This hypothesis deserves further investigation for TFL1 as well as other important developmental genes. Evolutionary and molecular genetics of A. thaliana: This study illustrates the power of genetic models such
327 TABLE 4
ANOVA for QTL ⫻ QTL epistasis of fruit production in the Rhode Island spring cohort Effect mi208 g4564a mi219 mi61 h2a1 g2368 PatT80 mi208 ⫻ pAtT80 g4564a ⫻ pAtT80 mi219 ⫻ pAtT80 mi61 ⫻ pAtT80 h2a1 ⫻ pAtT80 g2368 ⫻ pAtT80 mi208 ⫻ g4564a mi208 ⫻ mi219 mi208 ⫻ mi61 mi208 ⫻ h2a1 mi208 ⫻ g2368 g4564a ⫻ mi219 g4564a ⫻ mi61 g4564a ⫻ h2a1 g4564a ⫻ g2368 mi219 ⫻ mi61 mi219 ⫻ h2a1 mi219 ⫻ g2368 mi61 ⫻ h2a1 mi61 ⫻ g2368 h2a1 ⫻ g2368 Error
MS III
F value
P valuea
4.44 6.93 1.43 0.59 2.75 0.34 0.14 0.99 0.15 0.28 5.49 4.20 0.39 0.78 0.87 0.22 0.37 0.99 0.01 0.08 2.67 3.03 0.16 0.29 0.60 4.88 1.73 1.88 0.77
5.76 8.97 1.85 0.76 3.57 0.44 0.19 1.28 0.19 0.37 7.11 5.45 0.50 1.01 1.13 0.28 0.48 1.29 0.01 0.10 3.46 3.93 0.21 0.39 0.78 6.32 2.25 2.43
0.020 0.004 0.179 0.387 0.064 0.511 0.667 0.263 0.665 0.548 0.009 0.023 0.482 0.320 0.292 0.597 0.490 0.261 0.919 0.751 0.068 0.052 0.650 0.536 0.381 0.015 0.139 0.124
a
Significant two-way interactions (underlined) demonstrate the presence of epistasis between loci. d.f. ⫽ 1, 58 for each effect in the table.
as A. thaliana for examining evolutionary mechanisms from the ecological to the molecular level. The observation that selection acts at different QTL across sites and seasons suggests that different natural populations of this colonizing species with similar initial genetic compositions will follow different evolutionary trajectories in response to natural selection. Such heterogeneous selection also suggests that individual traits, not surprisingly, differ in their fitness effects across natural environments; the fitness effects of QTL underlying the expression of life-history and architectural traits in the Rhode Island and North Carolina seasonal environments will be presented elsewhere (C. Weinig and J. Schmitt, unpublished results). Heterogeneous selection may also favor different alleles at the same locus in different sites, thus actively maintaining genetic variation among populations. The observation that alternative alleles are favored in different genetic backgrounds under natural conditions suggests that epistasis may be an additional mechanism for maintenance of genetic variation both among and
328
C. Weinig et al.
within populations. Epistatic interactions among QTL for fitness components (Shook and Johnson 1999; Leips and Mackay 2000) and other important quantitative traits (C. Alonso-Blanco et al. 1998, 1999; Borevitz et al. 2002; Ungerer et al. 2002) have now been observed within several model species, suggesting that they may be relatively common. Epistasis between natural allelic variants at the developmental loci, FRI and FLC, have also been detected (Koornneef et al. 1994; Lee et al. 1994). Such epistatic interactions may have particular evolutionary impact in largely self-fertilizing species such as A. thaliana, in which novel variants may be produced by recombination after rare outcrossing events, and subsequent lineage selection among the inbred descendants of these variants may act upon both additive and epistatic variation (Wright 1931; Goodnight 1995; Wade and Goodnight 1998). The genetic resources and molecular tools available for A. thaliana provide an opportunity to test such hypotheses about evolutionary mechanisms. The authors thank Josh Banta, Anthony Giunta, Marah Gotschik, Kelly Gravuer, and Mason Israel for extensive field help and fruit processing, as well as Marc Tater and David Rand for comments on early manuscript drafts. Comments from two anonymous reviewers significantly improved the clarity and content of this article. The Central Crops Research Station contributed to the maintenance of the field site in Clayton, North Carolina, and we especially appreciate the help of Kathy Haring at the research station in North Carolina and Fred Jackson at the Brown University greenhouse. This research was supported by National Science Foundation grant DEB-9976997 to T.F.C.M., M.D.P., and J.S.
LITERATURE CITED Abbott, R. J., and M. F. Gomes, 1989 Population genetic structure and outcrossing rate of Arabidopsis thaliana (L.) Heynh. Heredity 62: 411–418. Aguade, M., 2001 Nucleotide sequence variation at two genes in the phenylpropanoid pathway, the FAH1 and F3H genes, in Arabidopsis. Mol. Biol. Evol. 18: 1–9. Alonso-Blanco, A., A. J. M. Peeters, M. Koornneef, C. Lister and C. Dean, 1998 Development of an AFLP based linkage map of Ler, Col, and Cvi Arabidopsis thaliana ecotypes and construction of a Ler/Cvi recombinant inbred line population. Plant Journal 14: 259–271. Alonso-Blanco, C., S. E.-D. El-Assal, G. Coupland and M. Koornneef, 1998 Analysis of natural allelic variation at flowering time loci in the Landsberg erecta and Cape Verde Island ecotypes of Arabidopsis thaliana. Genetics 149: 749–764. Alonso-Blanco, C., B. D. Vries, C. J. Hanhart and M. Koornneef, 1999 Natural allelic variation at seed size loci in relation to other life history traits of Arabidopsis thaliana. Proc. Natl. Acad. Sci. USA 96: 4710–4717. Barton, N. H., and M. Turelli, 1989 Evolutionary quantitative genetics: How little do we know? Annu. Rev. Genet. 23: 337–370. Baskin, J. M., and C. C. Baskin, 1983 Seasonal changes in the germination responses of buried seeds of Arabidopsis thaliana and ecological interpretation. Bot. Gaz. 144: 540–543. Basten, C. J., B. S. Weir and Z-B. Zeng, 1994 Zmap—a QTL cartographer, pp. 65–66 in Proceedings of the 5th World Congress on Genetics Applied to Livestock Production: Computing Strategies and Software, edited by C. Smith, J. S. Gavora, B. Benkel, J. Chesnais and W. Fairfull. Organizing Committee, 5th World Congress on Applied Genetics Applied to Livestock Production, Guelph, Ontario, Canada. Basten, C. J., B. S. Weir and Z-B. Zeng, 1999 QTL Cartographer,
Version 1.13. Department of Statistics, North Carolina State University, Raleigh, NC. Borevitz, J. O., J. N. Maloof, J. Lutes, T. Dabi, J. L. Redfern et al., 2002 Quantitative trait loci controlling light and hormone response in two accessions of Arabidopsis thaliana. Genetics 160: 683–696. Bustamante, C., R. Nielsen, S. Sawyer, K. M. Olsen, M. D. Purugganan et al., 2002 The cost of inbreeding in Arabidopsis. Nature 416: 531–534. Doerge, R. W., and G. A. Churchill, 1996 Permutation tests for multiple loci affecting a quantitative character. Genetics 142: 285–294. Dorn, L. A., E. Hammond Pyle and J. Schmitt, 2000 Plasticity to cues and resources in Arabidopsis thaliana : testing for adaptive value and costs. Evolution 54: 1982–1994. Felsenstein, J., 1976 The theoretical population genetics of variable selection and migration. Annu. Rev. Genet. 10: 253–280. Fry, J. D., S. L. Heinsohn and T. F. C. Mackay, 1996 The contribution of new mutations to genotype-environment interactions in Drosophila melanogaster. Evolution 50: 2316–2327. Fry, J. D., S. V. Nuzhdin, E. Pasuykova and T. F. C. Mackay, 1998 QTL mapping of genotype-environment interaction for fitness in Drosophila melanogaster. Genet. Res. 71: 133–141. Gillespie, J. H., and M. Turelli, 1989 Genotype-environment interactions and the maintenance of polygenic variation. Genetics 121: 129–138. Goodnight, C. J., 1995 Epistasis and the increase in additive genetic variance: implications for phase I of Wright’s shifting balance process. Evolution 49: 502–511. Hartl, D. L., and A. G. Clark, 1989 Principle of Population Genetics. Sinauer, Sunderland, MA. Hedrick, P. W., 1985 Genetics of Populations. Jones & Bartlett Publishers, Boston. Houle, D., 1992 Comparing evolvability and variability of quantitative traits. Genetics 130: 535–566. Houle, D., B. Morikawa and M. Lynch, 1996 Comparing mutational variabilities. Genetics 143: 1467–1483. Jones, M. E., 1971a The population genetics of Arabidopsis thaliana. I. The breeding system. Heredity 27: 39–50. Jones, M. E., 1971b The population genetics of Arabidopsis thaliana. II. Population structure. Heredity 27: 51–58. Koornneef, M., H. B.-D. Vries, C. Hanhart, W. Soppe and T. Peeters, 1994 The phenotype of some late-flowering mutants is enhanced by a locus on chromosome 5 that is not effective in the Landsberg erecta phenotype. Plant J. 6: 911–919. Kuittinen, H., A. Mattila and O. Savolainen, 1997 Genetic variation at marker loci and in quantitative traits in natural populations of Arabidopsis thaliana. Heredity 79: 144–152. Lander, E. S., P. Green, J. Abrahamson, A. Barlow, M. J. Daly et al., 1997 Mapmaker: an interactive computer package for constructing primary genetic linakage maps of experimental and natural populations. Genomics 1: 174–181. Lee, I., S. D. Michaels, A. S. Masshardt and R. M. Amasino, 1994 The late-flowering phenotype of FRIGIDA and mutations in LUMINIDEPENDENS is suppressed in the Landsberg erecta strain of Arabidopsis. Plant J. 6: 903–909. Leips, J., and T. F. C. Mackay, 2000 Quantitative trait loci for life span in Drosophila melanogaster : interactions with genetic background and larval density. Genetics 155: 1773–1788. Levene, H., 1953 Genetic equilibrium when more than one ecologial niche is available. Am. Nat. 87: 331–333. Lister, C., and C. Dean, 1993 Recombinant inbred lines for mapping RFLP and phenotypic markers in Arabidopsis thaliana. Plant J. 105: 1203–1208. Mackay, T. F. C., 2001 Quantitative trait loci in Drosophila. Nat. Genet. 2: 11–20. Mackay, T. F. C., R. F. Lyman and W. G. Hill, 1995 Polygenic mutation in Drosophila melanogaster : non-linear divergence among unselected strains. Genetics 139: 849–859. Mauricio, R., M. D. Rausher and D. S. Burdick, 1997 Variation in the defense strategies of plants: Are resistance and tolerance mutually exclusive? Ecology 78: 1301–1311. Mazer, S., 2002 Trade-offs between male and female reproduction associated with allozyme variation in phosphoglucoisomerase in an annual plant (Clarkia unguiculata): (Onagraceae). Evolution 55: 2421–2428.
QTL Under Directional and Epistatic Selection Mitchell-Olds, T., 2001 Arabidopsis thaliana and its wild relatives: a model system for ecology and evolution. Trends Ecol. Evol. 16: 693–700. Mousseau, T. A., and D. A. Roff, 1987 Natural selection and the heritability of fitness components. Genet. Res. 59: 181–198. Munir, J., L. A. Dorn, K. A. Donohue and J. Schmitt, 2001 The effect of maternal photoperiod on seasonal dormancy in Arabidopsis thaliana (Brassicaceae). Am. J. Bot. 88: 1240–1249. Napp-Zinn, K., 1985 Arabidopsis thaliana, pp. 492–503 in CRC Handbook of Flowering, edited by A. H. Halevy. CRC Press, Boca Raton, FL. Nordborg, M., and J. Bergelson, 1999 The effect of seed and rosette cold treatment on germination and flowering time in some Arabidopsis thaliana (Brassicaceae) ecotypes. Am. J. Bot. 86: 470–475. Nuzhdin, S. V., J. D. Fry and T. F. C. Mackay, 1995 Polygenic mutation in Drosophila melanogaster : the causal relationship to bristle number and fitness. Genetics 139: 861–872. Olsen, K. M., A. Womack, A. R. Garret, J. I. Suddith and M. D. Purugganan, 2002 Contrasting evolutionary forces in the Arabidopsis floral developmental pathway. Genetics 160: 1641–1650. Pigliucci, M., and E. T. Marlow, 2001 Differentiation for flowering time and phenotypic integration in Arabidopsis thaliana in response to season length and vernalization. Oecologia 127: 501–508. Prout, T., and O. Savolainen, 1996 Genotype-by-environment interaction is not sufficient to maintain variation: Levene and the leafhopper. Am. Nat. 148: 930–936. Purugganan, M., and J. I. Suddith, 1998 Molecular population genetics of the Arabidopsis CAULIFLOWER regulatory gene: nonneutral evolution and naturally occurring variation floral homeotic function. Proc. Natl. Acad. Sci. USA 95: 8130–8134. Purugganan, M. D., and J. I. Suddith, 1999 Molecular population genetics of floral homeotic loci: departures from the equilibriumneutral model at the APETALA3 and PISTILLATA genes of Arabidopsis thaliana. Genetics 151: 839–848. Robertson, A., 1959 The sampling variance of genetic correlations. Biometrics 15: 469–485.
329
SAS, 1999 SAS/STAT User’s Guide. SAS Institute, Cary, NC. Shook, D. R., and T. E. Johnson, 1999 Quantitative trait loci affecting survival and fertility-related traits in Caenorhabditis elegans show genotype-environment interactions, pleiotropy and epistasis. Genetics 153: 1233–1243. Simpson, G. G., and C. Dean, 2002 Arabidopsis, the rosetta stone of flowering time? Science 296: 285–289. Stahl, E. A., G. Dwyer, R. Mauricio, M. Kreitman and J. Bergelson, 1999 Dynamics of disease resistance polymorphism at the Rpm1 locus of Arabidopsis. Nature 400: 667–671. Ungerer, M. C., S. S. Halldorsdottir, J. L. Modliszewski, T. F. C. Mackay and M. D. Purugganan, 2002 Quantitative trait loci for inflorescence development in Arabidopsis thaliana. Genetics 160: 1133–1151. Vieira, C., E. G. Pasyukova, Z-B. Zeng, J. K. B. Hackett, R. F. Lyman et al., 2000 Genotype-environment interaction for quantitative trait loci affecting lifespan in Drosophila melanogaster. Genetics 154: 213–227. Wade, M. J., 2001 Epistasis, complex traits, and mapping genes. Genetica 112–113: 59–69. Wade, M. J., and C. J. Goodnight, 1998 Perspective: the theories of Fisher and Wright in the context of metapopulations: when nature does many small experiments. Evolution 52: 1537–1553. Westerman, J. M., and M. J. Lawrence, 1970 Genotype-environment interaction and developmental regulation in Arabidopsis thaliana. Heredity 25: 609–627. Wilson, I. W., C. L. Schiff, D. E. Hughes and S. C. Somerville, 2001 Quantitative trait loci analysis of powdery mildew disease resistance in the Arabidopsis thaliana accession kashmir-1. Genetics 158: 1301–1309. Wright, S., 1931 Evolution in Mendelian populations. Genetics 16: 97–159. Zeng, Z-B., 1994 Precision mapping of quantitative trait loci. Genetics 136: 1457–1468. Communicating editor: O. Savolainen