BARI LAYOUT
1/4/07
1:17 PM
Page 34
Automated Network Selection in a Heterogeneous Wireless Network Environment Farooq Bari and Victor C. M. Leung, The University of British Columbia Abstract Service delivery in a heterogeneous all-IP wireless network environment requires the selection of an optimal access network. Selection of a non-optimal network can result in undesirable effects such as higher costs or poor service experience. Network selection in such an environment is influenced by several factors, and currently a complete solution is not available to solve this problem. This article describes a comprehensive decision making process to rank candidate networks for service delivery to the terminal. The proposed mechanism is based on a unique decision process that uses compensatory and non-compensatory multi-attribute decision making algorithms jointly to assist the terminal in selecting the top candidate network.
T
he desire to increase service availability is driving the use of multimode terminals and the interconnection of different wireless access technologies that support IP transport. An essential aspect of service delivery in a heterogeneous all-IP wireless network environment is the selection of an optimal access network. Network selection in such an environment is influenced by several factors, and currently there is no comprehensive solution available to solve this problem. Selection of a non-optimal network can result in undesirable effects such as higher costs or poor service experience. A system architecture for a terminal-based approach that uses network assistance for network selection has been proposed in [1] by the authors. An overview of this approach is provided. This article describes an extensive decision making process that can be used by the network to provide candidate networks for service delivery to the terminal. The proposed mechanism is based on a unique decision process that uses non-compensatory and compensatory multiattribute decision making (MADM) algorithms jointly on the network side to assist the terminal to select the top candidate network(s). Along with disjunctive and conjunctive type of non-compensatory MADMs, the article describes the use of TOPSIS, a compensatory MADM algorithm. It identifies various factors that would influence the selection of an optimal network and therefore should be used as inputs to the MADM-based decision process. It explores different aspects of the problem space and proposes solutions based on the MADM mechanism. The steps involved in use of a non-compensatory MADM algorithm are simple. They remove network alternatives from the candidate list that are not suited for the scenario. This process is completed before a compensatory MADM algorithm can be used to provide network ranking. The compensatory MADM part of the proposed mechanism is more sophisticated with tunable parameters. It has therefore been validated in the article by applying it to different use scenarios; scenarios with different service and subscribed quality of service (QoS) profiles have been simulated to observe how the proposed mechanism would work.
34
0890-8044/07/$20.00 © 2007 IEEE
Application of the proposed mechanism to networks with multiple levels of service-level agreements (SLAs) or multiple classes of QoS is described. Possible approaches to network selection when another service is already in use by the terminal are presented within the proposed framework.
Background and Related Work The problem of network selection across heterogeneous wireless networks has recently received much attention because of a drive for converged communication systems. In this context, [2] has proposed the combined application of two mathematical techniques in an algorithm for network selection between Universal Mobile Telecommunications System (UMTS) and wireless local area networks (WLANs), where analytic hierarchy process and Grey system theory are used to evaluate the user’s preferences and service requirements, and combine the priority settings of the QoS attributes with the performances of the network alternatives to make a network selection decision. A dynamic system to select the network for service delivery based on current market conditions such as QoS and cost attributes has been described in [3]. Using the proposed framework, the user can select the delivery network per call. Network selection based on resource allocation strategy for most efficient resource utilization in a heterogeneous network environment has been proposed in [4]. A fuzzy-logic-based multiple-criteria decision making system to perform access network selection in a heterogeneous network environment is described in [5]. A simple policy-enabled handoff system across heterogeneous wireless networks is presented in [6], which allows users to express policies on what is the best wireless system at any moment, and make trade-offs among network characteristics and dynamics such as cost, performance, and power consumption. The mechanisms described in [2–6] have significant shortcomings. The factors considered in the decision process are insufficient; for example, information about access types supported, authentication types supported, and roaming partners supported are not considered in the decision process
IEEE Network • January/February 2007
BARI LAYOUT
1/4/07
1:17 PM
Page 35
Network selection request received from the user terminal
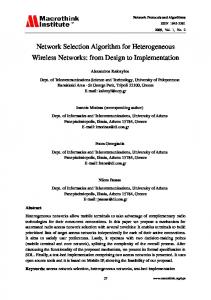
described in these papers. They also do not provide Retrieve relevant information from network or refer to a viable architectural framework in which entities for use in the decision making the selection mechanism can work. The use case scenarios described are limited and not realistic from the perspective of deployment or the business models Narrow the list of candidate networks by using non-compensatory used in the industry. As a result, they do not provide MADM algorithm with attirbutes in category 1 of Table 1 (the access complete and deployable solutions to the problem. network types, user credentials supported, services requested, etc.) The decision about network selection in a heterogeneous wireless environment is dependent on several Further refine the list of candidate networks using factors. The network selection problem can be solved compensatory MADM algorithm with attributes in using MADM algorithms. MADM has been an active category 2 of Table 1 (e.g., QoS related parameters) area of research since the 1970s. Because of their deterministic nature and easy implementation, MADM algorithms have found applications in a wide Provide the candidate network variety of problems, from social sciences to operations related information to the terminal research. They can be used in combination with fuzzy logic where input attributes values are not clearly ■ Figure 1. The decision making process in network selection. defined. Another interesting use of these algorithms involves game theory where players manipulate input values to influence decision making by MADM algorithms. Among the most widely discussed MADM mechanisms mal network for the requested service and can be changed once are Elimination and Choice Translating Priority (ELECTRE) sufficient information has been collected to make a decision. [7], Technique for Order Preference by Similarity to Ideal Using the information collected from DCN, SAN, and AAA Solution (TOPSIS) [8], Analytic Hierarchy Process (AHP) [8, nodes, and that provided by the terminal, the network calculates 9], Grey Relational Analysis (GRA) [10], Weighed Sum Model the rankings of the available access networks and provides them (WSM) [8], and Weighed Product Model (WPM) [8]. to the terminal. The remainder of this article describes a compreThe mechanism described in [2] also utilized an MADM hensive algorithmic approach to be used by the network-based approach for network selection, but with only a limited numassessment entity in the proposed architectural framework. ber of parameters and without an architectural framework. We formulate the network selection decision process in a Factors such as the roaming agreements of the user’s home heterogeneous network environment as an MADM problem network, the authentication methods supported, and the type that deals with the evaluation of a set of alternatives using a of mobility of the user were not taken into consideration. Sceset of attributes. The alternatives represent different choices. narios where the access network can support multiple levels of The decision process ranks these alternatives in order of prefQoS or the user is already using a network for an earlier seserence using the set of attributes that provide different sion were not addressed. Moreover, issues of sensitivity of the aspects by which the alternatives can be viewed. selection process to input data were not explored. The soluThe decision about network selection is dependent on sevtion presented in this article is based on the architectural eral factors. In general, the factors or attributes impacting framework described in [1] that supports business models network selection can be divided into the following categories: (e.g., roaming agreements) used in the industry. It identifies • Category 1 attributes include parameters that are not QoSkey parameters for use in the network selection process, prorelated. These parameters do not change very often and poses a comprehensive network selection mechanism using therefore can usually be provisioned in the network. these parameters as inputs, and then validates the proposed • Category 2 includes mostly QoS-related attributes, both mechanism by analyzing it under different scenarios. dynamic ones as well as largely static ones that can be provisioned. Table 1 lists the attributes that are taken into consideration Decision Process in Network Selection for network selection using the algorithm proposed in this article and classifies them into the above two categories. In the network assisted mechanism proposed in [1], the network assists the terminal in the selection process by performing data collection and analysis to provide the network Multi-Attribute Decision Making ranking. The architecture proposes the use of three networkbased functional entities: The proposed decision process for network selection can be • Data collection node (DCN) for retrieving network characdescribed by the steps shown in Fig. 1. The process shown teristics employs both non-compensatory and compensatory MADM • Service announcement node (SAN) for providing servicesalgorithms, which are described in more detail below. related data Non-Compensatory MADM Algorithms • Authentication, authorization, and accounting (AAA) node for AAA information In this class of MADM algorithms, advantages of one type of Together they provide input data to a network-based assessment attribute value cannot be traded for disadvantages of another entity that calculates network rankings for use by the terminal in attribute value. This class of methods includes dominance, network selection. In addition, the terminal provides its location conjunctive, disjunctive, and sequential elimination (e.g., lexiand any other information that could be considered by the netcographic, elimination by aspects). Of particular interest for work in the analysis (service/QoS being requested, scans of the network selection are conjunctive and disjunctive methods. PLMN IDs, SSIDs, etc.). The process starts with the terminal These two methods are not used to select a particular alternatrying to get network connectivity with whichever network it can tive but to separate the given alternatives into acceptable and (with or without authentication). This initial network access is unacceptable groups. All alternatives are considered acceptsimilar to getting directory assistance over today’s circuitable as long as they satisfy the minimum cutoff criteria. In the switched voice network. The initial network may not be the opticase of a conjunctive method, the acceptable alternative has
IEEE Network • January/February 2007
35
BARI LAYOUT
1/4/07
1:17 PM
Page 36
Attribute
Abbrev
Brief explanation
Category
Operator name
ON
This attribute indicates the identity of the operator (e.g., roaming partner SSID or PLMN ID) for which the rest of the information is being provided.
1
Authentication mechanism
AM
This attribute indicates the authentication mechanism used by the roaming partner. Examples could be SIM or user ID/password.
1
Access technology
AT
This attribute indicates the wireless access technology the AN uses (e.g., UMTS, WiMAX, WLAN). More specifics about the technology, such as frequency of operation, may also be included.
1
Services available
SA
This attribute provides a list of supported service (3GPP services such as PSS, IMS based VoIP, etc.).
1
Geographic location
GL
This attribute provides information on the geographic location of, say, the base station.
1
Coverage area
CA
This attribute provides a measure of the coverage area, for example, hotspot physical address. Due to propagation conditions, wireless coverage area can be irregular. Other attributes such as transmit signal power could be more useful in many instances.
1
Cost per byte
CB
This attribute indicates relative transport cost of the operator for a particular access network. It would take into account factors such as use of licensed/unlicensed spectrum and roaming agreement.
2
Total bandwidth
TB
This attribute indicates how much bandwidth is available overall on the wireless access link.
2
Allowed bandwidth
AB
This attribute indicates the bandwidth allowed by the AN on a per user basis.
2
Utilization
U
This attribute provides a measure of current utilization of the wireless link.
2
Packet delay
D
This attribute gives the average packet delay within the access system. This is not the end-to-end delay.
2
Packet jitter
J
This attribute measures the average delay variations within the access system. A large jitter could result in packet reordering or dropping of real-time packets at the receiver.
2
Packet loss
L
This attribute measures the average packet loss rate within the access system.
2
■ Table 1. Attributes for use in network selection.
to meet the minimum cutoff for all the attributes under consideration. For the disjunctive method, an alternative is acceptable if one or more of the attributes meet or exceed the cutoff value for the attributes under consideration. The two methods can be used together in decision making processes. In the case of network selection, the attributes listed in category 1 of Table 1 will be used as input to the conjunctive and disjunctive decision process in order to categorize the available networks into acceptable and unacceptable alternatives for service delivery. Using the attributes from category 1, the criteria for an acceptable network that should be further explored for suitability would be that: • It supports at least one of the authentication mechanisms supported by the user/terminal. • It supports the access technology supported by the user/terminal. • It provides access to the service the user is requesting. • It is available in the geographic location of the user. • It provides the coverage level that might have been indicated by the user’s mobility profile. The “and” relationship in the decision process between each of the attributes is an application of conjunctive MADM. The disjunctive MADM algorithm is applied to account for the fact that for many of these attributes, there are more than
36
one alternative values, and for the network to be acceptable it needs to support only one of these values. Decreasing Inter-Technology Handoffs — Since the network capabilities as well as the associated transport costs vary across different access technologies, it could be a preferred policy to initially select the network with an aim to decrease or avoid if possible inter-technology handoffs during an active session. Use of a non-compensatory MADM algorithm in the decision process can help decrease inter-technology handoffs. The user mobility profile can indicate the expected type of user mobility during a session. It is possible to have the user/terminal provide its mobility profile in step 1 of Fig. 1 that will be used in the non-compensatory MADM part of the decision process along with coverage area information about the network. The user can set his/her profile to be “mobile” or “nomadic,” and the non-compensatory part of the MADMbased network selection algorithm can decide to pick only wide-area cellular networks or wireless local area networks.
Compensatory MADM Algorithms A compensatory MADM algorithm involves the following steps:
IEEE Network • January/February 2007
BARI LAYOUT
1/4/07
1:17 PM
Page 37
• Identify all alternatives and compensatory MADM attributes impacting the decision process. • Assign relative importance in the decision making process to each of the attributes. • Use a compensatory MADM algorithm to get a ranking of the alternatives. Now we consider a general case where the selection has been narrowed down using the non-competitive MADM algorithm to N access networks as shown in Fig. 1. In order to apply a compensatory MADM algorithm to facilitate network selection, we consider attributes in category 2 of Table 1. Candidate network i, NWi, from a decision making perspective can be represented as follows: NWi = [CBi, TBi, ABi, Ui, Di, Ji, Li]. We can represent the N networks to be considered in the selection process in the form of a matrix as follows: CB1 CB2 . NW = . . CBN
TB1 TB2 . . . TBN
AB1 AB2 . . . ABN
U1 U2 . . . UN
D1 D2 . . . DN
J1 J2 . . . JN
L1 L2 . . . . LN
The following section describes the use of TOPSIS, a compensatory MADM algorithm to objectively decide on the best suited solution. Technique for Order Preference by Similarity to Ideal Solution — The TOPSIS algorithm is based on the assumption that the chosen solution has the shortest distance from the best solution but the longest distance from the worst solution. The following steps are involved in the application of TOPSIS to the network selection problem. • The value for each of the attribute in matrix NW is normalized. • The relative importance of each of the attributes involved in the decision about network selection is determined, and the normalized values are adjusted accordingly. • The best and worst values for each of the attribute are determined. Depending on the attribute, the best (or worst) value can be either the maximum or the minimum value. For example, in the case of the network utilization attribute, the best value will be the lowest and the worst value the highest. For the case of an attribute related to the allowed bandwidth, however, the best value will be the highest and the worst value the lowest. • For each access network under consideration, the measures of closeness/separation S, for the best and worst cases, are calculated using Euclidean distances. • For each of the access networks under consideration (represented by a row in matrix NW), its level of preference P is based on the relative closeness to the best and separation from the worst solutions. The preference value P as shown below represents a hyperbolic curve known as an indifference curve. The term indifference curve means that a decision maker would give equal preference to any of the alternatives on the same indifference curve (i.e., with the same value of P). SWORST P= SBEST + SWORST • The access network with the highest P value is selected. The computational complexity involved in calculating Euclidean distances used in TOPSIS is minimal. Therefore the computational time and the resources needed for it should not be
IEEE Network • January/February 2007
significant. Besides, in the architectural framework defined in [1], data collection as well as the analysis involving MADM is performed in the network with only the network rankings conveyed to the terminal over the wireless link. This approach is resource efficient from the wireless bandwidth utilization perspective. Assignment of Attribute Weights — The assignment of weights to different parameters in a compensatory MADM algorithm plays a key role in network selection. It is proposed that the assignment of these weights is based on the interpretation of the requested service/application requirements or the subscribed user profile by the subscriber’s home network operator. The two possible QoS profile types that can be stored in user’s home network are thus as follows: • Overall user QoS profile applicable to all of the services the user is using; for example, Gold, Silver, or Bronze profile can indicate the level of QoS the user is expected to have based on the subscription. • QoS profile of an individual service that is applicable to all subscribers of that service (e.g., VoIP service profile or Web browsing profile). The relative importance of different attributes for common types of services/applications or user subscription is described below. VoIP — This is a low-bandwidth application that is very sensitive to delay and jitter but can withstand some packet loss. Transport cost factor is considered negligible because of low bandwidth usage. Also because of low bandwidth requirements, total and available bandwidth are not issues. Since there is some correlation of utilization with jitter and delay, it is preferred to have low utilization for the selected network. Streaming — Being a multimedia service, a streaming application requires a higher bandwidth than VoIP. Therefore, available bandwidth, transport cost, and current utilization are important factors. It is less vulnerable to delay and jitter than VoIP because of the ability to buffer longer duration of data before playback. Sensitivity to packet loss is similar to VoIP. Web Browsing — A Web browsing application is a low QoS service; the importance of utilization, delay, jitter, and packet loss is low. It does not need a guaranteed bit rate because of the spiky nature of Web traffic patterns. With statistical traffic multiplexing for such traffic, broadband wireless networks can deliver a reasonable customer experience even at lower average data rates. The total bandwidth and allowed bandwidth are therefore less critical, but transport cost is considered critical. Gold Subscription — This indicates a premier user subscription that would allow the use of the highest-level QoS independent of the transport cost. Silver Subscription — This indicates a medium priority user subscription that would try to balance between QoS requirements and other factors such as transport cost. Bronze Subscription — This indicates a lower-priority user subscription where transport cost is significantly more important than any QoS parameters.
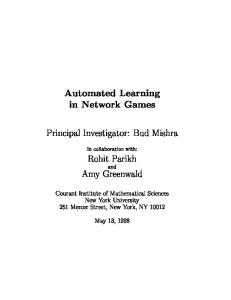
Evaluation of TOPSIS for Network Selection Simulation of Use Case Scenarios To validate the use of TOPSIS in the decision process, we performed simulations for network selection from five networks. Table 2 provides a snapshot of attribute values for these five networks at the time of decision on network selection. We considered the following use case scenarios, where service and user subscription profile as described previously were used. Scenario 1: In this scenario the decision process is influenced by the requested service indicated by the user. Service types VoIP, streaming, and Web browsing were used to assign attribute weights.
37
BARI LAYOUT
1/4/07
1:17 PM
Page 38
0.5 Cost/byte Total bandwidth Available bandwidth Utilization Delay Jitter Loss
0.4
Wts
0.3 0.2 0.1 0 Voice
Streaming
Scenario 1/2
Scenario 3/4
Web
Scenario 1/2 - Managed Network
Scenario 3/4 - Managed Network
1
1
1
0.8
0.8
0.8
0.6
0.6
P
P
P
0.6 0.4 0.4 0.2 #1
0.4
#2
#3 Voice call
#4
#5
0.2 #1
0.2
#2
#3 #4 Streaming media
#5
0 #1
#2
#3 #4 Web browsing
#5
■ Figure 2. Simulation results for scenarios 1 and 3. Scenario 2: In this scenario the decision process is influenced by the QoS profile of the user stored in the home network. User subscription types gold, silver, and bronze were used to assign attribute weights. Scenario 3: This is the same as scenario 1 except that the operator of network #5 has temporarily indicated a reduction of access cost to the subscriber’s home network in order to attract more customers to its network. This change would influence the rankings. Scenario 4: This is the same as scenario 2 except that operator of network #5 has temporarily indicated a reduction of access cost to the subscriber’s home network in order to attract more customers to its network. The results of simulations for scenarios 1 and 3 are shown in Fig. 2, which also shows the weights assigned to various attributes. The assignment is based on the analysis of the service/subscribed QoS profiles described earlier. Similarly, the results of scenarios 2 and 4 are documented in Fig. 3. The results indicate that even with the same set of parameter values, the top candidate network can be different for different types of QoS subscriptions or service profiles; for example, the network considered optimal for a VoIP user is different than that for a Web browsing user in scenario 1. This is due to differences in service requirements reflected by weights assigned to the parameters for QoS profiles of different services. Network operators can influence the decision process by making their network more attractive to a certain type of user or service. In the case of scenario 3 and 4, network #5 influences selection by temporarily decreasing the access cost for its network to its roaming partners. As a result, when the user’s home network calculates the network rankings, network #5 becomes quite attractive for most of the services or users where network transport cost is an important factor in the decision process. This is evident by observing the results of Figs. 2 and 3, where network #5 becomes the network of choice for gold, silver, and bronze customers along with streaming media and Web browsing services. Also, it can be observed that the network rankings for services/subscriptions not significantly influenced by the cost attribute (e.g., VoIP) are not impacted by changes in network #5’s cost.
38
Sensitivity of Network Selection to Dynamic Attribute Values The compensatory part of the network selection process is primarily related to finding the network best suited in terms of QoS to the user or requested service QoS profile. Many QoS related parameters used in the proposed compensatory MADM algorithm are dynamic. An inaccurate measure of these parameters values could result in the selection of a non-optimal network. Table 3 provides a comparison of results for TOPSIS for the previously described scenario 1 when the attribute values for delay, jitter, and loss are changed by 10 percent for a VoIP user, and the attribute values for delay, jitter, and loss are changed by 30 percent for a Web user. The results indicate that while a 10 percent change in these attribute values changes the selected network for a VoIP user, a change of even 30 percent in these attribute values does not change the result for a Web user. This shows that network selection for services like Web browsing or for bronze users are less sensitive to dynamic attribute information than services such as VoIP or gold users. This is due to the assignment of lower weights to dynamic attributes in the QoS profiles for a bronze user or Web browsing. Consequently, errors in these attribute values have a lesser impact on network selection, and results are more reliable.
Network Selection with Managed IP Networks Managed IP networks typically provide multiple levels of SLAs, which can possibly be mapped to several classes of QoS. For example, QoS classes identified by different differentiated services (DiffServ) codepoint markings at the IP layer can be mapped to different SLA levels. For MADM algorithms used in network selection, networks that support multiple levels of SLAs or classes of services can be mapped to multiple network options in the MADM algorithm, each supporting one QoS class or SLA. Table 4 represents an access system that supports five classes of service or five levels of SLAs. For TOPSIS, this access system is represented as five alternatives. The selection of any particular alternative will map to the same physical network but with a different QoS class or SLA level. Therefore, while the
IEEE Network • January/February 2007
BARI LAYOUT
1/4/07
1:17 PM
Page 39
CB (%)
TB (Mb/s)
AB (Mb/s)
U (%)
D (ms)
J (ms)
L (per 106)
Network #1 e.g., UMTS
100
2
0.2
10
400
50
100
Network #2 e.g., 802.11b
20
11
1
20
200
25
20
Network #3 e.g., 802.11a
10
54
2
20
100
15
15
Network #4 e.g., 802.11n
5
100
5
40
150
30
20
Network #5 e.g., 4G
301, 52
100
5
20
100
20
15
1 2
Scenario 1, 2. Scenario 3, 4
■ Table 2. Attribute values for scenarios 1, 2, 3, and 4.
total access network bandwidth will be the same for all alternatives, the values of other parameters (e.g., delay, jitter, packet loss) are different depending on the QoS class or SLA level. The results of simulation for the four scenarios discussed previously using TOPSIS are again exhibited in Figs. 2 and 3, which demonstrate how different user subscriptions or service requirements are mapped to different QoS classes or SLA levels represented by different alternatives in the TOPSIS algorithm. For example, use of TOPSIS maps a streaming media user in scenario 1 to QoS class/ SLA level #5, while a Web browsing user maps to QoS class/SLA level #1 for the same attribute values. However, a decrease in cost attribute for QoS class/SLA level #5 in scenarios 3 and 4 results in it being mapped to all service and subscription types.
Network Selection for Accessing Multiple Services Simultaneously So far network selection has been discussed for scenarios where the user accesses one or more services having the same QoS requirements. A common scenario that could arise is
that a user who is already in session for a service using a network previously selected for this service now decides to start another service that may have different service requirements in terms of QoS. This would trigger a new network selection decision. Although it is possible to select two different networks and use them to access two services simultaneously, in practice such a policy can create several problems such as authentication with two networks simultaneously, excessive power consumption, or possible interference of turning on two radios at the same time, and appropriate routing of service data within the device and networks. For these reasons it is recommended that such network selection solutions be avoided. The proposed solution using comprehensive MADMbased network selection is as follows: • Perform the non-compensatory MADM part of network selection as usual for each individual service requested. • Use a compensatory MADM algorithm for each individual service requested. Networks that support multiple levels of QoS/SLAs would be mapped to more than one network options, as described earlier. • The final network selected will be based on the average of
Scenario
P – network #1
P – network #2
P – network #3
P – network #4
P – network #5
VoIP – baseline
0.2912
0.7190
0.8830
0.6161
0.8570
VoIP – 10% error
0.2919
0.7272
0.8582
0.6237
0.8657
Web – baseline
0.1070
0.7725
0.8623
0.8901
0.7504
Web – 30% error
0.1251
0.7738
0.8638
0.8687
0.7517
■Table 3. Simulation results on sensitivity analysis.
CB (%)
TB (Mb/s)
AB (Mb/s)
U (%)
D (ms)
J (ms)
L (per 106)
QoS class#1/SLA#1
10
100
0.1
30
400
100
10
QoS class#2/SLA#2
20
100
0.5
20
200
50
50
QoS class#3/SLA#3
30
100
1
20
100
25
50
QoS class#4/SLA#4
50
100
2
40
50
10
100
QoS class#5/SLA#5
50
100
5
20
10
5
100
■ Table 4. Attribute values for scenarios 1, 2, 3, and 4.
IEEE Network • January/February 2007
39
BARI LAYOUT
1/4/07
1:17 PM
Page 40
0.7 Cost/byte Total bandwidth Available bandwidth Utilization Delay Jitter Loss
0.6
Wts
0.5 0.4 0.3 0.2 0.1 0 Gold
Silver
Scenario 1/2
Scenario 3/4
Bronze
Scenario 1/2 - managed network
1
1
0.8
0.8
Scenario 3/4 - managed network 1 0.8
0.6
P
P
P
0.6 0.6
0.4 0.4
0.4
0.2 #1
#2
#3 Gold
#4
#5
0.2 #1
0.2
#2
#3 Silver
#4
#5
0 #1
#2
#3 Bronze
#4
#5
■ Figure 3. Simulation results for scenarios 2 and 4.
ranking for the networks of each service; for example, a network ranked as 1 and 2 for the two services under consideration will have an average ranking of 3 for combined service delivery. There may also be other aspects of the already in use service that can influence the subsequent network selection upon starting another service. For example, the already in use service can be VoIP, which requires support for real-time traffic from the access network. As this may not be possible across all candidate networks, it may be a policy in such a situation to use the already in use network for the new service as well. In addition, certain requirements of the new service (e.g., QoS) may force network reselection for the service already in use. Such requirements would therefore influence the final network selection decision. Still other services may not be possible to combine over one wireless access network, and network selection in such a situation is an area for further study and research.
Conclusions Selection of an optimal access network is an important aspect of service delivery in a heterogeneous wireless system. The decision is influenced by several factors. This article has proposed a decision process for a network assisted network selection mechanism that combines non-compensatory and compensatory MADM algorithms. The proposed mechanism is more comprehensive than work published earlier. Along with disjunctive and conjunctive non-compensatory MADMs, the article has analyzed the use of TOPSIS, a compensatory MADM algorithm. The TOPSIS algorithm has been validated by applying it to a large variety of use cases. Scenarios with different services and subscribed QoS profiles have been simulated to observe how the proposed mechanism would work. Application of the proposed mechanism to networks with multilevel SLAs has been described. Possible approaches to network selection when a service is already in use have been discussed, and solutions are proposed. The results of this article have provided a basis for further research into the area of service delivery in a heterogeneous network environment.
40
References [1] F. Bari and V. C. M. Leung, “Service Delivery over Heterogeneous Wireless Networks: Network Selecton Aspects,” Proc. ACM IWCMC, Vancouver, Canada, July 2006. [2] Q. Song and A. Jamalipour, “Quality of Service Provisioning in Wireless LAN/UMTS Integrated Systems Using Analytic Hierarchy Process and Grey Relational Analysis,” Proc. IEEE GLOBECOM, Dallas, TX, Nov./Dec. 2004. [3] G. Le Bodic et al., “Dynamic 3G Network Selection for Increasing the Competition in the Mobile Communications Market,” Proc. IEEE VTS-Fall, 2000, Boston, MA, Sept. 2000. [4] E. Alexandri, G. Martinez, and D. Zeghlache, “Adaptive Joint Call Admission Control and Access Network Selection for Multimedia Wireless Systems,” Proc. 5th Int’l. Symp. Wireless Pers. Multimedia Commun., Honolulu, HI, Oct. 2002. [5] S. Hongvan, H. Chen and J. Lingge, “Intelligent Signal Processing of Mobility Management for Heterogeneous Networks,” Proc. Int’l’ Conf. Neural Networks and Signal Processing, Nanjing, China, Dec. 2003. [6] H. J. Wang, R. H. Katz, and J. Giese, “Policy-Enabled Handoffs Across Heterogeneous Wireless Networks,” Proc. Mobile Comp. Sys. and Apps., New Orleans, LA, Feb. 1999. [7] R. Benayoun, B. Roy, and B. Sussman, “Manual de Reference du Programme Electre, Note de Sythese et Formation,” Direction Scietifique SEMA, no. 25, 1966. [8] C. L. Hwang and K. Yoon, Multiple Attribute Decision Making: Mehtods and Applications, Springer Verlag, 1981. [9] M. Zeleny, Multiple Criteria Decision Making, McGraw-Hill, 1982. [10] J. L. Deng, “Introduction to Grey System,” J. Grey Sys., vol. 1, no. 1, 1989, pp. 1–24.
Biographies FAROOQ BARI [SM] (
[email protected],
[email protected]) is a Ph.D. candidate in the Department of Electrical and Computer Engineering at the University of British Columbia, Vancouver, Canada. He obtained his Master’s degree in electrical engineering from Virginia Tech, Blacksburg, in 1994 and his Bachelor’s degree in electrical engineering from UET, Lahore, Pakistan (1991). He is a lead member of technical staff at Cingular Wireless with research interests in the area of heterogeneous communication systems. V ICTOR C. M. L EUNG [F] (
[email protected]) is a professor of electrical and computer engineering and Telus Mobility Research Chair at the University of British Columbia, where he pursues research on mobile and wireless networks. He was a lecturer in electronics at the Chinese University of Hong Kong in 1988 and a senior technical staff member at MPR Teltech Ltd. from 1981 to 1987. He received his B.A.Sc. and Ph.D. from the University of British Columbia in 1977 and 1981, respectively. He is on the editorial boards of IEEE Transactions on Wireless Communications and IEEE Transactions on Vehicular Technology. He is a registered Professional Engineer in British Columbia, Canada.
IEEE Network • January/February 2007