Proceedings of the 34th Hawaii International Conference on System Sciences - 2001
Spatial Data Visualization in Healthcare: Supporting a Facility Location Decision via GIS-based Market Analysis Charles E. Noon, Ph.D. Management Science Program University of Tennessee Knoxville, TN 37996
[email protected] Abstract As the business of healthcare continues to evolve, it is increasingly important for hospital systems to optimize the quality of capital investment decisions. Since proximity to services plays a major role in an individual’s choice of healthcare provider, decisions concerning facility location and function are crucial. This paper describes an application of spatial data visualization to support the decisions of locating and sizing a proposed Neonatal Intensive Care Unit (NICU) within a system’s network of rural hospitals. A Geographic Information System (GIS) was used to analyze publicly available and system-specific data. The discovered patterns of healthcare system market share and customer travel were key drivers in the decisionmaking process. The application provides a good example of using a spatial data mining tool as a powerful step in the Knowledge Discovery in Databases (KDD) process.
1. Introduction The concept of Knowledge Discovery in Databases (KDD) refers to the general process of extracting useful information from databases [1]. An alternative definition of KDD is given in [2] as the discovery of interesting, implicit, and previously unknown knowledge from large databases. It is the distinction of “previously unknown” knowledge that separates KDD from traditional hypothesis testing methods of statistics and from the OnLine Analytical Processing (OLAP) tools that have emerged from the field of information technology [3]. The specification of “large databases” implies that the tools and techniques of KDD must be computationally efficient. Data Mining, considered to be a single step within the KDD process, involves the use of algorithms to enumerate patterns from, or fit models to, data [1]. From a practical standpoint, KDD is about turning large amounts of data into useful information. In business applications, the useful information must then be
Charles T. Hankins MD, MBA Innovative Healthcare Consulting 3901 Windolyn Circle South Memphis, TN 38133
[email protected] skillfully incorporated into a strategy formulation process. This paper focuses on the process of knowledge discovery for supporting a strategic business decision faced by a large healthcare system and the tools that facilitated it. Spatial Data Mining is defined as the extraction of implicit knowledge, spatial relationships, or other patterns not explicitly stored in spatial databases [4] [5]. The most common applications of spatial data mining include earth science analysis, economic geography, and spatial trend analysis [6] [7]. Along with rules and image databases, Koperski et al. [8] considers thematic maps to be one of the “primitives of spatial data mining” and views them as an essential tool in Generalization-Based Knowledge Discovery. Whether used for pattern discovery or communication, thematic maps have the cognitive advantage of a “broadband channel for information flow” [9]. Spatial data visualization via thematic maps has long been the strong point of Geographic Information Systems (GIS). A GIS is described as a set of tools for collecting, storing, retrieving at will, transforming, and displaying spatial data from the real world for a particular set of purposes [10]. The earliest applications of GIS technology were in the areas of environmental modeling, urban planning, and public health [11] [12]. Use of the technology was limited by high costs of software and hardware required to run GIS applications. Given its computationally intense processing, it required expensive workstations and software. By the mid-nineties, affordable GIS software was ported to relatively low cost personal computers, thus paving the way for more widespread applications. Business applications of GIS increased throughout the nineties and included natural resource management, facilities management, location analysis, sales territory management, network planning, transportation and route planning (see [13] for an overview). Within the category of location analysis, the most common application of GIS involves service-area analysis. Service area analyses usually rely on either publicly or commercially available demographic data with the goal of identifying the
0-7695-0981-9/01 $10.00 (c) 2001 IEEE
1
Proceedings of the 34th Hawaii International Conference on System Sciences - 2001
2
population proximity to service resources. Within a GIS, it usually involves the display of demographic data, such as age-stratified population figures, at the census-tract, 5digit zip code, county, 3-digit zip code, or MSA level. Typical measures used in the construction of thematic maps include population densities for polygon-feature representations, dot-density representations, or variable sizing of symbols to reflect underlying data. For organizations with existing customers in a study area, the analysis can be enhanced by constructing thematic maps showing customer density or customers per population as a proxy for market penetration or market share. The most common applications of GIS in healthcare settings have been in the evaluation of public or private healthcare networks. Several examples or GIS-based analyses of public health services can be found in [14] [15], and [16]. Resources describing GIS applications in private or non-profit healthcare systems include [17], [18], [19], [20], [21], and [22]. In this paper, we describe an application of GIS-based data visualization for supporting a decision related to locating a medical service within a network of rural hospitals. The application is in the spirit of KDD and brings to light the power of spatial data visualization tools applied to large-scale public databases. Several unique aspects of the application are the nature of the service, the degree of publicly available competitor information, and the methods for visualizing customer movement patterns. The objective of the application was to gain a clearer understanding of the competitive environment and to identify problems or opportunities related to prior decisions. From a strategic standpoint, the patterns discovered through the GIS modeling proved to be key drivers in the decision-making process.
2. An Expansion Decision in West Tennessee The focus of this paper is a decision faced by a large healthcare system, referred to as System M, located in a moderate sized urban area of population 1.2 million. Over the previous ten years, this system had become the largest provider of healthcare services in the urban area by the timely introduction of new services. One prime focus of the system had been the introduction of three additional maternity centers in the urban service area. These maternity centers each included the capability of providing special care to newborn infants through the introduction of intensive care nurseries. The strategy appeared to work and propelled the system from third to first in the annual number of deliveries within the urban market. The importance of focusing on maternity services carries with it a strategic agenda. Many healthcare systems have long accepted the “cradle-to-grave”
concept, whereby the expected result is that by increasing maternity services one can expect a secondary increase in all other services because of two factors. First, people tend to return for care to environments that are known to them especially if their prior experience was positive. The birth of an infant carries with it a high degree of satisfaction as the experience is recalled. Second, women are often the healthcare decision-makers for the entire family. By making sure all their needs are met, systems anticipate they will select a particular system’s services for other family members as well. It should be noted, however, that the “cradle-to-grave” concept might be less of a reality in the era of managed care since employers or insurers often influence the selection of available providers. While System M was successfully strengthening its presence in the urban market, they were correspondingly building a rural network of facilities in an adjacent region. The system had grown to include eight rural hospitals in the twenty counties outside of the urban market. Although this had created a significant presence for the system in the entire region, they were not the dominant provider in the rural market. A competing rural-based system (System W) had five hospitals in the same twenty-county area. Although this competing system had fewer facilities, it had a flagship tertiary center in the middle of the twenty-county region that was the only site where many unique services were offered. Thus, many rural patients were electing to seek services at the System W’s tertiary center because of its increased ability to deliver definitive services. This was problematic for System M in that it had acquired the rural facilities anticipating they would become “feeder” facilities to their urban facilities when tertiary care was needed. As a result, System M began to re-think its strategy and decided to enter the rural market with a selected set of tertiary services with the goal of providing a counterbalance against the competing system. As an initial demonstration of its commitment to increasing the level of care offered in the rural market, System M decided to foster an increased maternity emphasis with the addition of a neonatal intensive care unit (NICU) in one of their rural hospitals. The size and location of the NICU was initially determined by System M’s senior administrators based on a desire to directly compete with the only other rural intensive care nursery in the region. The decision was to pick the location nearest System W’s tertiary nursery and to start with an 8-bed unit. System M had previously used this 8-bed parameter as a start-up size for its last three urban nurseries. System M possessed historical data that showed their rural facilities supported approximately 2050 births per year. Also, by historical in-house and published data, they could reasonably expect 10-12% of all births would
0-7695-0981-9/01 $10.00 (c) 2001 IEEE
2
Proceedings of the 34th Hawaii International Conference on System Sciences - 2001
3
need a higher level of care than provided by a traditional “well-baby” nursery. Thus, a reasonable estimate of 200250 admissions per year was projected for the proposed NICU. Up to this point, the planning was done without regard or knowledge of any of the competitors’ activity level. Based on this limited analysis, System M decided to apply for government approval for a healthcare facility expansion, referred to as a Certificate of Need (CON). The system submitted their request to the state facilities commission and, after being vigorously opposed by their competitor, was successful in gaining a CON for the NICU project at the System M facility in the same county as the competing system’s tertiary center. After obtaining the CON, a more thorough needs analysis was undertaken in order to assure that the quality of any service in the rural setting would be in keeping with the high standards that was expected in the urban setting. The application of data visualization via GIS graphically demonstrated patient travel patterns for receiving maternity care and led to a better assessment of the competitor’s position in the area of maternity service.
The insight gained by the visualization ultimately caused the system to re-think its approach to the start-up of intensive care nursery services in this area.
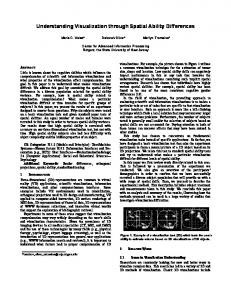
3. Market Data Visualization Using GIS The objective of the analysis was to better assess the overall goal of developing a higher level of care for all infants born in System M’s facilities. This involved assessing the market size and patient flow of the rural market defined as the twenty-county area outside of Memphis and west of the Tennessee River. The area had a population of approximately 550,000 and was home to 19 small or medium sized community hospitals and had one large medical center in the “heart” of the region. Several of the smaller counties had no facilities and a few counties had multiple facilities. Of the twenty in-patient facilities, only 15 were active in the maternity area of delivering babies. While System M was able to collect data on the slightly greater than 2000 births/year in its 8 facilities that
Figure 1. GIS depiction of the 20-county region with hospitals color-coded according to system. Each hospital symbol is sized and labeled according to the number of deliveries in
0-7695-0981-9/01 $10.00 (c) 2001 IEEE
3
Proceedings of the 34th Hawaii International Conference on System Sciences - 2001
4
delivered infants, there was little competitive information known concerning the other seven maternity-capable facilities. A request was made to the state’s Bureau of Vital Statistics for all birth certificate information that was public record. The data set was readily supplied and covered all births in the state of Tennessee for the calendar year 1997. The data was provided in a form that displayed, for each hospital, the number of delivering mothers from each 5-digit zip code. A quick analysis of the data showed that System M owned 8 of the 15 delivering hospitals in the rural region, yet performed only 31% of the deliveries. The main regional competitor (System W), which possessed the centrally located large medical center, performed 46% of the deliveries. The remaining 23% of the deliveries occurred at either the hospitals of the third largest system (System B) or at independently owned county facilities (Unaffiliated). The first application of the GIS was to display data for each facility in the region so that overall activity by each system could be readily visualized.
Figure 1 shows the 20-county rural market and the 15 hospitals with maternity services. The hospital symbols are color-coded according to hospital system and are sized and labeled according the number of deliveries in 1997. The southeastern quadrant of the region was easily assessed as being the least crucial to any strategic plan, while the northern half of the region was clearly where the majority of the births were occurring outside of the competitor’s centrally located medical center. For each zip code, the total number of delivering mothers in 1997 was calculated. The values were attached to a polygon layer of zip codes and a measure of delivering mothers per square mile (referred to as Patient Density) was calculated and displayed (Figure 2). As can be seen, the greatest patient densities occurred in the center of the region (Madison county) and in the southwest corner (the periphery of the urban market). As expected, the variation in patient densities corresponds to the variation in general population densities across the region.
Figure 2. Birth certificate data plotted by birth mothers zip code as patients per square mile for the entire region. Delivering hospitals are color-coded according to system.
0-7695-0981-9/01 $10.00 (c) 2001 IEEE
4
Proceedings of the 34th Hawaii International Conference on System Sciences - 2001
5
Since the data could be broken out by hospital and system, a set of displays showing patient densities for each system was created. Figure 3 shows the patient densities for the three delivering hospitals of the third largest system (System B) whose facilities are designated with the green symbols. The market reach for System B’s community hospitals is in stark contrast to the patient densities of System W (with yellow facilities) shown in Figure 4 and those of System M (blue facilities) in Figure 5. With these displays, the management of System M now understood they were a significant maternity care provider around the periphery of the region, whereas their main competitor had the majority of births in the central core of the region.
Figure 5. Patient density for System M measured as patients per square mile.
Figure 3. Patient density for System B measured in patients per square mile.
The limitation of a patient density display is that it only provides a view of a system’s market reach in isolation. The next set of displays was constructed to better understand each system’s reach relative to the other systems. Each zip code was considered to be a “market”, and the proportion of deliveries in each of these “markets” was calculated for each system. Figure 6 utilizes the calculated “market share” (represented as a percentage) and shows a display of the market shares, respectively, for System W and System M. The advantage of this type of display is that it is easy to recognize areas of market share dominance or lack thereof. As can be seen, System W has a commanding 80-100% market share in the center of the region and competes with a greater than 40% share into areas south and east of its facilities. In contrast, System M’s market share is not as commanding in the areas surrounding its facilities and seems to be relatively weak in the central, east and south portions of the region.
Figure 4. Patient density for System W measured as patients per square mile.
0-7695-0981-9/01 $10.00 (c) 2001 IEEE
5
Proceedings of the 34th Hawaii International Conference on System Sciences - 2001
6
Figure 6. Thematic maps of market share (for System W and System M) measured as the percent of delivering mothers within a zip code who delivered at one of the system’s facilities.
0-7695-0981-9/01 $10.00 (c) 2001 IEEE
6
Proceedings of the 34th Hawaii International Conference on System Sciences - 2001
7
It is obvious from the preceding displays, that delivering mothers are willing to travel moderate distances from their homes for maternity service. In order to gain a better understanding of “inter-county” travel for maternity service, a set of displays were created which utilized county boundaries as the administrative unit. The first of these displays (Figure 7) shows the relative number of delivering-mother “imports” for each county that had facilities which performed deliveries. For each such county, a pie chart is sized according to how many deliveries were performed in the county and is divided according to how many of those delivering mothers were from the county itself or were “imported” from another county. For counties with community hospitals, the degree of “imports” appears to depend upon the size of the county’s facilities and on the presence of maternity service in neighboring counties. In the case of centrallylocated Madison County, the fact that approximately two thirds of its deliveries are imports is further evidence of the draw of the large medical center in this rural market. The second county-level display (Figure 8) focuses on delivering-mother inter-county “exports”. For each of the twenty counties, a pie chart is sized according to the number of delivering mothers with home zip codes
within the county. The pie chart is divided according to which county the mother gave birth in. In all pie charts, the white portion represents those mothers who stayed in their home county to give birth. As an example, virtually all delivering mothers of Madison County delivered in Madison County. In contrast, immediately to its north, approximately three fourths of the delivering mothers in Gibson County gave birth outside of the county and most of those occurred in Madison County. The importance of this type of display is that it allows a hospital system to identify situations where county residents are bypassing a community hospital in favor of a facility in another county. A good example of such a situation is Dyer County in the northwest part of the region. System M has the only maternity service hospital in the county, however, it is losing approximately one third of those potential deliveries to other counties. When such situations are identified, their causes should be investigated and approaches for trying to regain market share can be pursued. As can be seen by the GIS visualization, System W’s medical center is located near the geographic center of the region. The town that it is located in is the largest town in region, yet has a population of fewer than
Figure 7. Display of inter-county patient “import”. For each county in which deliveries occurred, the pie chart is sized according to the number of 1997 deliveries and is divided according to deliveries to the county’s own residents versus residents of other counties.
0-7695-0981-9/01 $10.00 (c) 2001 IEEE
7
Proceedings of the 34th Hawaii International Conference on System Sciences - 2001
8
Figure 8. Display of inter-county patient “export”. The pie chart in each county is sized according to the number of residents who gave birth in 1997. The pie chart is divided according to where those residents gave birth. In all pie charts, the white portion reflects the number of residents who delivered in their county of residence. 100,000. Relative to other towns in the region, it has larger employers, better shopping, and a greater variety of lifestyles. For area individuals wanting more than the small town offerings, without the big city hassle, it is geographically convenient. This is assumed to be true for “medical shopping” as well based on the fact that this large medical center is thriving in a smaller community than would normally be expected. By opting to place its first tertiary service in the same town and, in essence, going “head-to-head” with the medical center, System M was hoping to take advantage of these same factors. However, as can be seen by the birth distributions, this medical center has practically all the births in its own county and the six surrounding counties. If there is any credence to the previously referred to “cradle-to-grave” concept in health care, it may be very formidable to attempt to gain market share in such proximity to the dominant provider. Through the help of the GIS displays, a 6-county area in the northern part of the region was identified as being sufficiently removed from
the medical center yet still lost patients to it. By locating a new NICU in this region, it is possible that some of the outermost market share of the medical center could be “picked off”. With the discovery of these market patterns complete, a new recommendation was made to the system. If their main goal was to gain a greater overall market share of births, then improving support to the northern 6 counties was recommended since these were the larger birth counties and were somewhat removed from System W’s well-established hub. However, if the improved maternity services were simply to be the first step in trying to build a competing medical center in the region, then their initial decision to go head-to-head in the same county seemed sound. This strategy would require repeatedly undertaking the CON process until the “center” status could be attained. Due to the fact that the CON process is expensive and highly unpredictable, such a strategy carries a high degree of risk.
0-7695-0981-9/01 $10.00 (c) 2001 IEEE
8
Proceedings of the 34th Hawaii International Conference on System Sciences - 2001
9
4. Conclusion Healthcare systems in the United States have traditionally been able to undertake expansion projects with very little justification or risk. Projects could be started whenever a need was identified and usually charges would be covered as patients began to take advantage of the new service. The situation has rapidly changed over the past few years for several reasons. Contracting for services has reduced profits and it is not uncommon that new services are not covered under existing contracts. Large populations can change providers virtually overnight if a contract changes. This makes it much more crucial for healthcare systems to judicially approach every project. Spatial data visualization tools such as GIS need to be utilized early in the project planning process to assure that the first plan put forward is as close to being the best plan as possible. After identifying data with implicit information on competitors, the strategic “mining” of this data will enable a much more thorough understanding of the entire service area. Such an understanding will likely lead to a reduction in costly redundancy of care through more informed placement of proposed new facilities. Once expansion plans are revealed, there are often competitive issues that arise that make ongoing revisions necessary. Such revisions can only be completed if all the analysis has been previously completed and is correct. By using data visualization early in the process, an economically sound direction can be identified and more confidently pursued. The application can be reviewed in the context of a business application of KDD. The process of discovery begins by getting an overall picture of the available data [23]. Although the data set provided by the state was not huge, it was tabular and too unwieldy to extract patterns through inspection. Through the use of GIS-based data visualization, previously unknown competitive patterns were ushered into the strategic decision-making process. The data set also offers the opportunity for the application of more advanced data mining tools. For example, the relationship between birth weight, demographics, and travel for maternity service is a natural area of application of data mining algorithms.
5. References
[2] W. J. Frawley, G. Piatetsky-Shapiro, and C. J. Matheus. “Knowledge Discovery in Databases: An Overview”, In Knowledge Discovery in Databases (Eds. G. Piatesky-Shapiro and W. J. Frawley), AAAI/MIT Press, Menlo Park, CA, 1991. [3] H.A. Edelstein, Introduction to Data Mining and Knowledge Discovery, 3rd Ed., Two Crows, 1998. [4] K. Koperski and J. Han, “Discovery of Spatial Association Rules in Geographic Information Databases,” In Proc. 4th International Symposium on Large Spatial Databases (SSD’95), pp. 47-66, Portland, Maine, August 1995. [5] K. Koperski, J. Han and J. Adhikary, “Mining Knowledge in Geographical Data”, Comm. ACM (to appear), 1999. [6] M Ester., H.-P. Kriegel, and J. Sander, “Algorithms and Applications for Spatial Data Mining”, in Geographic Data Mining and Knowledge Discovery (Eds. H. Miller and J. Han), Research Monographs in GIS, Taylor and Francis, 2000. [7] Y. Bedard., T. Merrett, and J. Han, “Fundamentals of Spatial Data Warehousing for Geographic Knowledge Discovery”, in Geographic Data Mining and Knowledge Discovery (Eds. H. Miller and J. Han), Research Monographs in GIS, Taylor and Francis, 2000. [8] K. Koperski, J. Adhikary, and J. Han, “Spatial Data Mining: Progress and Challenges Survey paper”, In Proc. ACM SIGMOD Workshop on Research Issues on Data Mining and Knowledge Discovery, Montreal, Canada, 1996. [9] M. Gahegan, M. Harrower, and T.-M. Rhyne, “The Integration of Geographic Visualization with Databases, Data Mining, Knowledge Construction and Geocomputation”. In Int’l Cartographic Association Commission on Visualization 2000 (www.geog.psu.edu/ica/icavis/ICAvis_overview.html). [10] P.A. Burrough, “Principles of geographical information systems for land resources assessment”, Monographs on Soil and Resources Survey, Vol. 12. Claredon Press, Oxford, 1986. [11] D. M. Mark, N. Chrisman, A.U. Frank, P.H. McHaffie, and J. Pickles, The GIS History Project, presented at the USGIS Summer Assembly, Bar Harbor, Maine, 1997. [12] C. Clarke, S.L. McLafferty, & B.J. Tempalski, “On Epidemiology and Geographical Information Systems: A review and discussion of future directions”, Emerging Infectious Diseases, Vol. 12, No. 2, pp. 85-92, 1996. [13] D. Grimshaw, Bringing Geographical Information Systems into Business, 2nd ed. John Wiley & Sons, New York, 2000.
[1] U. Fayyad, G. Piatetsky-Shapiro, and P. Smyth. “From data mining to knowledge discovery: An overview”, In Advances in Knowledge Discovery and Data Mining (Eds. U. Fayyad, G. Piatetsky-Shapiro, P. Smyth, and R. Uthurusamy), AAAI/MIT Press, Menlo Park, CA, 1996.
[14] A. Hirschfield, P. Brown, and P. Bundred, “The spatial analysis of community health services on Wirral using geographic information systems”, The Journal of the Operational Research Society, Vol. 46, No. 2, pp. 147-160, 1995.
0-7695-0981-9/01 $10.00 (c) 2001 IEEE
9
Proceedings of the 34th Hawaii International Conference on System Sciences - 2001
10
[15] N. Bullen, G. Moon, and K. Jones, “Defining localities for health planning: a GIS approach”, Social Science & Medicine, Vol. 42, pp. 801-816, 1996. [16] M. Dodge and S. White, “Public services in Wales: analyzing supply and demand for healthcare and education”, Mapping Awareness, Vol. 9, No. 7, pp. 24-27, 1995. [17] K. Sandrick, “Mapping the market: Managed care and geographic systems”, Health Management Technology, Vol. 19, No. 11, pp. 17-18, 1998. [18] D. Cahill and M. Chermak, “Changing the face of healthcare networks”, Business Geographics, June, pp. 34-36, 1997.
[20] C. Li, “Data mining: diagnosing healthcare networks”, Business Geographics, June, 1998. [21] S. Kohli, A. Sivertun, and O. Wigertz, “Distance from the primary health center: A GIS method to study geographical access to medical care”, Journal of Medical Systems, 19(6), pp. 425-434, 1995. [22] D. Martin, D. and H. Williams, “Market area analysis and accessibility to primary health care centers”, Environment and Planning A, 24(7), pp. 1009-1019, 1992. [23] C. Westphal and T. Blaxton, Data Mining Solutions – Methods and Tools for Solving Real-World Problems, John Wiley & Sons, New York, 1998.
[19] D. Franzblau, “Hospitals using mapping data to plan network coverage”, Health Care Strategic Management, July, pp. 14-15, 1994.
0-7695-0981-9/01 $10.00 (c) 2001 IEEE
10