Hierarchical Cardiac-Rhythm Classification Based on Electrocardiogram Morphology Dionisije Sopic, Elisabetta De Giovanni, Amir Aminifar, David Atienza Embedded Systems Laboratory (ESL), Swiss Federal Institute of Technology Lausanne (EPFL), Switzerland Abstract Atrial Fibrillation (AF) is a type of cardiac arrhythmia that significantly increases the risk of stroke and heart failure. In general, in the case of patients affected by AF, their electrocardiogram (ECG) shows a typical pattern of irregular RR intervals and abnormal P waves. However, discriminating AF from a normal sinus rhythm or from other types of rhythms remains a challenging problem today. Methods: We analyze the database of PhysioNet/Computing in Cardiology Challenge 2017 to validate our heart rhythm classification technique. The database contains short-term ECG recordings, labelled as normal sinus rhythm, AF, other types of rhythm, and noise. We extract different morphology-based features of ECG signals, and we design a multiclass classifier based on error-correcting output codes, along with a random forest classifier for binary decision making. Results: We test the performance of our classifiers based on the F1 score of each class and the average F1 score of all the classes. The final F1 score obtained on the hidden test set of challenge is 80%. Conclusions: Our results show that our classifier is robust and that it is able to discriminate AF from normal sinus, other rhythms, and noise, based on the morphology of the ECG signal.
1.
Introduction and Related Work
Atrial Fibrillation (AF) is one of the most common types of cardiac arrhythmia. In 2010, 20.9 and 12.6 million men and women were affected worldwide, respectively, with higher rates in developed countries [1]. AF may manifest in short episodes rather than a sustained condition, which increases detection complexity. Despite the progress in detection and treatment of AF, the arrhythmia remains one of the major risk factors for stroke and heart failure [1]. Conventionally, AF is diagnosed by analyzing electrocardiogram (ECG), and a typical pattern is associated to an AF episode: abnormal atrial activity and irregular ventricular response. Previous studies analyze the two responses either separately or combined to discriminate AF from normal sinus rhythm (NSR). The need to capture the abnormal atrial activity has given rise to a plethora of studies. In [2, 3], the authors
Computing in Cardiology 2017; VOL 44
Page 1
analyze the P-wave variability, by inspecting the absence of P-waves or the presence of F-waves, which appear as a “sawtooth” pattern hiding a clear P-wave in AF or atrial flutter. In [2, 3], the authors use statistical models of NSR P-waves and wavelet entropy to detect AF. The effect of AF on ventricular activity consists mainly in analyzing the irregularity of RR intervals. For instance, Zhou et al. [4] propose a method for real-time automated detection of AF episodes considering symbolic dynamics and Shannon entropy to describe the dynamic behaviour of RR-intervals time series. The combined analysis of atrial and ventricular responses can improve the accuracy in AF detection. In particular, Rincon et al. [5] combine heart-rate analysis with a P-wave analysis to detect AF in real-time on a wearable device. Although the classification of NSR and AF from a surface ECG has been investigated for many years, distinguishing AF from other types of arrhythmias still remains a challenging task, as many non-AF arrhythmias exhibit irregular RR intervals [6, 7]. In this paper, we propose a technique for heart-rhythm classification based on the morphology of the ECG signal.
2.
Rhythm Classification Technique
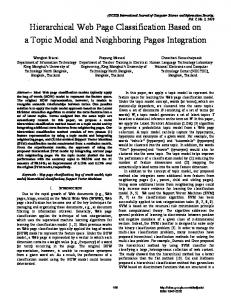
The main goal of this paper is to present a technique for heart-rhythm classification by analyzing short ECG recordings. The overall flow of our method is shown in Fig. 1 and it consists of three main phases: pre-processing (Section 2.1), feature extraction (Section 2.2), and hierarchical classifier (Section 2.3). The hierarchical classifier contains two different classifiers: a multiclass classifier based on error-correcting output codes (ECOC) and a random forest classifier for binary decision making. Each of these three main phases is thoroughly explained in the following subsections.
2.1.
Pre-Processing
As a first step, we filter the ECG signals to remove the baseline wandering and high frequency noise. Namely, two median filters are used for ECG baseline wander removal [8]. A 32nd-order zero-phase FIR band-pass filter with cut-off frequencies f1 = 0.05Hz and f2 = 40Hz
ISSN: 2325-887X DOI:10.22489/CinC.2017.343-119
Hierarchical Classifier
UndR
ECG
NSR OthR
Pre-Processing
Multiclass Classification (ECOC)
Feature Extraction
Random Forest
Noise AF
Figure 1: Rhythm classification technique for four classes of signals: normal sinus rhythm (NSR), alternative rhythm (OthR), noisy signals (Noise), and atrial fibrillation (AF). In case of getting undefined rhythm (UndR) at the output of the ECOC classifier, a random forest classifier is used for binary decision making. is applied for high-frequency noise and artefact removal. Then, the R-peaks of the ECG signals are detected using Pan-Tompkins algorithm [9].
consecutive beats, whereas the extreme tachycardia feature captures if the HR is above 140 bpm for any 17 consecutive beats.
2.2.
2.2.2. P-Wave and T-Wave Features
Feature Extraction
In the following subsections we explain in detail the features that we use for heart rhythm classification. We consider four different types of signals: NSR, AF, alternative rhythms (OthR), and noisy signals. NSR is any cardiac rhythm where depolarization of the cardiac muscle begins at the sinoatrial node with a heart rate (HR) of 60 − 100 bpm [6]. The representation of NSR is shown in Fig. 2a. On the other side, as it can be seen in Fig. 2b, AF records are characterized by the absence of the P wave [2]. Moreover, some AF records also exhibit irregular RR intervals [4]. However, many different types of arrhythmias (OthR) could exhibit irregular RR intervals [6,7]. The last class of signals contains signals that are too noisy to be classified. More details about these signals could be found in [6].
2.2.1. HR-Based Features The instantaneous HR is calculated as the inverse of the time difference between two consecutive R-peaks (RR interval): s HR[bpm] = 60∗f RR , where fs represents the sampling frequency of the signal. HR signal as well as its first, second, and third order derivatives are used as the main signals for feature extraction. We consider the minimum value, the maximum value, the mean value, the median value, the standard deviation, and the Euclidean norm (we refer to these features as basic statistical characteristics of a signal in the remainder of this paper) from each of these signals. We define features to describe two particular cases of arrhythmia defined as bradycardia and tachycardia. The former represents the percentage of HR values that are below 40 bpm, whereas the latter is defined the percentage of HR values that are above 140 bpm. Additionally, we define the extreme bradycardia and tachycardia features. The extreme bradycardia feature captures if the value of HR falls below 40 bpm for any five
As one of the main characteristics of AF records is the absence of the P-wave in the ECG signal, for each heart beat we extract the part of the signal corresponding to the P-wave. The pairwise linear correlation coefficient between all P-waves is calculated, resulting in a p × p matrix P, where p represents the number of R peaks in the ECG signal. In order to capture the variability in P-waves, we define signal sp that is obtained by concatenating all parts of the signal that correspond to P-waves, as well as feature fp defined as: Pp P − trace(P) fp = i=1 2 . p −p The normalized power of sp in the frequency band [0, 30] Hz, as well as the Shanon entropy of sp are also considered in the final set of features. Furthermore, the first, second, and third order derivatives of sp are also calculated. Basic statistical characteristics of these signals are added to the final set of features, along with the percentage of times where the peak of the P-wave is negative. Analogously, we extract the same set of features for the T wave, and we define signal st . The normalized power of this signal in the frequency bands [0, 5] Hz and [5, 30] Hz, along with its Shannon entropy is calculated. These two frequency bands have been selected, as we have noticed clear differences in power for NSR and OthR signals.
2.2.3. Time and Frequency-Domain Features Different types of arrhythmias may occur due to abnormalities in the generation and/or conduction of electrical impulses between the left atrium and left ventricle of the heart. Therefore, in order to detect these disorders, we use the PR and the PP interval. We calculate the PR interval from the peak of the P-wave to the Q-wave of the ECG signal. Basic statistical characteristics of PR intervals along with the ratio between standard deviations of PR and RR
Page 2
2.3.1. Multiclass Classification (ECOC)
(a) NSR.
(b) NSR versus AF.
Figure 2: Normal sinus rhythm (NSR) versus Atrial Fibrilation (AF).
intervals are used as features. We define the PP interval as the distance between two consecutive P-wave peaks. Similarly, the ratio between the means of PP and RR intervals as well as their standard deviations are added to the feature set. We also use QT interval and QRS width for detecting different alternative rhythms. The former is defined as the distance between the Q-wave of the ECG signal and the peak of the T-wave, whereas the latter is defined as the time difference between the S-wave and the Q-wave. Basic statistical characteristics of QT intervals and QRS widths are considered in the final set of features. In order to detect noisy signals, we use the normalized signal power at very low frequencies [0.005, 0.05] Hz, the power withinh [0.05, i50] Hz, as well as the power at higher frequencies 50, f2s Hz. These frequency-domain features have been extracted from raw ECG signals.
2.2.4. Additional Features We define additional features for random forest classifier for binary decision making. As many different arrhythmias exhibit RR irregularities, we consider the percentage of times that the difference between three consecutive HR values exceeds 5Hz, as well as 10Hz. Similarly, the same set of features is extracted for five consecutive HR values. Additionally, the number of zerocrossings of the parts that correspond to the P-wave and T-wave are also taken into consideration.
2.3.
Hierarchical Classifier
After performing feature extraction, two different classifiers are considered: a multiclass classifier based on errorcorrecting output codes [10], and a random forest classifier for binary decision making [11], as shown in Fig. 1. In order to make sure that our features are on a similar scale, before running any of these classifiers, we normalize each feature by subtracting its mean value x ¯ and dividing it by its standard deviation s: xn =
Multiclass classification is used to classify instances into more than two classes. In this work, we use a multiclass classification paradigm based on ECOC. This paradigm assigns a unique binary string of length n to each class. These binary strings are known as codewords [10]. Binary representation for each of our classes results in a coding matrix m × n, where m represents a number of classes in a classification problem. We train a classifier for each bit position in a coding matrix. At the test time, each of these n classifiers are evaluated to generate an n-bit string b. This string is further compared to each of the m coding words, and the new test example is assigned to the class whose codeword is closest to the generated bit string b.
2.3.2. Random Forest As shown in Fig. 1, a random forest classifier for binary decision making is used in case of getting undefined rhythm (UndR) at the output of the ECOC classifier. This classifier uses a subset of features explained in Section 2.2. Specifically, the P-wave features explained in Section 2.2.2 are not considered, as these features are mostly used for AF detection. Furthermore, as alternative rhythms contain many different types of arrhythmias, we have also added additional features explained in Section 2.2.4 in the feature set.
3.
Experimental Setup and Results
In this section, we explain the cross-validation scheme for training the classifiers, the final classifiers’ parameters, along with the results. We analyze the database of PhysioNet/Computing in Cardiology Challenge 2017 to validate our rhythm classification method [6]. The database consists of short ECG recordings that differ in length (between 30 s and 60 s in length). It contains 5050 NSR records, 2456 records that belong to alternative rhythms, 738 AF records, and 284 noisy records. All signals are sampled at 300Hz.
3.1.
Cross-Validation
In order to avoid the overfitting problem, we split the entire database into training and test sets. The training set contains 80% of randomly selected records of each class. The remaining 20% percent of each class is used in the test set. The training set is further divided into two different sets, set I and set II. Set I contains 70% randomly selected training records, and the remaining 30% is used for set II. The random split of training data is repeated five times in order to assess the robustness of the results. We use the F1 score explained in [6], as a valid metric for classifier performance evaluation. The results obtained on set II for 5 different data splits are tabulated in Table 1:
x−¯ x s .
Page 3
F1 (%) F old1 F old2 F old3 F old4 F old5
NSR 89.89 88.96 89.31 88.83 88.70
AF 79.13 76.61 77.56 77.46 75.50
OthR 70.76 68.82 70.85 70.04 70.71
along with a random forest binary classifier. Our experimental evaluation demonstrates the robustness of our classifier with an F1 score of 80% obtained on the hidden test set of challenge.
Final score 79.93 78.13 79.24 78.78 78.30
5.
Table 1: Five-fold cross-validation results for four classes of signals: normal sinus rhythm (NSR), alternative rhythm (OthR), noisy signals (Noise), and atrial fibrillation (AF). After running the multiclass classifier on the test set we obtain the F1 score of 89.73%, 78.83%, 73.85% for NSR, AF, and OthR, respectively. By finding the misclassified examples, we have noticed that 43% of misclassified examples consist of OthR signals that are classified as NSR, whereas 23% of misclassified samples consist of NSR that are classified as OthR. Therefore, we have decided to design a random forest classifier for binary decision making between OthR and NSR signals. We use the geometric mean of recall and specificity (gmean) for inspecting the classifier’s performance as classes OthR and NSR are not balanced. We obtain the following results for 5-fold cross-validation scheme: gmean = {81.91, 82.08, 82.22, 82.58, 82}%. Based on the cross-validation results, we use n = 25 bits for a binary representation of each of the four classes in ECOC. Classifiers that are trained for each bit are LogitBoost ensemble of classification trees with surrogate splits and 100 weak learners. Random forest classifiers for binary decision making uses 400 weak learners.
3.2.
Final Results
After training the hierarchical classifier on the entire training set, we test it on the test set. The last step consists of training both multiclass and binary classifier on the entire available data (on both training and test set), and submitting the trained model. The results obtained on the test set, along with the results obtained on the hidden test set of challenge are tabulated in Table 2. F1 (%) Test set Hidden test set of challenge
NSR 90 90.31
AF 79.57 78.95
OthR 75.66 70.76
Final score 81.79 80
Table 2: Normal sinus rhythm (NSR), alternative rhythm (OthR), noisy signals (Noise), and atrial fibrillation (AF).
4.
Conclusions
In this paper, we have presented a classification technique for heart rhythm detection. Based on the morphology of the ECG signal, we have designed a multiclass hierarchical classifier that uses error-correcting output codes,
Acknowledgement
This work has been partially supported by the Hasler Foundation (project no. 15048), the ONR-G through the Award Grant No. N62909-17-1-2006, and the RTD project BodyPoweredSenSE (no. 20NA21 143069) evaluated by the Swiss NSF and funded by Nano-Tera.ch with Swiss Confederation financing.
References [1]
Kirchhof P, et. al. 2016 ESC Guidelines for the management of atrial fibrillation developed in collaboration with EACTS. European Heart Journal 2016;37:2893–2962. [2] Ladavich S, et al. Rate-independent detection of atrial fibrillation by statistical modeling of atrial activity. Biomedical Signal Processing and Control 2015;18:274–281. [3] R´odenas J, et al. Wavelet Entropy Automatically Detects Episodes of Atrial Fibrillation from Single-Lead Electrocardiograms. Entropy 2015;17:6179–6199. [4] Zhou X, et al. Automatic online detection of atrial fibrillation based on symbolic dynamics and Shannon entropy. Biomedical engineering online 2014;13:18. [5] Rincon F, et al. Automated real-time atrial fibrillation detection on a wearable wireless sensor platform. In 2012 Annual International Conference of the IEEE Engineering in Medicine and Biology Society. IEEE, 2012; 2472–2475. [6] Clifford G, et. al. AF Classification from a Short Single Lead ECG Recording: the PhysioNet Computing in Cardiology Challenge 2017. IEEE Computing in Cardiology 2017;44. [7] Gayathri S, et al. ECG Arrhythmia Detection and Classification Using Relevance Vector Machine. Procedia Engineering 2012;38:1333–1339. [8] de Chazal P, et al. Automated processing of the single-lead electrocardiogram for the detection of obstructive sleep apnoea. IEEE Transactions on Biomedical Engineering 2003; 686–696. [9] Pan J, Tompkins WJ. A real-time qrs detection algorithm. IEEE transactions on bio medical engineering 1985;230–6. [10] Dietterich TG, Bakiri G. Solving multiclass learning problems via error-correcting output codes. Journal of Artificial Intelligence Research 1994;2:263–286. [11] Pal M. Random forest classifier for remote sensing classification. International Journal of Remote Sensing 2005; 1:217–222.
Address for correspondence: Name: Dionisije Sopic Full postal address: EPFL STI IEL ESL, ELG 130, Station 11, CH-1015 Lausanne E-mail address:
[email protected]
Page 4