Research Article
Hierarchical Encoding in Visual Working Memory: Ensemble Statistics Bias Memory for Individual Items
Psychological Science 22(3) 384–392 © The Author(s) 2011 Reprints and permission: sagepub.com/journalsPermissions.nav DOI: 10.1177/0956797610397956 http://pss.sagepub.com
Timothy F. Brady1 and George A. Alvarez2 1
Department of Brain and Cognitive Sciences, Massachusetts Institute of Technology, and 2Department of Psychology, Harvard University
Abstract Influential models of visual working memory treat each item to be stored as an independent unit and assume that there are no interactions between items. However, real-world displays have structure that provides higher-order constraints on the items to be remembered. Even in the case of a display of simple colored circles, observers can compute statistics, such as mean circle size, to obtain an overall summary of the display. We examined the influence of such an ensemble statistic on visual working memory. We report evidence that the remembered size of each individual item in a display is biased toward the mean size of the set of items in the same color and the mean size of all items in the display. This suggests that visual working memory is constructive, encoding displays at multiple levels of abstraction and integrating across these levels, rather than maintaining a veridical representation of each item independently. Keywords working memory, constructive memory, ensemble statistics, summary statistics Received 5/21/10; Revision accepted 10/16/10
Observers can quickly and accurately compute ensemble statistics about a display, such as the mean size (Ariely, 2001; Chong & Treisman, 2003), orientation (Parkes, Lund, Angelucci, Solomon, & Morgan, 2001), and location (Alvarez & Oliva, 2008) of the items; the mean expression of a set of faces (Haberman & Whitney, 2007); and even higher-level spatial layout statistics (Alvarez & Oliva, 2009). However, little work has explored why observers compute these statistics and, in particular, whether the encoding of these higher-order statistics might play a role in how observers represent the individual items from such displays in memory. Nearly all studies of visual working memory use displays consisting of simple stimuli and items that have been chosen randomly.1 These displays are, as best as possible, prevented from having any overarching structure or gist. Thus, influential models of visual working memory tend to treat each item as an independent unit and assume that items do not influence each others’ representations (Alvarez & Cavanagh, 2004; Bays, Catalao, & Husain, 2009; Luck & Vogel, 1997; Rouder et al., 2008; Wilken & Ma, 2004; Zhang & Luck, 2008; although see Lin & Luck, 2008, and Johnson, Spencer, Luck, & Schöner, 2009). We propose that, contrary to the assumptions of previous models of visual working memory, ensemble statistics allow observers to encode such working memory displays more
efficiently: In a process paralleling how people encode real scenes (Lampinen, Copeland, & Neuschatz, 2001; Oliva, 2005), observers might encode the “gist” of simple working memory displays (ensemble statistics such as mean size) in addition to information about specific items (their individual information). Such hierarchical encoding would allow observers to represent information about every item in the display simultaneously, significantly improving the fidelity of their memory representations compared with encoding only three or four individual items. To test this hypothesis, we used the ensemble statistic of mean size and the grouping principle of common color, both of which are known to be automatically and effortlessly computed and could act as a form of higher-order structure in visual displays (Chong & Treisman, 2005b). Our results demonstrate a form of hierarchical encoding in visual working memory: The remembered size of individual items was biased toward the mean size of items of the same color and the mean size of all items in the display. This suggests that, contrary to Corresponding Author: Timothy F. Brady, Department of Brain and Cognitive Sciences, 46-4078, Massachusetts Institute of Technology, 77 Massachusetts Ave., Cambridge, MA 02139 E-mail:
[email protected]
385
Ensemble Statistics Bias Visual Working Memory
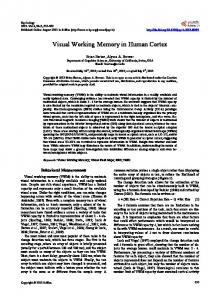
Fig. 1. Example pair of matched displays from Experiment 1. Observers had to remember the size of the red and blue circles and ignore the green circles. After each trial, they were tested on the size of a single circle using a recall procedure. The two displays in a matched pair had the same items, but the colors of the tested item (here, the circle second from the left on the bottom) and another item (the circle at the bottom left) were swapped between the displays. Note that the size of the circles is not to scale in order to more clearly show the properties of the displays.
existing models of visual working memory, items are not recalled as independent units; instead, an item’s reported size is constructed by combining information about that specific item with information about the set of items at multiple levels of abstraction.
Experiment 1: Ensemble Statistics Bias Size Memory We examined whether the ensemble statistics of a display would bias memory for individual items when observers attempted to remember the size of multiple colored circles. We hypothesized that in the case of displays with both small red circles and large blue circles, observers would tend to report the size of a particular circle as larger if it was blue than if it was red. Such a size bias would suggest that observers had taken into account the size of the items in each color set.
Method Observers. Twenty-one observers were recruited and run using Amazon Mechanical Turk (https://www.mturk.com). All were from the United States, gave informed consent, and were paid $0.40 for approximately 3 min of their time. Procedure. All observers were presented with the same 30 displays consisting of three red, three blue, and three green circles of varying size (see Fig. 1) and were told to remember the size of all of the red and blue circles, but to ignore the green circles. We included the green distractor items in the displays because we believed they would encourage observers to encode the items by color, rather than to select all of the items into memory at once (Halberda, Sires, & Feigenson, 2006; Huang, Treisman, & Pashler, 2007). The order of the 30 displays was randomized across observers. Each display appeared for 1.5 s and was followed by a 1-s blank, after which a single
randomly sized circle reappeared in black at the location that a red or blue circle had occupied. Observers had to slide the computer mouse up or down to resize this new black circle to the size of the red or blue circle they had previously seen at that location; they then clicked to lock in their answer and start the next trial. Stimuli. The nine circles appeared on a gray background that measured 600 × 400 pixels. Each circle was positioned at a random location within an invisible 6 × 4 grid; jitter of ±10 pixels was added to the circles’ locations to prevent collinearities. The size and resolution of observers’ computer monitors were not controlled. However, all observers attested to the fact that the displays were visible in their entirety. Moreover, the critical comparisons are within subjects, and individual differences in absolute size of the displays are factored out by focusing on within-subjects comparisons between conditions. Circle sizes were drawn from a separate normal distribution for each color. The mean diameter for the circles of a given color was chosen uniformly on each trial from the interval (15 pixels, 95 pixels), and the diameter of each individual circle was then chosen from a normal distribution with this mean and a standard deviation equal to one eighth of this mean. Thus, on a given trial, the three red circles could be sampled from around 35 pixels, the blue circles from around 80 pixels, and the green circles from around 20 pixels. However, which color set was largest and which was smallest was chosen randomly on each trial; thus, on the next trial, it could be the green circles that were largest and the blue circles that were smallest. So that we could directly test the hypothesized bias in reported size, we generated 15 matched pairs of displays. First, 15 displays were generated as described; then, another 15 were created by switching the color of the to-be-tested item to the other nondistractor color (and making the reverse switch for another circle, so that there would still be three red circles and three blue circles in the display). Thus, the displays in
386
Brady, Alvarez
a Presented Size
Pr es Re ent d ed
Mean Size of Red Dots
Mean Size of Blue Dots
Tested Item
Pr
Bias 1.15 Toward Mean 1.10
es Bl ent ue ed
Reported Size
Bias =
b
1.05 1.00 0.95
Reported Size When Presented Blue Reported Size When Presented Red
Bias Away From Mean
1
2a
2b
Experiment
0.90 0.85
Fig. 2. Bias in size estimates in the three experiments. The illustration in (a) shows how bias was calculated from a pair of matched displays. We measured whether observers reported different sizes for the tested circle when it was red versus when it was blue (the circle was in fact the same size in both presentations). In this example, the blue circles were larger than the red circles on average, and the reported sizes of the tested circle are indicative of bias. Which color was used for the larger circles was counterbalanced across trials in the actual experiment. Because bias was always calculated by dividing the size reported for tested items presented in the color of the larger circles by the size reported for tested items presented in the color of the smaller circles, a ratio greater than 1.0 indicated bias toward the mean size of the same-colored circles. The graph (b) shows participants’ mean bias in Experiment 1, in which color was task relevant, and in Experiments 2a and 2b, in which color was task irrelevant. Error bars represent ±1 SEM.
each of the pairs were matched in the size of all of the circles present and differed only in the color of two circles, including the circle that would later be tested. The 30 displays were randomly interleaved, with the constraint that paired displays could not appear one after the other. By comparing reported size when the tested item was one color with reported size when it was another color, we were able to directly test the hypothesis that observers’ memory for size is biased toward the mean size of all items in the tested item’s color set.
Results Overall accuracy. We first assessed whether observers were able to accurately perform the size memory task by comparing their performance with an empirical measure of chance performance obtained by randomly pairing a given observer’s responses with the correct answers from different trials (mean difference by chance = 30.5 pixels, SEM = 0.78 pixels). Observers’ average error was 16.4 pixels (SEM = 1.7 pixels), a level of performance that was significantly better than our measure of chance, p < 10−9. Bias from same-colored circles. To test our main hypothesis, we examined whether observers’ size estimates tended to be biased toward the size of the circles with the same color as the tested circle. We divided each matched pair on the basis of which of the pair contained a tested item the same color as the circles that were smaller on average and which contained a tested item the same color as the circles that were larger on
average. We then divided reported sizes on the latter trials by reported sizes on the former trials. A ratio of 1.0 would indicate that observers were not biased. However, if observers’ size estimates were biased toward the mean size of the circles in the same color as the tested item, this ratio would be greater than 1.0 (see Fig. 2a). On average, the reported size of the tested circle was 1.11 times greater (SEM = 0.03) on trials with the larger samecolored circles than on trials with the smaller same-colored circles (see Fig. 2b). This ratio was significantly greater than 1.0, t(20) = 4.17, p = .0004. In addition, the direction of the effect was highly consistent across observers, with 19 of the 21 observers having a ratio above 1.0. The maximum possible bias was 1.6, because the larger same-colored circles were on average 1.6 times larger than their matched counterparts. Thus, the observers reported a size 18% of the way between the correct size and the mean size of the same-colored circles. This effect was a result of memory and not a perceptual bias, because in a version of the experiment with a precue indicating which item would be tested, observers (N = 22) reported the size accurately (mean error = 6.4 pixels, SEM = 0.5 pixels) and with no bias toward the mean size of the same-colored circles (bias = 1.00, SEM = 0.01; for details, see Perceptual Effects in the Supplemental Material available online). Model: optimal integration across different levels of abstraction. One interpretation of the data is that observers represented the displays at multiple levels of abstraction and integrated across these levels when retrieving the size of the
387
Ensemble Statistics Bias Visual Working Memory
Larger Same-Colored Circles
b
Smaller Same-Colored Circles
120
120
100
100
Reported Size (pixels)
Reported Size (pixels)
a
80 60 40
60 40 20
20 0
80
0
20
40
60
80
100
120
Correct Size (pixels)
0
0
20
40
60
80
100
120
Correct Size (pixels)
Fig. 3. Comparison of the behavioral data from Experiment 1 and predictions of the optimal integration model described in the text. The graph in (a) shows the data from Experiment 1, averaged across observers so that each display is represented by a single point. The graph in (b) shows the predictions from the model, which integrates information from multiple levels of abstraction (with SD = 25 pixels). Data and predictions are shown separately for displays in which the tested circle was the same color as the circles that were smaller on average and displays in which the tested circle was the same color as the circles that were larger on average.
tested circle or when initially encoding its size. To more directly test this idea, we formalized how observers might represent a display hierarchically using a probabilistic model (for similar models, see Hemmer & Steyvers, 2009; Huttenlocher, Hedges, & Vevea, 2000). The model had three levels of abstraction, representing particular circles, all circles of a given color, and all circles in the entire display. In the model, observers encoded a noisy sample of the size of each individual circle, and the size of each circle was itself considered a noisy sample from the expected size of the circles of that color, which was itself considered a sample of the expected size of the circles in a given display. We asked what observers ought to report as their best guess about the size of the tested circle (assuming normal distributions at each level). The intuition this model represents is fairly straightforward: If the red circles in a particular display are all quite large, but the observer encodes a fairly small size for one of them, it is more likely that this circle is a large circle the observer accidentally encoded as too small than that it is a small circle the observer accidentally encoded as too large. Thus, in general, the model suggests that the optimal way to minimize errors in responses is to be biased slightly (either when encoding the circles or when retrieving their size) toward the mean of both the set of circles of the same color as the tested circle and the overall mean of the display. Figure 3 presents predictions of this model, along with a corresponding
representation of the behavioral data from Experiment 1 (for information on model implementation, see Optimal Observer Model in the Supplemental Material available online). Note that in both the observers’ data and the model predictions, the slopes of the lines indicate a bias toward reporting all circles as less extreme in size then they really were, and also note that the plotted points indicate a bias toward reporting a size similar to the size of the same-colored circles. The model had a single free parameter, which indicated how noisy the encoding of a given circle was (the standard deviation of the normal distribution from which the encoded size was sampled) and thus how biased toward the means observers’ size estimates ought to be. We set this parameter to 25 pixels (the estimated standard deviation of errors collapsing across all observers and displays), rather than maximizing the fit to the data. Although not strictly independent of the data being fit, this method of choosing the value for the parameter is not based on the measures we used to assess the model. In general, the model provided a strong fit to the data as assessed by two different metrics: First, the model predicted the difference between the correct answer and reported answer for each display, ignoring the paired structure of the displays (r = .89, p < .0001). Second, the model predicted the difference in reported size between matched displays (r = .82, p < .001), even though the tested circle was actually the same size within each such pair. Any model of working memory that treats items
388 as independent (e.g., most slot and resource models, including the mathematical model presented by Zhang & Luck, 2008) cannot predict a systematic difference between these trials.
Discussion We found that observers are biased by the ensemble statistics of a display when representing display items in visual working memory. In the case of displays with circles of several different colors, observers’ reports of the size of a given circle are biased by the size of the other circles of the same color. This effect is not accounted for by perceptual biases or location noise or by incorrectly reporting the wrong item from the display (see Potential Reports of the Incorrect Item in the Supplemental Material), is not a result of guessing on the basis of the mean size of the circles of that color (see Comparison to an Across-Trial Guessing Model in the Supplemental Material), and is compatible with a simple Bayesian model in which observers integrate information at multiple levels of abstraction to form a final hypothesis about the size of the tested item.
Experiments 2a and 2b: Attention to Color Is Required In Experiment 1, the color of the items was task relevant. In fact, because observers have difficulty attending to more than a single color at a time (Huang et al., 2007), observers in Experiment 1 likely had to separately encode the sizes of the red circles and the sizes of the blue circles, and this might have increased the salience of color grouping. Salience of color as a grouping dimension may have been a crucial part of why observers used the mean size of the circles that were the same color as the tested circle in guiding their memory retrieval. Thus, in Experiments 2a and 2b, we removed the green circles from the displays and asked observers to simply remember the sizes of all of the circles. This allowed us to evaluate the automaticity of the biases we observed in Experiment 1—for example, the extent to which they depend on attentional selection and strategy. In addition, Experiments 2a and 2b provided a control for low-level factors that could have influenced the results of Experiment 1.
Method Twenty-five new observers completed Experiment 2a, and 20 different observers completed Experiment 2b. The methods and 30 displays used in Experiment 2a were the same as in Experiment 1 except that the green circles used as distractor items were not present in the displays. Experiment 2b was identical to Experiment 2a except that the circles were shown for only 350 ms rather than 1.5 s in order to decrease observers’ performance to the same level as in Experiment 1.
Brady, Alvarez
Results Experiment 2a. Observers’ performance in Experiment 2a was very good. The average error was 10.2 pixels (SEM = 0.60 pixels), which was significantly less than our empirical measure of chance (29 pixels, SEM = 0.28 pixels) p < 10−19, and significantly less than the error of subjects in Experiment 1, t(44) = 3.73, p < .001. Observers in Experiment 2a displayed no bias as a function of color. The mean bias of 0.99 (SEM = 0.01) was not significantly different from 1.0, t(24) = –0.86, p = 0.39 (see Fig. 2b). This result is compatible with the idea that the size of the same-colored circles does not bias observers’ estimates of the tested circle’s size when color is not task relevant. However, the observers in Experiment 2a had significantly lower error rates than the observers in Experiment 1. Thus, it is possible that the observers in Experiment 2a did not display a bias because they were able to encode all of the circles accurately as individuals. To initially examine this possibility, we compared the least accurate 50% of observers in Experiment 2a with the most accurate 50% of observers in Experiment 1. The error rates reversed (Experiment 1: mean error = 10 pixels; Experiment 2a: mean error = 13 pixels), yet the bias remained present only in Experiment 1 (Experiment 1: 1.07; Experiment 2a: 1.00). This provided preliminary evidence that the difference in accuracy between the two experiments did not drive the difference in bias. Experiment 2b: overall accuracy and bias. Experiment 2b experimentally addressed the concern that the lack of bias among observers in Experiment 2a was driven by their high performance level. In Experiment 2b, display time was reduced from 1.5 s to 350 ms to increase the error rate while maintaining the task irrelevance of color. Observers in Experiment 2b had an error rate of 15.9 pixels on average (SEM = 2.25 pixels). This was significantly less than our empirical measure of chance (31.3 pixels, SEM = 1.13 pixels), p < 10−9, but not significantly less than the error rate of subjects in Experiment 1, t(39) = –0.17, p = .86. Thus, Experiment 1 and Experiment 2b were equated on error rate. However, observer’s reports of the size of the tested circles in Experiment 2b were still not biased toward the size of the same-colored circles (M = 1.00, SEM = 0.01). Optimal integration model. We applied the same model used in Experiment 1 to the data from Experiment 2b, but with only two levels (no grouping by color): information about the particular circle and information about all the circles in the display. This model once again provided a strong fit to the experimental data (Fig. 4). Because the model did not use color information, it predicted exactly the same performance for both trials within each matched pair. This prediction is in line with
389
Ensemble Statistics Bias Visual Working Memory
Larger Same-Colored Circles
b
Smaller Same-Colored Circles
120
120
100
100
Reported Size (pixels)
Reported Size (pixels)
a
80 60 40 20 0
80 60 40 20
0
20
40
60
80
100
120
Correct Size (pixels)
0
0
20
40
60
80
100
120
Correct Size (pixels)
Fig. 4. Comparison of the behavioral data from Experiment 2b and predictions of the optimal integration model described in the text. The graph in (a) shows the data from Experiment 2b, averaged across observers so that each display is represented by a single point. The graph in (b) shows the predictions from the model, which integrates information from multiple levels of abstraction (with SD = 25 pixels). Data and predictions are shown separately for displays in which the tested circle was the same color as the circles that were smaller on average and displays in which the tested circle was the same color as the circles that were larger on average.
the observed bias of 1.00 in the experimental data. Furthermore, the model predicted the overall bias toward the mean size of the circles in the display, and its predictions correlated with the errors people made across all trials, r = .53, p = .002.
Discussion In Experiments 2a and 2b, in which color was not task relevant, observers did not display a bias toward the mean size of the same-colored circles, even when the experiment was equated with Experiment 1 on difficulty. However, in both Experiment 2a and Experiment 2b, observers’ estimates were still biased toward the mean size of the circles in the display overall. The data are compatible with a Bayesian model in which observers treat all items as coming from a single group, rather than breaking the items into separate groups by color. Furthermore, the results of these experiments help rule out possible confounds in Experiment 1, such as the possibility that location noise caused swapping of items in memory, as the displays used in Experiments 2a and 2b were exactly the same as those used in Experiment 1 except for the absence of irrelevant green circles. We have also run Experiments 1 and 2a as separate conditions in a single within-subjects experiment and replicated the finding of a bias only when displays included the green circles (see Replication and a Within-Subject Experiment in the Supplemental Material).
General Discussion We found that observers are biased by the ensemble statistics of a display when representing items in visual working memory. When asked to report the size of an individual circle, observers tended to report it as larger if the other items in the same color were large and smaller if the other items in the same color were small. This bias was reliable across observers and was predicted by a simple Bayesian model that encodes a display at multiple levels of abstraction. Taken together, our findings suggest that items in visual working memory are not represented independently and, more broadly, that visual working memory is susceptible to the very same hallmarks of constructive memory that are typical of long-term memory (Bartlett, 1932).
Representation of ensemble statistics It is well established that the visual system can efficiently compute ensemble statistics (e.g., Alvarez & Oliva, 2009; Ariely, 2001; Chong & Treisman, 2003) and does so even when this is not required by the task, causing, for example, a false belief that an item with a set’s mean value of an attribute was present (de Fockert & Wolfenstein, 2009; Haberman & Whitney, 2009). However, less work has explored why the visual system represents ensemble statistics. One benefit of ensemble representations is that they can be highly accurate, even when the
390 local measurements constituting them are very noisy (Alvarez & Oliva, 2008, 2009). Another possible benefit of ensemble representations is that they can be used to identify outliers in a display (Rosenholtz & Alvarez, 2007), and thus potentially guide attention to items that cannot be incorporated in the summary for the rest of the group (Brady & Tenenbaum, 2010; Haberman & Whitney, 2009). The current work suggests a new use of ensemble statistics: Such statistics can increase the accuracy with which items are stored in visual working memory, reducing uncertainty about the size of individual items by optimally combining item-level information with ensemble statistics at multiple levels of abstraction. It is interesting that observers in our experiments used the mean size of the circles of specific colors to reconstruct the displays only when color was task relevant, despite the fact that using this statistic would improve memory for the individual items in all conditions. This could suggest that the units over which such ensemble statistics are computed is limited by selective attention (e.g., Chong & Treisman, 2005a). Turk-Browne, Jungé, and Scholl (2005) suggested that statistical learning, a form of learning about sequential dependencies, may happen automatically, but that the particular sets over which the statistics are computed may be controlled by selective attention. This hypothesis is compatible with our current findings: When observers did not attend to the colored sets as separate units, they may not have computed separate summary statistics for the two colored sets (alternatively, separate summary statistics may have been encoded, but not used in reconstructing the circle sizes). However, when observers attended to color, the ensemble statistics for the two colors seem to have been computed in parallel, as found by Chong and Treisman (2005b).
Dependence between items in visual working memory Our results demonstrate a case of nonindependence between items in visual working memory: We found that items are represented not just individually, but also as a group or ensemble. Although previous experiments did not directly address such hierarchical effects, nonindependence between items in visual working memory has been observed previously. For example, Huang and Sekuler (2010) found that observers exhibit bias in reporting the spatial frequency of Gabor patches, tending to report spatial frequencies as though they have been pulled toward the spatial frequencies of previously presented Gabor patches. In addition, Jiang, Olson, and Chun (2000) have shown that changing the spatial context of an item influences memory for that item (see also Vidal, Gauchou, Tallon-Baudry, & O’Regan, 2005). This suggests that an item is not represented independently of its spatial context in working memory. Similarly, several studies (Brady & Tenenbaum, 2010; Sanocki, Sellers, Mittelstadt, & Sulman, 2010; Victor & Conte, 2004) have shown that observers can take advantage of perceptual regularities in working memory displays to remember more individual items from those displays. Brady and
Brady, Alvarez Tenenbaum (2010) investigated checkerboard-like displays and conceptualized their findings in terms of hierarchical encoding, in which the gist of the display is encoded in addition to specific information about a small number of items that are least consistent with the gist. This hypothesis is compatible with the model we presented here for simpler displays, according to which observers encode ensemble information as well as information about specific items. This dependence between items in memory is not predicted or explained by influential models of visual working memory. Current theories model visual working memory as a flexible resource that is quantized into slots (Zhang & Luck, 2008) or continuously divisible (Alvarez & Cavanagh, 2004; Bays & Husain, 2008; Wilken & Ma, 2004). According to these models, fewer items can be remembered with higher precision because they receive more memory resources. However, these models assume that items are stored independently, and therefore cannot account for the dependence between items in memory observed in the current study. Expanding these models to account for the current results will require specification of whether abstract levels of representation compete for the same resources as item-level representations (e.g., Feigenson, 2008), or whether there are essentially separate resources for ensemble representations and item-level representations (e.g., Brady & Tenenbaum, 2010).
Role of long-term memory in visual working memory In addition to work demonstrating dependencies between stored representations of items and hierarchical encoding of a particular display, there is a significant amount of previous work showing that the representation of items in visual working memory depends on information in long-term memory (e.g., Brady, Konkle, & Alvarez, 2009). For instance, Konkle and Oliva (2007) and Hemmer and Steyvers (2009) have shown that knowledge of the size of an object in the real world biases the remembered size of that object in a display after a short delay. Hemmer and Steyvers (2009) provided a model of this effect as due to Bayesian inference in a constructive memory framework, and their model is similar to the one we proposed here for the on-line representation of the displays in our experiments. Convergence between a model for using ensemble information from the current display and a model for integrating information from the current display with information from long-term memory suggests a promising future direction for understanding the use of higher-order information in memory.
Conclusion We found that observers are biased by the ensemble statistics of a display when representing items from that display in visual working memory. Rather than storing items independently, observers seem to construct the size of an individual item using information from multiple levels of abstraction. Thus, despite
Ensemble Statistics Bias Visual Working Memory the active maintenance processes involved in visual working memory, it appears to be susceptible to the very same hallmarks of constructive memory that are typical of retrieval from longterm memory and scene recognition (Bartlett, 1932; Lampinen et al., 2001). Cognitive and neural models of visual working memory need to be expanded to account for such constructive, hierarchical encoding processes. Acknowledgments For helpful conversation and comments on earlier drafts, we thank Talia Konkle, Adena Schachner, Josh Tenenbaum, and Aude Oliva.
Declaration of Conflicting Interests The authors declared that they had no conflicts of interest with respect to their authorship or the publication of this article.
Funding This research was supported by National Institute of Mental Health Grant R03-MH086743 to G.A.A. and by a National Science Foundation graduate research fellowship to T.F.B.
Supplemental Material Additional supporting information may be found at http://pss.sagepub .com/content/by/supplemental-data
Note 1. See Hollingworth (2008) for studies that employed real-world scenes.
References Alvarez, G.A., & Cavanagh, P. (2004). The capacity of visual shortterm memory is set both by visual information load and by number of objects. Psychological Science, 15, 106–111. Alvarez, G.A., & Oliva, A. (2008). The representation of simple ensemble visual features outside the focus of attention. Psychological Science, 19, 392–398. Alvarez, G.A., & Oliva, A. (2009). Spatial ensemble statistics: Efficient codes that can be represented with reduced attention. Proceedings of the National Academy of Sciences, USA, 106, 7345–7350. Ariely, D. (2001). Seeing sets: Representation by statistical properties. Psychological Science, 12, 157–162. Bartlett, F. (1932). Remembering: A study in experimental and social psychology. New York, NY: Macmillan. Bays, P.M., Catalao, R.F.G., & Husain, M. (2009). The precision of visual working memory is set by allocation of a shared resource. Journal of Vision, 9(10), Article 7. Retrieved from http://journal ofvision.org/9/10/7/ Bays, P.M., & Husain, M. (2008). Dynamic shifts of limited working memory resources in human vision. Science, 321, 851. Brady, T.F., Konkle, T., & Alvarez, G.A. (2009). Compression in visual short-term memory: Using statistical regularities to form more efficient memory representations. Journal of Experimental Psychology: General, 138, 487–502.
391 Brady, T.F., & Tenenbaum, J.B. (2010). Encoding higher-order structure in visual working memory: A probabilistic model. In S. Ohlsson & R. Catrambone (Eds.), Proceedings of the 32nd Annual Conference of the Cognitive Science Society (pp. 411–416). Portland, OR: Cognitive Science Society. Chong, S.C., & Treisman, A. (2003). Representation of statistical properties. Vision Research, 43, 393–404. Chong, S.C., & Treisman, A. (2005a). Attentional spread in the statistical processing of visual displays. Perception & Psychophysics, 67, 1–13. Chong, S.C., & Treisman, A. (2005b). Statistical processing: Computing the average size in perceptual groups. Vision Research, 45, 891–900. de Fockert, J., & Wolfenstein, C. (2009). Rapid extraction of mean identity from sets of faces. Quarterly Journal of Experimental Psychology, 62, 1716–1722. Feigenson, L. (2008). Parallel non-verbal enumeration is constrained by a set-based limit. Cognition, 107, 1–18. Haberman, J., & Whitney, D. (2007). Rapid extraction of mean emotion and gender from sets of faces. Current Biology, 17, R751–R753. Haberman, J., & Whitney, D. (2009). The visual system ignores outliers when extracting a summary representation [Abstract]. Journal of Vision, 9(8), Article 804. Retrieved from http://www .journalofvision.org/content/9/8/804 Halberda, J., Sires, S.F., & Feigenson, L. (2006). Multiple spatially overlapping sets can be enumerated in parallel. Psychological Science, 17, 572–576. Hemmer, P., & Steyvers, M. (2009). Integrating episodic memories and prior knowledge at multiple levels of abstraction. Psychonomic Bulletin & Review, 16, 80–87. Hollingworth, A. (2008). Visual memory for natural scenes. In S.J. Luck & A. Hollingworth (Eds.), Visual memory (pp. 123–162). New York, NY: Oxford University Press. Huang, J., & Sekuler, R. (2010). Distortions in recall from visual memory: Two classes of attractors at work. Journal of Vision, 10(2), Article 24. Retrieved from http://www.journalofvision.org/ content/10/2/24.full Huang, L., Treisman, A., & Pashler, H. (2007). Characterizing the limits of human visual awareness. Science, 317, 823–825. Huttenlocher, J., Hedges, L.V., & Vevea, J.L. (2000). Why do categories affect stimulus judgment? Journal of Experimental Psychology: General, 129, 220–241. Jiang, Y., Olson, I.R., & Chun, M.M. (2000). Organization of visual short-term memory. Journal of Experimental Psychology: Learning, Memory, and Cognition, 26, 683–702. Johnson, J.S., Spencer, J., Luck, S., & Schöner, G. (2009). A dynamic neural field model of visual working memory and change detection. Psychological Science, 20, 568–577. Konkle, T., & Oliva, A. (2007). Normative representation of objects: Evidence for an ecological bias in object perception and memory. In D.S. McNamara & J.G. Trafton (Eds.), Proceedings of the 29th Annual Meeting of the Cognitive Science Society (pp. 407–413). Austin, TX: Cognitive Science Society. Lampinen, J.M., Copeland, S., & Neuschatz, J.S. (2001). Recollections of things schematic: Room schemas revisited. Journal of
392 Experimental Psychology: Learning, Memory, and Cognition, 27, 1211–1222. Lin, P.-H., & Luck, S.J. (2008). The influence of similarity on visual working memory representations. Visual Cognition, 17, 356–372. Luck, S.J., & Vogel, E.K. (1997). The capacity of visual working memory for features and conjunctions. Nature, 390, 279–281. Oliva, A. (2005). Gist of the scene. In L. Itti, G. Rees, & J.K. Tsotsos (Eds.), The encyclopedia of neurobiology of attention (pp. 251– 256). San Diego, CA: Elsevier. Parkes, L., Lund, J., Angelucci, A., Solomon, J.A., & Morgan, M. (2001). Compulsory averaging of crowded orientation signals in human vision. Nature Neuroscience, 4, 739–744. Rosenholtz, R., & Alvarez, G.A. (2007) How and why we perceive sets: What does modeling tell us? [Abstract]. Perception, 36(ECVP Abstract Supplement), 8. Retrieved from http://www .perceptionweb.com/ecvp/ecvp07.pdf Rouder, J.N., Morey, R.D., Cowan, N., Zwilling, C.E., Morey, C.C., & Pratte, M.S. (2008). An assessment of fixed-capacity models of
Brady, Alvarez visual working memory. Proceedings of the National Academy of Sciences, USA, 105, 5975–5979. Sanocki, T., Sellers, E., Mittelstadt, J., & Sulman, N. (2010). How high is visual short term memory capacity for object layout? Attention, Perception, & Psychophysics, 72, 1097–1109. Turk-Browne, N.B., Jungé, J.A., & Scholl, B.J. (2005). The automaticity of visual statistical learning. Journal of Experimental Psychology: General, 134, 552–564. Victor, J.D., & Conte, M.M. (2004). Visual working memory for image statistics. Vision Research, 44, 541–556. Vidal, J.R., Gauchou, H.L., Tallon-Baudry, C., & O’Regan, J.K. (2005). Relational information in visual short-term memory: The structural gist. Journal of Vision, 5(3), Article 8. Retrieved from http://journalofvision.org/5/3/8/ Wilken, P., & Ma, W.J. (2004). A detection theory account of change detection. Journal of Vision, 4(12), Article 11. Retrieved from http://www.journalofvision.org/content/4/12/11/ Zhang, W., & Luck, S.J. (2008). Discrete fixed-resolution representations in visual working memory. Nature, 452, 233–235.