Journal of Abnormal Psychology 2006, Vol. 115, No. 4, 658 – 673
Copyright 2006 by the American Psychological Association 0021-843X/06/$12.00 DOI: 10.1037/0021-843X.115.4.658
Intact Attentional Control of Working Memory Encoding in Schizophrenia James M. Gold, Rebecca L. Fuller, Benjamin M. Robinson, and Robert P. McMahon
Elsie L. Braun and Steven J. Luck University of Iowa
University of Maryland School of Medicine This study reports evidence that individuals with schizophrenia (SC) demonstrate intact attentional selection for visual working memory (WM) storage. A group of 62 participants with SC and 55 control participants without SC were studied in a series of 5 experiments that examined the ability to use top-down and bottom-up cues to guide WM encoding, as well as the ability to spontaneously select a subset of representations for storage. Participants with SC exhibited a consistent and robust ability to use selective attention in the control of WM in all 5 experiments, demonstrating a remarkable island of preserved functioning given the broad spectrum of impairments of attention and WM that have been widely reported in those with SC. These findings indicate that attention is not globally impaired in SC and make it possible to delineate more precisely the nature of the specific impairment of attention in this disorder. Keywords: schizophrenia, selective attention, working memory, attentional control
and attentional impairments may interact with, or perhaps even underlie, the reported impairments in WM. Specifically, attention plays a critical role in the selection and transfer of task-relevant perceptual representations into WM, and the efficient use of WM depends on the effective use of attention. Early evidence that selective attention can guide WM encoding was presented in the iconic memory experiments of Sperling (1960) and Averbach and Coriel (1961), who demonstrated that attention-directing cues could influence which pieces of information were retained from brief visual displays. The fact that cues presented shortly after the offset of target arrays could guide selection in these studies provided early evidence that attention operates at a late, postperceptual stage of processing in this type of task. Recent work has shown that top-down as well as bottom-up cues can influence the selective transfer of representations into WM (Schmidt, Vogel, Woodman, & Luck, 2002; Vogel, Woodman, & Luck, in press-a; Woodman, Vecera, & Luck, 2003). Thus, WM encoding can be under volitional control, guided by the goals of the participant, or influenced by highly salient perceptual features that capture attention in a relatively automatic fashion. The demand for attentional control processes is particularly important when the environment presents more information than can be stored in WM. In such a circumstance, the challenge is to maximize the use of available storage capacity. We and others have shown that healthy participants are able to select 3 or 4 items from such supercapacity arrays, demonstrating consistent nearcapacity levels of storage even in the face of increasing array sizes (Cowan et al., 2005; Gold, Wilk, McMahon, Buchanan, & Luck, 2003; Luck & Vogel, 1997; Vogel, Woodman, & Luck, 2001). If attention serves this critical function of biasing selection to a subset of items from supercapacity arrays, failures in attentional control should have distinctive performance signatures. When confronted by supercapacity arrays where only some items are task relevant, attentional failures should be evident in the encoding of irrelevant items at the expense of relevant items, a mismanagement of WM resources. Alternately, when confronted by a supercapacity array of items that are not separable on the basis of goals or
Nearly every model of working memory (WM) emphasizes two critical features of the system. First, there is widespread agreement that the storage capacity of the WM system is sharply limited, a notion elaborated by George Miller in his landmark article on the magic number seven (plus or minus two; G. A. Miller, 1956). More contemporary estimates of WM capacity vary somewhat across modalities and stimulus types but are typically considerably lower (on the order of three or four items) than originally proposed by Miller (see discussions in Cowan, 2001). Second, nearly every large-scale model of cognition suggests that activation and maintenance of WM representations is critical for multiple complex cognitive operations, ranging from language comprehension, to problem solving, to cognitive control (Miyake & Shah, 1999). Thus, efficient use of limited WM resources in the service of information processing is necessary to ensure successful performance in multiple cognitive domains. Conversely, impairment in the efficient use of WM resources would be expected to produce widespread performance deficits. Because schizophrenia (SC) impacts performance in a wide variety of cognitive domains, researchers have found the idea of a WM deficit in SC to be an attractive explanatory hypothesis (Barch, 2005; Gold, Carpenter, Randolph, Goldberg, & Weinberger, 1997; Keefe, 2000). Impairments in attention have also been widely hypothesized as a core cognitive deficit in SC (Bleuler, 1911/1950; Zubin, 1975), James M. Gold, Rebecca L. Fuller, Benjamin M. Robinson, and Robert P. McMahon, Maryland Psychiatric Research Center, University of Maryland School of Medicine; Elsie L. Braun and Steven J. Luck, Department of Psychology, University of Iowa. This research was supported in part by National Institute of Mental Health Grants MH65034 and MH06850 and by University of Maryland General Clinical Research Center Grant M01-RR-16500, funded by the National Institutes of Health. We gratefully acknowledge the study coordination and participant testing contributions of Christopher Wilk and Pablo Diego. Correspondence concerning this article should be addressed to James M. Gold, Maryland Psychiatric Research Center, P.O. Box 21247, Baltimore, MD 21228. E-mail:
[email protected] 658
ATTENTIONAL CONTROL OF WORKING MEMORY
perceptual salience, attentional failure should be evident as a reduction in the total number of items that are successfully encoded. That is, trying to store too many items in WM should result in high levels of interference, thereby producing poor performance. An attentional account of the WM impairments observed in SC is attractive given the deficits documented in the literature. First, individuals with SC demonstrate deficits across multiple stimulus types (words, tones, locations, visual objects, etc.), suggesting impairments at an amodal stage of processing (for a review, see Lee & Park, 2005). Second, impairments have been consistently documented at very short retention intervals, with inconsistent evidence that the magnitude of impairment is substantially amplified by increasing retention intervals in simple storage tasks, suggesting a major locus of impairment in the initial encoding of information into WM (Javitt, Strous, Grochowski, Ritter, & Cowan, 1997; Lencz et al., 2003;Tek et al., 2002; for a review, see Lee & Park, 2005). We recently reported evidence that WM encoding processes are vulnerable to interference from masks for an abnormally prolonged duration, direct evidence of a deficit in encoding (Fuller, Luck, McMahon, & Gold, 2005). Third, those with SC show impairments at subcapacity loads (e.g., remembering the color or orientation of a single object) as well as an increasing magnitude of impairment at higher loads, suggesting a combination of poor utilization of available capacity as well as a possible diminution of total capacity (Park & Holzman, 1992; Perlstein, Carter, Noll, & Cohen, 2001). All three of these basic findings can be rather easily accounted for by a failure in the use of attention to selectively encode task-relevant information and effectively gate access to WM storage in the face of supercapacity task demands. There is some evidence supporting this hypothesis in the literature. We previously found that individuals with SC demonstrated increasing levels of deficit when faced with supercapacity arrays that placed a demand on selective attention to avoid interference between competing items (Gold et al., 2003). Specifically, control participants demonstrated a stable level of WM storage when faced with four-item and six-item arrays, whereas storage for those with SC actually decreased at a set size of six relative to a set size of four. Using auditory digit stimuli, Weiss, Vrtunski, and Simpson (1988) reported that individuals with SC demonstrated a pattern of severely disrupted recall (recalling fewer than three items) when confronted by increasing list lengths, suggesting that they were unable to effectively filter a subset of items to recall when confronted by a supercapacity load. In the series of five experiments presented here, we examined the hypothesis that SC involves an impairment in the use of attention to select information for WM storage and the possibility that failures of selective attention are responsible for WM impairment in those with SC. The experiments included conditions in which selection was guided by symbolic spatial cues, by perceptually salient peripheral spatial cues, and by verbal instructions to select items on the basis of color or object form. We also examined the ability of participants to spontaneously select items when faced with supercapacity arrays. We predicted that participants with SC would show failures in selection, producing two distinctive patterns of results. First, when selection was guided by cues, we expected that participants with SC would not select efficiently, resulting in decreased storage of validly cued, relevant information coupled with a paradoxical increased storage of invalidly cued information. In the absence of cues, we expected that storage of
659
participants with SC would decrease as the demands for attention increased in the face of increasingly supercapacity loads. Surprisingly, these predictions were not supported by the data from the experiments described here. Instead, participants with SC showed a remarkably intact ability to selectively encode relevant information into visual WM. This result was quite unexpected. Indeed, the fact that we were motivated to conduct five experiments examining this issue reflects the degree to which we had considered the hypothesis of an SC-related deficit in these processes to be nearly inescapable given other evidence of impaired top-down attentional control in the illness. The data reported here should provide important constraints in formulating the nature of attentional impairments in SC.
General Method: Participant Characteristics We used the same basic participant recruitment approaches and inclusion/exclusion criteria for all of the experiments in this study. A total of 62 SC spectrum individuals participated in one or more experiments. All were clinically stable outpatients recruited from the Outpatient Research Program of the Maryland Psychiatric Research Center. All patients met Diagnostic and Statistical Manual of Mental Disorders (4th ed.; DSM–IV; American Psychiatric Association, 1994) diagnostic criteria for SC or schizoaffective disorder as determined by the Structured Clinical Interview for DSM–IV Axis I Disorders, past medical records, and clinician reports (First, Spitzer, Miriam, & Williams, 1997a). At time of testing, participants with SC had been on stable medications (same type and dose) for a minimum of 4 weeks and were judged to be in a stable state by referring clinicians. None of the SC participants had been hospitalized in the months prior to study participation. SC participants were receiving a wide array of antipsychotic medications including, most frequently, clozapine (n ⫽ 22), olanzapine (n ⫽ 19), risperidone (n ⫽ 7), or one of the other secondgeneration medications. Only a small number (n ⫽ 8) were receiving a first-generation medication. A substantial number of participants with SC were receiving more than one antipsychotic drug (n ⫽ 13; 9 of these cases were participants whose primary medication was clozapine). A substantial proportion of participants were also receiving adjunctive antidepressants (n ⫽ 20), mood stabilizers (n ⫽ 3), or anxiolytics (n ⫽ 7). A total of 54 participants without SC completed one or more experiments and acted as healthy control (HC) participants. All were recruited through newspaper advertisements except for 4 who were recruited through random digit dialing from zip codes near the Maryland Psychiatric Research Center. All were screened with the Structured Clinical Interview for DSM–IV and the Structured Clinical Interview for DSM–IV Personality Disorders (First, Spitzer, Miriam, & Williams, 1997b) and were free of a lifetime history of Axis I psychotic disorders, current Axis I disorder, as well as Axis II spectrum disorders. All participants without SC denied a family history of psychosis in first- and second-degree relatives. All participants denied a history of medical or neurological disease— including current or recent substance abuse or dependence—that would likely impact cognitive performance. All provided written informed consent after demonstrating knowledge of study procedures and risks in response to standard probe items. All participants were compensated for their participation. The sample sizes and demographic features of the study groups for each experiment are presented in Table 1, with significant between-group differences noted in the table. Across experiments, there were no significant differences in gender distribution, ethnicity distribution, or paternal education. Significant differences were observed in years of participants’ education in two of the five experiments. Note that the HC participants obtained scores on the Wide Range Achievement Test (Wilkinson, 1993) and on the Repeatable Battery for the Assessment of Neuropsychological Status (Wilk et al., 2004) that were very close to standardization sample means of 100, suggesting that they were not a supernormal group. The SC
GOLD ET AL.
660 Table 1 Demographics of the Participants in the Five Experiments Gender Experiment and group Experiment 1 SC group HC group Experiment 2 SC group HC group Experiment 3 SC group HC group Experiment 4 SC group HC group Experiment 5 SC group HC group
Ethnicity
Age
Education
Father’s educationa
WRATb
RBANS TOTc
Male
Female
CC
AA
O
M
SD
M
SD
M
SD
M
SD
M
SD
17 17
8 8
17 13
7 10
1 2
39.68 41.16
8.07 11.90
12.56 14.88
2.00** 2.03
12.86 12.73
3.94 4.11
87.68 99.89
13.48** 8.25
73.88 95.89
11.30** 8.749
8 9
4 5
9 5
2 7
1 2
45.00 43.93
7.71 7.55
12.67 13.79
2.90 1.76
12.42 12.15
3.61 3.93
89.64 97.08
15.80 11.62
74.17 92.54
12.42** 7.01
14 12
4 4
11 8
7 7
0 1
40.06 40.81
6.45 11.57
12.11 13.25
1.81 1.44
12.75 12.31
3.98 4.15
87.33 102.14
10.18** 8.34
76.22 98.14
12.30** 11.98
12 11
7 5
10 9
8 6
1 1
41.21 39.31
8.11 10.81
12.68 13.88
1.95 2.47
13.15 12.21
3.96 4.17
88.63 98.25
14.99* 10.65
73.68 96.25
12.25** 9.36
18 12
8 9
15 10
7 9
4 2
43.69 42.95
7.68 12.18
13.73 14.43
2.69 1.47
14.35 12.21
3.89 3.71
94.00 96.80
13.99 13.11
79.92 96.15
10.97** 13.27
Note. CC ⫽ Caucasian; AA ⫽ African American; O ⫽ other; WRAT ⫽ Wide Range Achievement Test; RBANS ⫽ Repeatable Battery for the Assessment of Neuropsychological Status; TOT ⫽ total score; SC ⫽ schizophrenia; HC ⫽ healthy control. a Father’s education scores missing from 8 participants in the SC group and 6 participants in the HC group. b WRAT scores missing from 2 participants in the SC group and 9 participants in the HC group. c RBANS scores missing from 1 participant in the SC group and 9 participants in the HC group. * p ⬍ .05. ** p ⬍ .01.
groups generally scored at the low end of the average range on the Wide Range Achievement Test, consistent with most reports in the literature. On the Repeatable Battery for the Assessment of Neuropsychological Status, SC participants performed significantly worse than HC participants in all five experiments, scoring between the 50th and 75th percentiles relative to a comparison group of 575 individuals with SC tested in the Baltimore area (Wilk et al., 2004), suggesting that the SC groups in these experiments are fairly representative of the local SC population likely to be recruited for study. Across groups, there was overlap in participants across several of the experiments, which were conducted over a 3-year period: 39 SC and 33 HC participants completed only one experiment, 14 SC and 10 HC participants completed two, 5 SC and 7 HC participants completed three, 2 SC and 2 HC participants completed four, and 2 SC and 2 HC participants completed all five experiments.
Experiment 1: Volitional and Automatic Attentional Selection for WM Encoding In the cognitive literature, two broad types of attentional control have been distinguished; they are often contrasted as volitional versus automatic control or by the use of the terms top-down versus bottom-up (Luck & Vecera, 2002). Fundamentally, the distinction is between selective processing guided by the abstract goals or task set of the participant versus selection guided on the basis of highly salient features of the target display that capture attention effectively, rapidly, and often involuntarily. In Experiment 1, we investigated the effectiveness of both of these types of cues to guide WM encoding, with the expectation that participants with SC might show differential impairment in the use of topdown control, an expectation based on the evidence that the illness involves a compromise of executive control (Barch, 2005). To probe the effectiveness of volitional, top-down control, a central arrow cue was used to direct spatial attention; this type of cue has frequently been used in studies of perceptual-level attention, including studies that used variants of the Posner spatial-orienting
paradigm with SC participants (Bustillo et al., 1997; Nestor et al., 1992; Posner, 1980). To probe bottom-up control, we used a simultaneous onset rectangle that contained the target stimuli. This type of cue is known to be highly effective in capturing perceptuallevel attention in healthy participants (Henderson & Macquistan, 1993; Jonides, 1981) and also leads to enhanced encoding of cued objects into WM (Schmidt et al., 2002). To isolate WM, we used a change-detection task that has been used extensively in studies of visual WM in healthy young adults (e.g., Irwin & Andrews, 1996; Luck & Vogel, 1997; Vogel, Woodman, & Luck, 2001; Wheeler & Treisman, 2002; Xu, 2002a, 2002b). In this task, participants see a sample array consisting of several colored squares, followed by a brief delay and then a test array. The sample and test arrays either are identical or differ in the color of one item, and participants make an unspeeded same– different response at the end of the trial. With an equation developed by Pashler (1988) and modified by Cowan et al. (2005), it is possible to compute how many objects worth of information from the sample array were stored in WM. In addition, by cuing a subset of the items in the sample array, it is possible to ask how well participants can selectively encode the cued items into WM (see Figure 1). Memory for the cued subset of items is more likely to be tested than memory for the uncued subset, and participants are therefore motivated to remember the cued items and not the uncued items. If the participants can use attention to control WM encoding in this manner, then they are highly accurate when memory for the cued subset is tested (called valid trials) and inaccurate when the memory for uncued subset is tested (called invalid trials). Previous studies of HC participants have demonstrated that, under appropriate conditions, the cues in this paradigm influence the transfer of perceptual representations into WM in this manner, with no influence on the initial formation of the perceptual
ATTENTIONAL CONTROL OF WORKING MEMORY
661
Figure 1. Examples of stimuli used in Experiment 1. The baseline condition is illustrated on the top row, and the different cue conditions are shown in the middle and bottom rows.
representations (Schmidt et al., 2002; Vogel, Woodman, & Luck, in press-b).
Method Task stimuli and conditions. The stimuli were presented on a 17-in. video graphics array (VGA) monitor with a gray background at a viewing distance of 79 cm. On baseline trials, participants were presented with a fixation cross for 500 ms, followed by a sample array of three colored squares in one hemifield for 200 ms. After a delay of 1,000 ms, a test array of three colored squares was presented for 3,000 ms (see Figure 1). On 50% of the trials, the color of one of the items differed between the sample and test arrays, and participants were asked to indicate whether the sample and test arrays were the same or differed by pressing one of two buttons on a handheld button box. Responses were unspeeded. A 1,000-ms intertrial interval followed each trial, with the next trial beginning with the presentation of the fixation cross. A total of 32 baseline trials were administered. Each colored square subtended 0.58° ⫻ 0.58° of visual angle and was presented at a randomly chosen location within a 7.9° ⫻ 6.1° region. The center of each square was at least 1.5° from the fixation point and from every other square. The colors within a given array were selected at random, without replacement, from the set red, blue, green, pink, yellow, white, and black. The sample and test arrays were identical, except when one of the items was changed to a new value, selected from the remaining colors in the overall color set. The central and peripheral cue trials were identical to the baseline trials, except as follows. The sample array contained a cue and six colored squares, three in each hemifield. The cue was either a black central arrow
(0.73°) pointing to the left or right visual field (central cue trials) or an outlined black rectangle (4.0° ⫻ 7.2°) that surrounded the cued side (peripheral cue trials). The test array contained the three items from one hemifield. One item in the test array differed from the sample array on 50% of trials. On 60% of trials, the cued side was tested (valid cue trials), and on 20% of trials, the opposite side was tested (invalid cue trials). On the remaining 20% of trials, both hemifields were cued (with a double arrow or rectangles surrounding both hemifields), and a randomly selected side of the array was tested (neutral cue). Participants were explicitly instructed that the cued items would be tested on most trials and that they should pay attention specifically to these items in Experiments 1– 4. The arrow and rectangle cues were presented simultaneously with the sample array and remained visible for the 200-ms duration of the sample array. In total, 160 trials were administered in both the peripheral and central cue conditions, and the three conditions were tested in counterbalanced order. Data analysis. Performance was quantified using the Pashler/Cowan K equation, where K represents how many items worth of information have been stored in WM (Cowan et al., 2005; Pashler, 1988). This score is calculated as follows: set size ⫻ (hit rate – false alarm rate), where hit rate is the proportion of correct responses when a change was present, and false alarm rate is the proportion of incorrect responses when no change was present. The use of this metric has the advantage of providing an estimate of the actual amount of information stored with different memory array sizes. Thus, at high set sizes, K values of 2 to 3 can be obtained even when overall percentage correct scores are quite low. In all experiments, the set size tested, not the number of items presented, was used as the multiplier in the preceding equation. Consequently, K reflects the number of items from the tested side that were stored in memory. Note that chance perfor-
GOLD ET AL.
662
Table 2 Mean Values of Percentage Correct and K by Task, Condition, Cue Validity, and Group Proportion correct SC Level of other condition and cue validity
M
K score
HC SD
M
SC SD
HC
M
SD
M
SD
Central vs. peripheral task Central Valid Neutral Invalid Peripheral Valid Neutral Invalid
0.70 0.63 0.57
0.12 0.11 0.11
0.83 0.72 0.63
0.09 0.09 0.10
1.22 0.90 0.50
0.68 0.60 0.58
1.99 1.45 0.83
0.54 0.59 0.62
0.75 0.67 0.55
0.10 0.09 0.08
0.84 0.75 0.62
0.09 0.11 0.11
1.56 1.05 0.38
0.60 0.47 0.42
2.04 1.50 0.73
0.52 0.68 0.63
0.82
0.11
1.94
0.62
2.45
0.44
Uncued control task 0.91
0.08
Predictive/antipredictive task Predictive Valid Invalid Antipredictive Valid Invalid
0.75 0.53
0.11 0.05
0.84 0.56
0.07 0.08
1.50 0.18
0.65 0.31
2.06 0.37
0.41 0.50
0.76 0.54
0.11 0.06
0.86 0.54
0.04 0.07
1.56 0.23
0.69 0.38
2.17 0.21
0.26 0.45
Shape task Set size of 2 Valid Invalid Set size of 3 Valid Invalid Set size of 4 Valid Invalid
0.87 0.61
0.08 0.13
0.92 0.73
0.06 0.13
1.50 0.43
0.33 0.51
1.68 0.94
0.23 0.51
0.81 0.55
0.08 0.10
0.88 0.62
0.07 0.11
1.84 0.31
0.48 0.62
2.30 0.71
0.40 0.68
0.74 0.53
0.08 0.08
0.82 0.54
0.11 0.07
1.91 0.26
0.62 0.66
2.53 0.28
0.86 0.56
0.03 0.04 0.06 0.09 0.11
1.90 2.43 2.61 2.88 2.24
0.12 0.32 0.81 1.09 1.58
1.91 2.79 3.45 3.80 4.28
0.11 0.25 0.44 1.14 1.74
Shape control task Set Set Set Set Set
size size size size size
of of of of of
2 3 4 6 8
0.97 0.90 0.83 0.74 0.64
0.03 0.05 0.10 0.09 0.10
0.98 0.96 0.93 0.82 0.77 Color task
Set size of Valid Invalid Set size of Valid Invalid Set size of Valid Invalid Set size of Valid Invalid
2
Set Set Set Set
2 3 4 5
0.85 0.63
0.11 0.11
0.93 0.75
0.06 0.10
1.39 0.52
0.45 0.45
1.71 0.99
0.23 0.4
0.81 0.59
0.11 0.10
0.89 0.65
0.09 0.12
1.88 0.54
0.68 0.59
2.36 0.88
0.52 0.72
0.73 0.53
0.12 0.06
0.88 0.58
0.10 0.09
1.87 0.22
0.99 0.47
3.03 0.66
0.79 0.69
0.69 0.55
0.10 0.09
0.82 0.53
0.12 0.09
1.89 0.45
1.02 0.92
3.21 0.29
1.24 0.88
0.93 0.89 0.84 0.81
0.06 0.09 0.09 0.11
1.74 2.33 2.69 3.14
0.25 0.56 0.75 1.11
1.91 2.87 3.68 4.44
0.08 0.12 0.46 0.46
3 4 5
Color control task size size size size
of of of of
0.98 0.98 0.96 0.94
0.02 0.02 0.06 0.05
ATTENTIONAL CONTROL OF WORKING MEMORY
663
Table 2 (continued ) Proportion correct SC Level of other condition and cue validity
M
K score
HC SD
M
SC SD
HC
M
SD
M
SD
0.90 1.95 2.14 2.08
0.10 0.48 0.87 1.17
0.96 2.41 2.65 2.73
0.04 0.34 0.77 1.00
Memory span task Set Set Set Set
size size size size
of of of of
2 4 6 8
0.95 0.74 0.52 0.38
0.05 0.12 0.15 0.15
0.98 0.85 0.61 0.47
0.02 0.08 0.13 0.12
Note. For the central versus peripheral task, N ⫽ 25 for the group with schizophrenia (SC), and N ⫽ 25 for the healthy control (HC) group; for the predictive/antipredictive task, N ⫽ 12 for the SC group, and N ⫽ 14 for the HC group; for the shape task; N ⫽ 19 for the SC group, and N ⫽ 16 for the HC group; for the color task; N ⫽ 18 for the SC group, and N ⫽ 16 for the HC group; for the memory span task, N ⫽ 26 for the SC group, and N ⫽ 21 for the HC group.
mance results in K scores of 0. To provide an overall metric of the efficiency of attentional selection, we divided the K scores obtained on validly cued trials by the sum of K scores obtained on both valid and invalid trials. This metric quantifies the extent to which storage capacity is devoted to validly cued items, and a score of 100% would suggest that all available capacity was spent on valid items. All analyses reported below (for all five experiments) were also performed using the signal detection measure A⬘ (Macmillan & Creelman, 1991), with nearly identical statistical results, but only the K results are presented to save space. Raw percentage correct scores for all experimental conditions are provided in Table 2.
Results Figure 2 shows performance across the baseline, valid, neutral, and invalid trials (see also Table 2). On baseline trials, HC participants performed significantly more accurately than SC participants (for HC, mean K ⫽ 2.45, SD ⫽ 0.44; for SC, mean K ⫽ 1.93, SD ⫽ 0.62), t(48) ⫽ 3.43, p ⬍ .01. As seen in Figure 2, both groups showed robust cuing effects: Mean K was higher on the valid trials than on the neutral trials and was higher on the neutral trials than on the invalid trials. In HC participants, the strength of
Figure 2. Mean K scores in participants with SC and HC participants in baseline, valid, neutral, and invalid conditions from Experiment 1. Error bars represent the standard error of the mean. SC ⫽ schizophrenia; HC ⫽ healthy control.
this effect was nearly identical for central and peripheral cues, whereas the central cue was somewhat less effective than the peripheral cue in the SC group. In both groups, performance in the validly cued condition was somewhat less accurate than in the baseline control condition. These findings were confirmed by an analysis of variance (ANOVA) in which the effects of group, cue type (central, peripheral), and cue validity (valid, neutral, and invalid) were examined (baseline trials were excluded from this analysis). We observed significant main effects of group (HC ⬎ SC participants), F(1, 48) ⫽ 25.66, p ⬍ .001; and cue validity (valid ⬎ neutral ⬎ invalid), F(2, 96) ⫽ 60.53, p ⬍ .001 for main effect of cue validity, p ⬍ .001 for all pairwise comparisons of valid vs. neutral vs. invalid. The main effect of cue type (central vs. peripheral) was not significant, F(1, 48) ⫽ 1.30, p ⫽ .26. The group variable showed no significant interactions with any of the other variables (minimum p ⫽ .24). A Cue Type ⫻ Cue Validity interaction was observed, F(2, 96) ⫽ 3.37, p ⫽ .039; this interaction resulted from higher K scores on valid trials with peripheral cues than on valid trials with central cues. Post hoc tests showed that K scores were higher for valid peripheral cues (mean K ⫾ SE ⫽ 1.80 ⫾ 0.08) than for valid central cues (1.60 ⫾ 0.09): t(96) ⫽ 2.92, p ⫽ .004. Cue type did not modify K scores for neutral ( p ⫽ .35) or invalid cues ( p ⫽ .20). This interaction implies that peripheral cues were somewhat more effective than central cues, an unsurprising result that does not impact the interpretation of the between-group effects: Both central and peripheral cues and all three levels of cue validity had similar effects in both groups. We also examined overall attentional efficiency by dividing K scores from valid trials by the sum of Ks observed on both valid and invalid trials. See Table 3 for evidence that both groups used most of their available capacity on the storage of valid items. An ANOVA of these data yielded no evidence of a main effect of group, F(1, 48) ⫽ 0.00; yielded a significant effect of cue condition (peripheral ⬎ central), F(1, 48) ⫽ 6.39, p ⫽ .15; and yielded a nonsignificant Group ⫻ Condition interaction, F(1, 48) ⫽ 2.78, p ⫽ .10. Note that this interaction reflects the slightly superior performance of the SC participants in the peripheral condition coupled with their slightly inferior performance with central cues.
GOLD ET AL.
664 Table 3 Percentage of Total K Devoted to Encoding Cued Objects
Difference (SC ⫺ HC) SC Task and level of other conditions Central vs. peripheral (pooled SD ⫽ 20.4) Central Peripheral Predictive/antipredictive (pooled SD ⫽ 15.77) Predictive Antipredictivea Shape (pooled SD ⫽ 28.38) Set size of 2 Set size of 3 Set size of 4 Color (pooled SD ⫽ 35.49) Set size of 2 Set size of 3 Set size of 4 Set size of 5
HC
Post hoc t tests
M
SD
M
SD
M diff
SE diff
Effect size
t
df
p
67.6 80.2
29.2 16.9
72.9 75.5
15.8 16.9
⫺5.3 4.7
6.6 4.8
⫺0.26 0.23
⫺0.80 0.98
48 48
.426 .330
91.6 85.2
17.4 13.6
86.6 92.5
17.6 13.9
5.0 ⫺7.0
6.9 5.5
0.32 ⫺0.44
0.73 ⫺1.27
24 24
.475 .215
80.6 98.5 99.0
22.8 47.8 28.1
66.3 79.1 93.7
14.7 19.3 20.3
14.4 19.4 5.3
6.6 12.8 8.4
0.51 0.68 0.19
2.16 1.52 0.63
33 33 33
.038 .138 .532
75.3 79.1 96.5 98.0
20.4 24.1 56.1 62.6
64.5 75.4 83.3 98.3
10.9 16.7 16.2 31.0
10.8 3.6 13.2 ⫺0.3
5.7 7.2 14.6 17.3
0.31 0.10 0.37 ⫺0.01
1.90 0.50 0.90 ⫺0.02
32 32 32 32
.067 .617 .372 .984
Note. We used variance components analysis to estimate the total variance of the percentage of K devoted to encoding cued objects from the sum of within-person and between-person components of variance in the repeated measurements from each experiment, after taking account of fixed effects of group, condition, and Group ⫻ Condition. We estimated the pooled standard deviation from the square root of the estimated total variance. We estimated effect sizes at each level of set size from the mean difference between SC and HC divided by the pooled standard deviation. For each task, we fit a mixed model of the form: % capacity encoding cued ⫽ group ⫹ condition ⫹ Group ⫻ Condition, and performed post hoc t tests using the model error term and degree of freedom to compare the groups at each set size. SC ⫽ schizophrenia; HC ⫽ healthy control. a For this model, we deleted one outlying value from a participant with SC with % total K ⬎ 300%.
Discussion Contrary to the hypothesis that attentional control of WM is impaired in SC, these results suggest that individuals with SC are able to use both peripheral and central cues to select items for WM storage. SC participants demonstrated a clear performance advantage for validly cued items relative to neutral and invalid items. Further, we did not observe any excessive encoding of uncued items in the SC group as would be expected if selection were ineffective. Across control and validly cued conditions, the HC participants demonstrated significantly higher levels of WM storage than SC participants, consistent with prior evidence of WM capacity limitations in the literature (Lee & Park, 2005). This pattern of results is quite surprising given the extensive evidence for impairments of attention, WM, and executive control in SC (Barch, 2005). Before accepting the conclusion that this variety of attention is unimpaired in SC, it is necessary to consider some alternative explanations for the results. One possibility is that we did not have sufficient power to detect a difference between groups. Although one can never rule out this explanation for a null effect, three factors suggest that any differences in attentional control between SC and HC participants were small at best. First, overall performance of participants with SC was significantly and substantially lower than overall performance of HC participants, indicating that we did not have unusual samples of participants and that we had adequate statistical power to detect between-group effects. Second, the SC participants exhibited robust cue validity effects, especially in the peripheral cue condition. Third, SC participants appeared to apportion their WM capacity to validly cued items in a fashion similar to that of HC participants as seen in
Table 3. Thus, this experiment provided positive evidence that SC participants can orient attention quite effectively under these conditions. Nonetheless, because the finding of intact attentional control of WM was both surprising and important, we conducted several follow-up experiments to demonstrate the reliability of this finding and to more fully address issues of power to detect small effects. In addition to attempting to determine if the pattern observed in Experiment 1 is robust, the follow-up experiments provided a closer examination of the one hint of an attention deficit observed in Experiment 1. Specifically, the cue validity effect for the central cue condition was somewhat reduced in the SC group compared with the HC group (although this difference did not approach statistical significance). If real, this difference could simply reflect a modest slowing in the SC participants’ ability to decode and act on the central cues rather than a deficit in attention per se. Experiments 3 and 4 were designed to address this possibility. Alternatively, this subtle effect could reflect a specific deficiency in the efficiency of top-down as opposed to bottom-up guidance of attention. If this were true, it would suggest that participants with SC would find it very difficult to overcome a potent peripheral cue when it is disadvantageous to attend to the location of the cue. Experiment 2 was designed to address this possibility.
Experiment 2: Predictive and Antipredictive Peripheral Cues In Experiment 2, we examined whether individuals with SC are able to use volitional attention to overcome the relatively auto-
ATTENTIONAL CONTROL OF WORKING MEMORY
matic capture of attention by highly salient peripheral cues. To examine this issue, participants were tested in two conditions closely resembling the peripheral cue condition of Experiment 1 (shown in Figure 1). In the predictive condition, memory was tested for the stimuli inside of the cued rectangle on 75% of the trials, and memory was tested for the stimuli on the other side of the display on 25% of the trials. This task condition was nearly identical to that of Experiment 1, with the exception of the elimination of neutral trials. In the antipredictive condition, the stimuli were identical, but the probabilities were reversed: Memory was tested for the stimuli outside the rectangle on 75% of the trials, and memory was tested for the stimuli inside the rectangle on 25% of the trials. Thus, if SC participants were unable to use volitional attention to overcome a salient cue, we would expect intact performance in the predictive condition, but a loss of selectivity in the antipredictive condition.
Method: Task Conditions and Stimuli The stimuli and procedure closely resembled those of the peripheral cue condition of Experiment 1. Colored squares were presented on a VGA monitor on a gray background. The 200-ms sample array consisted of six colored squares (0.67° ⫻ 0.67°), three on each side. The squares on a given side were presented at randomly selected locations within an area that was 4.4° ⫻ 10.0°, centered 5.9° from fixation; the minimum center-to-center distance between squares was 2.0°. The cue was a black outlined rectangle (6.0° ⫻ 11.7°), centered 5.9° from fixation, and it was presented simultaneously with the sample array. The cue and sample array were followed by an 800-ms retention interval and then by a test array containing the three squares on one side, with a color change in one square on 50% of trials. The test array was visible until the participant responded. The predictive and antipredictive conditions were tested in counterbalanced order, with 240 trials per condition. Prior to testing, participants were given thorough instructions about the nature of cues and an 80-trial practice block to ensure comprehension of task conditions. We refer to the side that contained the rectangle cue as the cued side and the opposite side as the uncued side; we refer to the side that was likely to be tested as the predicted side and the side that was unlikely to be tested as the unpredicted side. In the predictive condition, the cued side and the predicted side were the same; in the antipredictive condition, the cued side was the unpredicted side. If the rectangle cue serves to capture attention, we would expect participants with SC to show normal cue benefits in the predictive condition. In contrast, this same form of capture should lead to reduced cuing effects in the antipredictive condition.
Results Results of the experiment are shown in Figure 3 and Table 2. Both groups showed a clear advantage for the predicted side relative to the unpredicted side in both the cued and uncued conditions, with performance on the unpredicted side approaching chance levels in both groups in both conditions. Participants with SC performed somewhat worse than HC participants on the predicted side whether that side was the cued or uncued side. This impression was confirmed in an ANOVA examining the effects of group, cue condition (i.e., inside vs. opposite of rectangle), and tested location (predicted vs. unpredicted). Significant main effects were observed for group (HC ⬎ SC), F(1, 24) ⫽ 7.08, p ⫽ .014; and tested location (predicted ⬎ unpredicted), F(1, 24) ⫽ 176.12, p ⬍ .001; but not for cue condition, F(1, 24) ⫽ 0.09, p ⫽ .77. Both groups were able to orient attention just as efficiently in the antipredictive condition as in the predictive condition, and
665
Figure 3. Mean K scores in participants with SC and HC participants from Experiment 2. In cued-predictive (CP) trials, participants were tested on items that appeared inside of the cued rectangle. In uncued predicted (UP) trials, participants were tested on the three items that appeared opposite the cued rectangle. In cued unpredicted (CU) trials, participants were tested on items appearing opposite of the cue rectangle in a trial block in which they had been instructed to attend to items inside the rectangle. In uncued unpredicted (UU) trials, they were tested on items inside the cue rectangle in a trial block where they had been instructed to attend to items opposite the cue rectangle. Note that K scores approaching 0 represent chance-level performance. Error bars represent the standard error of the mean. SC ⫽ schizophrenia; HC ⫽ healthy control.
there were no significant main effects or interactions involving cue condition: Group ⫻ Cuing Condition ⫻ Tested Location interaction, F(1, 24) ⫽ 1.88, p ⫽ .18; Cuing Condition ⫻ Tested Location interaction, F(1, 24) ⫽ 2.13, p ⫽ .16; Group ⫻ Cuing Condition interaction, F(1, 24) ⫽ 0.63, p ⫽ .43. We did, however, observe a significant Group ⫻ Tested Location interaction: F(1, 24) ⫽ 4.47, p ⫽ .045. This interaction results from the fact that group differences were larger for items that were predicted (both inside and opposite of the rectangle cue, p ⬍ .02) than for unpredicted items (both ps ⬎ .27), evidence for a reduction in WM capacity for participants with SC rather than a failure in attention. See also Table 3 for additional evidence that SC participants restricted encoding to cued times at levels somewhat higher than in HC participants in the predictive condition and at somewhat lower levels in the antipredictive condition. An ANOVA of these data yielded no evidence of a group effect, F(1, 24) ⫽ 0.03, p ⫽ .86; no effect of condition, F(1, 24) ⫽ 0.00, p ⫽ .99; and a trend toward a significant Group ⫻ Condition interaction, F(1, 24) ⫽ 3.92, p ⫽ .059.
Discussion The data from the predictive condition confirm the finding of Experiment 1 that participants with SC are able to use salient peripheral cues to guide WM encoding. The cuing effect (i.e., the difference in performance between the predicted location and the unpredicted location) was somewhat larger in the control group than in the SC group, but it is unlikely that this reflects a deficit in selective attention. Individuals with SC are almost always somewhat impaired in visual WM tasks with array sizes of three or more items, and this can explain the impaired performance of the SC participants at the predicted location. Performance at the unpre-
GOLD ET AL.
666
dicted location was near chance in both groups, as would be expected if selective attention worked efficiently. The combination of an overall WM impairment limiting SC group performance at the predicted location and near-chance performance for both groups at the unpredicted location seems like the most parsimonious explanation for the modest difference between groups in the size of the cuing effect. Moreover, the data clearly demonstrate that individuals with SC can restrict memory encoding to the cued location quite effectively; that is, they did not encode the information from the nonpredicted side. More important, these data suggest that those with SC are able to use volitional control to overcome cues that attract attention in a relatively automatic fashion. The antipredictive condition required participants to use a stimulus presented at one location as a cue to shift attention to a different location, and this requires substantial top-down control. Although participants with SC were somewhat less efficient than HC participants in the use of WM capacity in the antipredictive condition, they still allocated 85% of their resources to the cued items in the face of strong perceptual competition. Further, the cuing effect was just as big in the antipredictive condition as in the predictive condition, which demonstrates that individuals with SC can use cues flexibly to guide attention. Consequently, the present data provide clear evidence that those with SC can use top-down as well as bottom-up attentional signals to control the encoding of information into WM.
Figure 4.
In both Experiments 1 and 2, the cued and uncued stimuli were very clearly segregated, appearing on opposite sides of the display. This may make the selection process so easy that a subtle deficit in attentional selection among participants with SC could not be detected. In the natural environment, relevant information is often intermixed with irrelevant information, making the selection process more difficult. Experiments 3 and 4 were designed to increase the difficulty of selection in this manner, intermixing to-beattended and to-be-ignored items and requiring participants to select the objects of a particular color or form. In addition, these experiments emphasized the use of top-down control of attention while avoiding the use of symbolic cues, which might have been difficult for participants with SC to decode even if selective attention was fully intact.
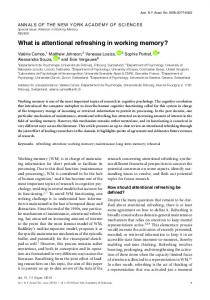
Experiment 3: The Use of Color Cues to Select Items for WM Storage Experiment 3 increased the difficulty of the selection process by asking participants to remember the orientations of a set of rectangles of one color that were spatially intermixed with a set of rectangles of another color. As illustrated in Figure 4, participants were presented with displays of 4, 6, 8, or 10 rectangles that varied in color and orientation. In the selective attention condition, half of the items were red and half were green, and participants were
Illustration of stimuli used in Experiments 3 (top row) and 4 (bottom row).
ATTENTIONAL CONTROL OF WORKING MEMORY
instructed to remember the orientations of the items in one of the colors. Prior to a testing block, participants were instructed which color should be attended, thereby eliminating the need to interpret a cue at the time of target presentation as was the case in Experiments 1 and 2. In this paradigm, a failure of selective attention should cause a failure to encode relevant items (i.e., those of the instructed color) coupled with excessive encoding of irrelevant items (i.e., those of the noninstructed color). This effect should be magnified at the highest set sizes. With small set sizes (e.g., two and three attended items), participants should be able to encode all of the relevant, cued items and, insofar as their capacity was not fully occupied, some of the uncued items as well. That is, when below capacity, it would be advantageous to encode some of the uncued items, given that they were tested on 25% of the trials, and there would be no cost to doing so. However, at larger set sizes, when WM capacity is fully engaged by relevant items, participants should exhibit minimal encoding of uncued items. Thus, inefficient selection in the SC group should be most evident at high set sizes: The HC group should show minimal encoding of uncued items, whereas participants with SC would be expected to show excessive encoding. In addition, an uncued baseline condition was administered in which participants were presented with display sizes of two, three, four, and five rectangles, all in a single color, and were instructed to detect an orientation change. Set sizes of four and five should challenge or slightly exceed the WM capacity of most HC and SC participants, thus leading participants to select only a subset of the items. As noted above, a deficit in selective attention should be evident as a decrease in the total number of items successfully encoded as display size increasingly exceeds available capacity.
Method: Task Conditions and Stimuli In the selective attention condition, participants saw a sample array containing equal numbers of red and green rectangles and were told to attend to either the red or the green items. Each rectangle was either horizontal (1.11° ⫻ 0.34°) or vertical (0.34° ⫻ 1.11°), and participants were instructed to remember the orientations of the items. The sample was presented for 1,000 ms, followed by a 1,000-ms retention interval and then the test array. The test array contained only the red (or green) items from the sample array; these items were identical to the sample-array items on 50% of trials, and one of the items changed to the other orientation on the remaining 50% of trials. The color presented in the test array was the attended color on 75% of trials (valid trials) and was the other color on the remaining 25% of trials (invalid trials). The rectangles were randomly positioned within a 6.0° ⫻ 6.0° region that was centered on the screen, with a minimum center-to-center separation of 1.3° between objects and between each object and the fixation point. Half of the items were on the left side and half were on the right, but the two colors were randomly intermixed and the orientation of each item was selected at random. The total number of items in the display was 4, 6, 8, or 10, with half of the items drawn in red and half drawn in green. There were 512 total trials, with 96 valid trials and 32 invalid trials at each set size. The order of trials was random except that no more than 2 invalid trials could occur in a row and that the 1st trial of each block was valid. The trials were divided into 4 blocks of 128 trials each. Participants were instructed to attend to green for half of the trial blocks and to red for the other half. The baseline control condition was identical to the selective attention condition, except that only the items of a single color were presented in the sample and test arrays. Participants performed 1 red block and 1 green block, each comprising 80 trials, resulting in a total of 40 trials at each set size.
667
Results The results from the baseline and selective attention conditions are shown in Figure 5 and Table 3. In the baseline condition, the HC group outperformed the SC group at all set sizes, with the magnitude of between-group differences increasing at the larger set sizes. In the HC group, the mean K score increased from 1.9 to 4.4 between set sizes of two and five, whereas the mean K score in the SC group increased to a lesser extent from 1.7 to 3.1. This was confirmed by a 2 (group) ⫻ 4 (set size) ANOVA that yielded main effects of group, F(1, 32) ⫽ 20.25, p ⬍ .001; and set size, F(3, 30) ⫽ 91.11, p ⬍ .001; along with a significant Group ⫻ Set Size interaction, F(3, 30) ⫽ 7.02, p ⬍ .001. Notably, the performance of participants with SC was greater at a set size of five than at a set size of four, which provides evidence that a modest overload did not lead to catastrophic interference in memory performance. As seen in Figure 5, both groups demonstrated robust selective attention effects, with significantly greater memory performance when the cued color was tested than when the uncued color was tested. For both groups, mean K scores increased as set size increased on valid trials, but not on invalid trials. K scores on valid trials reached an asymptote at a set size of three attended items for the SC group and appeared to be reaching an asymptote at a set size of five attended items for the HC group. Contrary to what would be expected if attention were impaired, the SC group did not show enhanced performance on invalid trials compared with the HC group. Instead, mean K scores on the invalid trials were somewhat higher for the HC group than for the SC group at small set sizes and were approximately equal across groups for larger set sizes. This description of the data was confirmed in an overall 2 (group) ⫻ 2 (cue type: valid vs. invalid) ⫻ 4 (set size: two, three, four, five) ANOVA model. This model yielded significant main effects of group (HC ⬎ SC), F(1, 32) ⫽ 14.46, p ⬍ .001; set size (large ⬎ small), F(3, 30) ⫽ 10.56, p ⬍ .001; and cue type (valid ⬎ invalid), F(1, 32) ⫽ 134.86, p ⬍ .001. We also observed a significant Validity ⫻ Set Size interaction (validity effect larger at
Figure 5. Mean K scores in participants with SC and HC participants in the baseline, valid, and invalid conditions, plotted as a function of set size, from Experiment 3. Error bars represent the standard error of the mean. SC ⫽ schizophrenia; HC ⫽ healthy control.
668
GOLD ET AL.
larger set sizes), F(3, 30) ⫽ 25.58, p ⬍ .001; and a significant Group ⫻ Set Size interaction (SC vs. HC participant differences are larger at larger set sizes, consistent with baseline data), F(3, 30) ⫽ 3.25, p ⫽ .035. A significant Group ⫻ Cue ⫻ Set Size interaction was also observed, F(3, 30) ⫽ 5.00, p ⫽ .006. Post hoc tests examining this three-way interaction did not support the hypothesis of an attention deficit. HC participants had significantly higher K scores than SC participants on valid trials at all set sizes (all ps ⬍ .05). However, HC participants also had significantly higher invalid K scores than participants with SC at set sizes of two, t(32) ⫽ 3.20, p ⫽ .003, and four, t(32) ⫽ 2.16, p ⫽ .039. Thus, the HC participants actually stored more of the invalid items than participants with SC did until the highest set size tested, at which point their storage capacity was presumably exhausted. Rather than indicating impaired selective attention in the SC group, the significant Group ⫻ Cue ⫻ Set Size interaction reflects decreased storage in the SC group on both valid and invalid trials. There was no evidence for increased accuracy on invalid trials among participants with SC, which would have been evidence of impaired selection. This evidence of intact selective attention in participants with SC was confirmed in a secondary analysis that examined the proportion of total storage devoted to validly cued items (see Table 3). The ANOVA on these data yielded no evidence of a group effect, F(1, 32) ⫽ 1.19, p ⫽ .28; an effect of set size, F(3, 32) ⫽ 10.61, p ⬍ .001; but no evidence of a Group ⫻ Set Size interaction, F(3, 32) ⫽ 0.37, p ⫽ .77. Note that the SC group actually showed somewhat greater selectivity than the HC participants in this experiment. While this may reflect, in part, the lower capacity of participants with SC, the fact that they were at least as efficient as, if not more so than, HC participants, argues strongly against the idea that the current experiment lacked sufficient power to detect a small effect: There was a small effect that contradicted the hypothesis.
In Experiment 4, we used the same cuing approach as in Experiment 3, with two critical changes. To reduce the perceptual salience of the selection dimension, participants were presented with arrays of spatially intermixed circles and rectangles of different colors and were asked to detect a color change in one of the items (see Figure 4). In the selective attention condition, participants were instructed to attend to items of only one shape. Although object form provides a reasonably discriminable means of selecting some objects and not others, it is not as salient as color for this purpose (Egeth et al., 1984) and should pose more of a burden on selective encoding. To increase the load on self-directed selection processes, the baseline condition in this experiment tested array sizes of two, three, four, six, and eight items. As in Experiment 3, we expected attentional failures to be reflected in increased encoding of invalid items, in a decline in K scores at higher array sizes (in the control task and in the validly cued trials), and in a decreased efficiency of attention in the comparison of valid and baseline trials of the same attended set size.
Discussion
Method
These results provide converging evidence that individuals with SC are able to use selective attention to guide WM encoding, even when the to-be-attended and to-be-ignored stimuli are spatially intermixed. First, participants with SC showed a clear advantage for validly cued items relative to invalidly cued items. Second, HC participants encoded more of the invalid items than participants with SC did. That this effect was quantitatively largest at the smallest set sizes suggests that HC participants were able to use spare storage capacity to encode invalid items. At higher set sizes, retention of invalid items declined, consistent with the idea that capacity was fully occupied with cued items. That participants with SC encoded fewer invalid items than HC participants did is evidence of both efficient selection and lower WM storage capacity: The capacity of participants with SC was exhausted by the valid items, even at the smaller set sizes. This is reinforced by the data in Table 3 showing higher rates of selectivity in SC than HC participants. In the baseline condition, we found that K scores in the SC group remained stable rather than declining when storage capacity increased from four to five items. In our prior study (Gold et al., 2003), we observed a decline in K at a set size of six compared with a set size of four, which we suggested might reflect a failure to spontaneously select a subset of the items for storage in WM. It
The methods were identical to those of Experiment 3 with the following exceptions. In the selective attention condition, sample arrays were composed of equal numbers of circles (0.67° diameter) and rectangles (0.34° ⫻ 1.07°), with set sizes of four, six, or eight items, and participants attended to the rectangles or to the circles (in different blocks of trials). The test arrays contained either the items of the attended shape (75% of trials) or the items of the other shape (25% of trials). The color of one of the items changed on 50% of the trials; on the other 50%, the sample and test arrays were identical. The trials were divided into 4 blocks of 96 trials each, yielding a total of 96 valid trials and 32 invalid trials at each set size. Participants were instructed to attend to the circles for half of the trial blocks and to the rectangles for the other half. Sample and test arrays in the baseline condition consisted entirely of circles or entirely of rectangles, with set sizes of two, three, four, six, or eight items. Two blocks of 54 trials were tested, one with arrays of circles and one with arrays of rectangles, yielding a total of 36 trials at each set size.
is possible that the set size of five items in the present study did not impose a sufficiently strong overload. Higher levels of overload were therefore tested in Experiments 4 and 5. The lack of a difference between the SC and HC groups in the efficiency of selection is, once again, a null result. Before accepting it, we sought to provide a conceptual replication in Experiment 4, by using an even more challenging selection task. We therefore required participants to select the objects of a given shape and to remember their colors. Selection on the basis of shape is typically more difficult than selection on the basis of color (Egeth, Virzi, & Garbart, 1984). Thus, Experiment 4 was designed to be both a replication of Experiment 3 and an even more sensitive test of impairments of selective attention.
Experiment 4: Selection by Object Form
Results The results are summarized in Figure 6 and Table 2. In the baseline condition, mean K values were lower for the SC group than for the HC group, and they increased less as set size increased for SC than for HC participants. This observation was confirmed in an ANOVA that yielded significant main effects of group, F(1, 33) ⫽ 18.21, p ⬍ .001; and set size, F(4, 30) ⫽ 48.40, p ⬍ .001;
ATTENTIONAL CONTROL OF WORKING MEMORY
669
manifested in superior performance for validly cued items relative to invalid items as well as minimal encoding of invalid items. This evidence of intact selection was obtained with object form as a selection cue, a dimension that is less perceptually salient than the color cues used in Experiment 3. In the control task, a slight, statistically unreliable decrement was observed at the highest set size in the SC group, a load that far exceeded SC participants’ capacity and might be expected to lead to interference if participants with SC do not spontaneously select a subset of the items for storage in WM. Experiment 5 was designed to further explore the spontaneous operation of selective attention in the face of array sizes that substantially exceed WM capacity. Figure 6. Mean K scores in participants with SC and HC participants in the baseline, valid, and invalid conditions, plotted as a function of set size, from Experiment 4. Error bars represent the standard error of the mean. SC ⫽ schizophrenia; HC ⫽ healthy control.
along with a Group ⫻ Set Size interaction effect, F(4, 30) ⫽ 5.68, p ⫽ .002. In the HC group, the mean K scores increased at each level of set size, whereas the K scores of SC participants declined at a set size of eight, falling below the level achieved at set sizes of three, four, and six. Although this pattern replicates the pattern we observed previously (Gold et al., 2003), in within-group pairwise post hoc contrasts using the overall ANOVA model the drop from a set size of six to set size of eight was not statistically significant (nor was the difference from a set size of four to one of eight). Both groups showed a robust validity effect in the selective attention condition, with performance on valid trials far exceeding performance on invalid trials. Both groups also showed decreasing K scores on invalid items as set size increased, an effect that was stronger in HC than in SC participants. These observations were confirmed in an overall ANOVA that yielded significant main effects of group (HC ⬎ SC), F(1, 33) ⫽ 8.50, p ⫽ .006; cue type (valid ⬎ invalid), F(1, 33) ⫽ 208.02, p ⬍ .001; and set size (large ⬎ small), F(2, 32) ⫽ 4.69, p ⫽ .016. This ANOVA also yielded a Cue Type ⫻ Set Size interaction (larger validity effect at larger set sizes), F(2, 32) ⫽ 24.58, p ⬍ .001, and a significant Group ⫻ Cue Type ⫻ Set Size interaction (the Cue Validity ⫻ Set Size interaction was larger for the HC group than for the SC group), F(2, 32) ⫽ 4.85, p ⫽ .014. In post hoc comparisons, HC participants had higher invalid K scores than SC participants at set sizes of two, t(33) ⫽ 2.90, p ⫽ .007, and three, t(33) ⫽ 1.86, p ⫽ .071, as well as higher valid K scores at all but the smallest set size: t(33) ⫽ 1.86, p ⫽ .071; t(33) ⫽ 3.09, p ⫽ .004; and t(33) ⫽ 2.46, p ⫽ .20, at set sizes of two, three, and four, respectively. This pattern replicates the findings of Experiment 3, again providing no evidence that individuals with SC are unable to selectively encode the cued items or divert their scarce capacity toward the uncued items. This inference is supported by storage efficiency data shown in Table 3. An ANOVA of these data yields a nearly significant main effect of group, favoring SC participants, F(1, 33) ⫽ 3.82, p ⫽ .059. The main effect of set size was significant, F(2, 33) ⫽ 11.05, p ⬍ .001, but we found no Group ⫻ Set Size interaction, F(2, 33) ⫽ 1.39, p ⫽ .26.
Discussion These results provide further evidence that individuals with SC are able to use attention to effectively guide WM encoding, as
Experiment 5: Memory Span Localization One limitation of the change-detection methods used in Experiments 1– 4 is that performance is near chance levels for the large set sizes. When array sizes far exceed capacity, it is possible that measurement sensitivity may be reduced because a single correct or incorrect guess may have a large proportional effect on K. Experiment 5 was designed to reduce the role of chance and therefore increase sensitivity at larger set sizes. Participants were presented with array sizes of two, four, six, and eight colored squares, and a change occurred on every trial. Rather than asking whether the test array was identical to the prior sample array, participants were asked to point to the specific location of the color change. Because the number of locations from which to choose increased as the set size increased, chance level performance ranged from 50% with a set size of two to 12% at a set size of eight, and lucky guesses were therefore less likely to occur at the larger set sizes. This makes it easier to reliably detect declining levels of performance at higher set sizes, which if found would suggest a failure of self-guided attentional selection.
Method: Task Description The sample array was composed of two, four, six, or eight colored squares (0.68° ⫻ 0.68°), presented for 500 ms and followed by a 1,000-ms retention interval. The positions of the squares were randomly chosen from a set of 25 locations defined by dividing the viewing area into a 5 ⫻ 5 grid of possible locations. This grid covered an area of 6.22° ⫻ 6.22°, centered at the fixation point. The center-to-center distance between the locations was 1.56°. The test array was identical to the sample array, except that one item always changed to a new color. The participant’s task was to point to the item that changed; the experimenter then clicked on the indicated item using a mouse to record the participant’s response. A different means of computing K was necessary for this paradigm. If we assume that participants always make a correct response when the changed item is held in WM and that they guess randomly among the items not being held in memory when they do not detect a change, then K ⫽ (proportion correct ⫻ set size) – 1. Note that the maximum K score that is possible for a given set size is set size – 1. This reflects the fact that remembering all but one of the items allows for perfect performance because one can make a correct response, even when the changed item is the one item not being stored in memory. That is, if a change is not detected, then the participant can accurately guess that the change must have occurred in the one item not being stored in memory. Like the equation for K used in the previous experiments, this equation assumes that participants use their limited memory capacity in an optimal manner and that suboptimal use of memory capacity will lead to an underestimate of the actual storage capacity. Thus, a finding of a lower mean K in the SC group could reflect the suboptimal use of memory
670
GOLD ET AL.
capacity rather than a true reduction in capacity (see Gold et al., 2003, for an extended discussion of how noncapacity factors may influence WM performance). However, it is still possible to draw solid conclusions from K scores when the pattern of K values over different experimental conditions is examined instead of the value of K in a single experimental condition.
Results and Discussion The K scores for each group are shown in Figure 7 and Table 2. As seen in the figure, mean K scores for the HC group rose substantially from a set size of two to a set size of four, and then increased very slightly as set size increased to six and then eight items. Mean K scores for the SC group also rose substantially from a set size of two to a set size of four, increased slightly at a set size of six, and then declined slightly at a set size of eight. The performance of participants with SC was similar to that of HC participants at a set size of two but was impaired at set sizes of four, six, and eight. An ANOVA with the variables of group and set size showed a significant main effect of group, F(1, 45) ⫽ 6.97, p ⫽ .001, reflecting the overall lower scores of the SC group. The ANOVA also showed a significant main effect of set size, F(2, 43) ⫽ 243.40, p ⬍ .001, reflecting the increased K scores at higher set sizes, and a significant Group ⫻ Set Size interaction, F(3, 43) ⫽ 5.67, p ⫽ .002, reflecting the smaller increase in K scores at larger set sizes in the SC group. We ran post hoc contrasts between set sizes within each group, using the overall ANOVA model to examine the set size effects separately for each group, and we found that mean K scores were significantly lower for a set size of two than for each of the other set sizes in both groups ( p ⬍ .001). However, neither group showed any significant pairwise differences among set sizes of four, six, and eight (min p ⫽ .11 for SC participants and min p ⫽ .08 for HC participants). Using post hoc contrasts from the overall ANOVA model to compare the magnitude of the SC versus HC differences at different set sizes, we found these differences increased significantly as set size increased, F(1, 45) ⫽ 14.02, p ⬍ .001, for the increase at set sizes of two versus four; F(1, 45) ⫽ 8.09, p ⫽ .007, for four versus six; and F(1, 45) ⫽ 4.94, p ⫽ .031, for six versus eight. As in the preceding experiments, the Group ⫻ Set Size interaction effect is most parsimoniously interpreted as evidence of between-group differences in WM capacity rather than indicating a failure in attention. As in Experiment 4 and our previous study
Figure 7. Mean K scores in participants with SC and HC participants, plotted as a function of set size, from Experiment 5. Error bars represent the standard error of the mean. SC ⫽ schizophrenia; HC ⫽ healthy control.
(Gold et al., 2003), we found that the K scores of participants with SC declined at the largest set size, which is consistent with a failure to efficiently encode only a subset of the items when the arrays exceed capacity. However, the decline occurred at a set size of eight in the present experiment, whereas it occurred at a set size of six in previous experiments, and the decline was small and did not approach statistical significance. When the data from these several experiments are considered together, it seems reasonable to conclude that this effect is replicable and therefore likely to be real, but also that it is small and therefore unlikely to reflect a major deficit in attentional control over WM encoding.
General Discussion These data provide converging evidence that individuals with SC are able to use attention to selectively store relevant information in WM. Across several experiments, participants with SC were able to use perceptually salient peripheral cues as well as more abstract cues to guide selection, and they were not seriously disrupted when confronted by supercapacity arrays. Although there were some small and/or inconsistent signs of failures in selection, the clear preponderance of evidence indicates that both top-down and bottom-up attentional control of visual WM is surprisingly intact in SC. Moreover, it does not appear possible to account for SC participants’ visual WM deficits on the basis of impaired selective attention. Whether these conclusions generalize to situations where targets are much less salient than distractors, to tasks that involve extended temporal sequences of information, to other modalities, or to the detection of subtle changes remains to be determined. However, the present results demonstrate that the circuitry required to perform reasonably challenging selection tasks is intact in individuals with SC. Clearly, we are drawing this inference on the basis of null results, raising the question of whether we had the power to detect the predicted pattern of results given the small samples studied, a concern articulated by several reviewers. Two factors suggest that our conclusions are warranted. We had adequate power to detect significantly higher levels of encoding of invalidly cued items in HC participants in Experiments 3 and 4: Those findings directly refute a critical aspect of the hypothesis. Further, the data in Table 3 show that participants with SC generally devoted a somewhat greater percentage of their WM storage capacity to validly cued items than did HC participants, another observation that directly refutes our original hypothesis. The participants with SC examined in these experiments were all medicated, with a fairly chronic illness course. Therefore, it is unknown if these findings might generalize to unmedicated individuals with SC or to those with recent SC onsets. The participants with SC studied here demonstrated clear evidence of reduced WM capacity as well as general intellectual impairment, as seen in the data from the Repeatable Battery for the Assessment of Neuropsychological Status, in the context of relatively preserved attentional control of WM. Thus, it is clear that an integrative account of the SC WM deficit that is based on selective attention impairments appears to be effectively ruled out by this series of experiments. The notion that SC involves an impairment of attention has long been one of the guiding ideas of the field. It is deeply embedded in clinical descriptions of the illness and is a major motivator of many experimental cognitive studies (Bleuler, 1911/1950; Kraepelin, 1919/1971; Nuechterlein & Dawson 1984; Zubin, 1975). De-
ATTENTIONAL CONTROL OF WORKING MEMORY
spite this large body of work, the precise nature of the attentional impairment in SC has remained elusive. The results from these five experiments provide some constraints in formulating the nature of the attention deficits in SC. Many accounts of attention emphasize that there are multiple forms of attention that operate in different cognitive systems (Luck & Vecera, 2002; Johnston, McCann, & Remington, 1995; Treisman, 1969). For example, perceptual-level attention effects are found very early in the visual system and enhance the selective sensory/perceptual processing of target signals and suppress the processing of distractors (Carrasco, Ling, & Read, 2004; Hillyard, Vogel, & Luck, 1998; Reynolds, Pasternak, & Desimone, 2000). In contrast, WM-level attention operates later in the visual system, facilitating the selection of fully formed perceptual representations (Schmidt et al., 2002; Vogel et al., in press-b). It is the later form of selective attention that was assessed by the present experiments and that appears to be relatively unimpaired in SC. However, intact attentional selection in visual WM does not imply that attentional processes that occur within other cognitive systems are intact in SC because different mechanisms of attention are involved in these other systems. Thus, deficits in attentional modulation of perceptual processing or in response processing are in no way ruled out by these results. Only systematic study of the different forms of attention in a variety of cognitive systems will provide the data needed to delimit the nature of the impairment in SC. We suspect that similar systematic experimental efforts will be needed to make progress in understanding several of the other broad constructs, such as executive control, WM manipulation, and memory encoding, that are central to current discourse on the cognitive deficits of SC. These five experiments also document another set of reliable results: Participants with SC demonstrated reliable reductions in WM storage capacity, consistent with prior reports. Note, however, that participants with SC also demonstrated deficits relative to HC participants on the smallest array sizes tested, array sizes that are demonstrably within the capacity of SC participants given their performance at higher set sizes. Thus, SC participants demonstrated impairments below the pathologically lowered ceiling of their capacity limits, which suggests that the impairment is caused, at least in part, by a failure of some form of attentional control rather than a pure reduction in storage capacity (Gold et al., 2003). However, attention is a broad construct, and the present results provide very strong evidence that any attention-related deficits in WM performance do not result from an impairment in the operation of selection. Instead, WM performance deficits may reflect difficulties in maintaining an adequate representation of task demands to guide ongoing behavior, or in maintaining an optimal state of alertness. In essence, individuals with SC appear to have an almost irreducible error rate when confronted with these types of tasks, errors that cannot be accounted for on the basis of task difficulty or resource limitations. This type of irreducible error rate is reminiscent of the literature on Continuous Performance Test (CPT) performance where individuals with SC make omission and commission errors with nondemanding perceptual targets and of the larger reaction time literature where the common finding is that those with SC are both slower and more variable than those without SC (Elvevag, Weinberger, Suter, & Goldberg, 2000; Nuechterlein, 1977). Clearly this account harkens back to the original work of David Shakow and the notion of set disturbance in SC (Shakow, 1977), a framework consistent with more contemporary notions of failures in cognitive
671
control and the use of context representations (Cohen & ServanSchreiber 1992; MacDonald et al., 2005). The challenge is to arrive at a satisfactory cognitive and neural account of such intermittent performance failures. To ascribe such failures as set or context maintenance problems then also requires an explanation of how appropriate task sets are spontaneously revived (e.g., individuals with SC make errors on one trial on the CPT followed by a correct detection on the next trial), a conceptual challenge that has yet to be addressed in the literature other than by invoking notions of intermittent noise. The behavioral evidence presented here—namely, that participants with SC were able to selectively encode task-relevant information in WM—suggests intact prefrontal modulation of temporal/parietal regions that mediate the representation of complex, multifeature objects, the neural system identified by numerous functional magnetic resonance imaging studies of related attention tasks (Corbetta & Shulman, 2002; Todd & Marois, 2004; Vogel & Machizawa, 2004). This raises the paradox of why participants with SC were able to do this if prefrontal dysfunction is indeed a core neural deficit in SC, as suggested by many (Barch, 2005; Goldman-Rakic, 1999; MacDonald et al., 2005; Weinberger et al., 2001), and given that the disease is often considered a disorder of cortical connectivity. Our answers to this important question are admittedly speculative. First, the tasks studied here involve the selection of perceptual representations from single, brief visual displays. These types of visual change detection tasks do not require the maintenance of sequences of representations (or of subgoals) over extended temporal durations, as in N-back or reasoning tasks. Thus, it is possible that individuals with SC are able to appropriately bias the initial processing of representations for storage, but might have difficulty maintaining selectivity over time and might be challenged by presentation of distractors or by the requirement of maintaining serial order information. By this account, the difficulty is not in selection per se or in the ability to use goal representations to bias processing, but is in the ability to maintain appropriate selectivity in the face of specific cognitive challenges. Such a formulation undermines the generality of the context or goal representation account of the impairments observed in SC: Individuals with SC appear to be able to use context information in some tasks but not in others. Further, change detection tasks stress WM storage per se: They do not require the manipulation or transformation of stored representations, nor is it necessary to form or apply any abstract rule or category representations to stored information. Again, the deficit may not be at the level of biasing representations for further processing and storage but at the stage where manipulations must be performed or rules must be applied. These more complex processes also likely implicate the prefrontal cortex but suggest that a much more finely differentiated view of prefrontal function is needed to account for areas of intact and impaired performance in SC. Two of the tasks that have been widely examined as examples of context processing or cognitive control deficits in SC—the Stroop and AX versions of the CPT tasks—involve significant response competition and inhibition (Cohen, Barch, Carter, & Servan-Schreiber 1999). In both tasks, context or goal representations are thought to bias processing away from a prepotent response in favor of more task-appropriate responses. The fact that participants with SC were able to bias processing of perceptual representations for WM storage raises the possibility that the deficit in SC is far more specific. That is, the illness may com-
GOLD ET AL.
672
promise the ability to use goal representations to modulate and inhibit response selection but not the ability to appropriately bias and select perceptual representations. Again, this suggests that it is not a problem with the ability to represent goals but is a more specific failure in the ability of the prefrontal cortex to modulate the processing in specific systems, such as response selection. Whether these failures implicate an intrinsic, highly specific prefrontal abnormality or an abnormality within these other (nonfrontal) systems remains a question for future work. At a minimum, however, our results strongly suggest that some frontal functions in SC are surprisingly intact, even in the face of robust challenge. Demonstrating areas of preserved performance may be particularly important in guiding theorizing about the nature of cognitive impairment in SC. The challenge facing the field is not adding to the encyclopedic collection of deficits documented in the literature (a collection that grows monthly), but developing larger models that can explain the overall pattern of findings in the literature. Areas of preserved performance may serve as critical constraints for such models. That is, mechanisms that are proposed as underlying the multitude of deficits documented in the illness must not rule out the possibility of intact performance in specific domains. The data from these experiments suggest that any model of the cognitive impairment of SC needs to account for the intact operation of selective attention in the service of WM encoding.
References American Psychiatric Association. (1994). Diagnostic and statistical manual of mental disorders (4th ed.). Washington, DC: Author. Averbach, E., & Coriel, A. S. (1961). Short-term memory in vision. Bell System Technical Journal, 40, 309 –328. Barch, D. (2005). The cognitive neuroscience of schizophrenia. Annual Review of Clinical Psychology, 1, 321–353. Bleuler, E. (1950). Dementia praecox or the group of schizophrenias (J. Zinkin, Trans.). New York: International Universities Press. (Original work published 1911) Bustillo, J. R., Thaker, G., Buchanan, R. W., Moran, M., Kirkpatrick, B., & Carpenter, W. T., Jr. (1997). Visual information-processing impairments in deficit and nondeficit schizophrenia. American Journal of Psychiatry, 154, 647– 654. Carrasco, M., Ling, S., & Read, S. (2004). Attention alters appearance. Nature Neuroscience, 7, 308 –313. Cohen, J. D., Barch, D. M., Carter, C., & Servan-Schreiber D. (1999). Context-processing deficits in schizophrenia: Converging evidence from three theoretically motivated cognitive tasks. Journal of Abnormal Psychology, 108, 120 –133. Cohen, J. D., & Servan-Schreiber, D. (1992). Context, cortex, and dopamine: A connectionist approach to behavior and biology in schizophrenia. Psychological Review, 99, 45–77. Corbetta, M., & Shulman, G. L. (2002). Control of goal-directed and stimulus-driven attention in the brain. Nature Reviews Neuroscience, 3, 201–215. Cowan, N. (2001). The magical number 4 in short-term memory: A reconsideration of mental storage capacity. Behavioral and Brain Sciences, 24, 87–114. Cowan, N., Elliot, E. M., Saults, J. S., Morey, C. C., Mattox, S., Hismjatullina, A., & Conway, A. R. (2005). On the capacity of attention: Its estimation and its role in working memory and cognitive aptitudes. Cognitive Psychology, 51, 42–100. Egeth, H. E., Virzi, R. A., & Garbart, H. (1984). Searching for conjunctively defined targets. Journal of Experimental Psychology: Human Perception and Performance, 10, 32–39. Elvevag, B., Weinberger, D. R., Suter, J. C., & Goldberg, T. E. (2000).
Continuous Performance Test and schizophrenia: A test of stimulus– response compatibility, working memory, response readiness, or none of the above. American Journal of Psychiatry, 157, 772–780. First, M. B., Spitzer, R. L., Miriam, G., & Williams, J. B. W. (1997a). Structured Clinical Interview for DSM–IV Axis I Disorders (SCID-I). Washington, DC: American Psychiatric Press. First, M. B., Spitzer, R. L., Miriam, G., & Williams, J. B. W. (1997b). Structured Clinical Interview for DSM–IV Personality Disorders (SCIDII). Washington, DC: American Psychiatric Press. Fuller, R. L., Luck, S. J., McMahon, R. P., & Gold, J. M. (2005). Working memory consolidation is abnormally slow in schizophrenia. Journal of Abnormal Psychology, 114, 279 –290. Gold, J. M., Carpenter, C., Randolph, C., Goldberg, T. E., & Weinberger, D. R. (1997). Auditory working memory and Wisconsin Card Sorting Test performance in schizophrenia. Archives of General Psychiatry, 54(2), 159 –165. Gold, J. M., Wilk, C. M., McMahon, R. P., Buchanan, R. W., & Luck, S. J. (2003). Working memory for visual features and conjunctions in schizophrenia. Journal of Abnormal Psychology, 112, 61–71. Goldman-Rakic, P. S. (1999). The physiological approach: Functional architecture of working memory and disordered cognition in schizophrenia. Biological Psychiatry, 46, 650 – 661. Henderson, J. M., & Macquistan, A. D. (1993). The spatial distribution of attention following an exogenous cue. Perception and Psychophysics, 53, 221–230. Hillyard, S. A., Vogel, E. K., & Luck, S. J. (1998). Sensory gain control (amplification) as a mechanism of selective attention: Electrophysiological and neuroimaging evidence. Philosophical Transactions of the Royal Society of London. Biological Sciences, 353, 1257–1270. Irwin, D. E., & Andrews, R. V. (1996). Integration and accumulation of information across saccadic eye movements. In T. Inui & J. L. McClelland (Eds.), Attention and performance XVI (pp. 125–155). Cambridge, MA: MIT Press. Javitt, D. C., Strous, R. D., Grochowski, S., Ritter, W., & Cowan, N. (1997). Impaired precision, but normal retention, of auditory sensory (“echoic”) memory information in schizophrenia. Journal of Abnormal Psychology, 106, 315–324. Johnston, J. C., McCann, R. S., & Remington, R. W. (1995). Chronometric evidence for two types of attention. Psychological Science, 6, 365–369. Jonides, J. (1981). Voluntary versus automatic control over the mind’s eye’s movement. In J. B. Long & A. D. Baddeley (Eds.), Attention and performance IX (pp. 187–203). Hillsdale, NJ: Erlbaum. Keefe, R. S. E. (2000). Working memory dysfunction and its relevance to schizophrenia. In T. Sharma & P. Harvey (Eds.), Cognition in schizophrenia (pp. 16 –50). New York: Oxford University Press. Kraepelin, E. (1971). Dementia praecox and paraphrenia (R. M. Barclay, Trans.). Huntington, NY: Krieger. (Original work published 1919) Lee, J., & Park, S. (2005). Working memory impairments in schizophrenia: A meta-analysis. Journal of Abnormal Psychology, 144, 599 – 611. Lencz, T., Bilder, R. M., Turkel, E., Goldman, R. S., Robinson, D., Kane, J. M., & Lieberman, J. A. (2003). Impairments in perceptual competency and maintenance on a visual delayed match-to-sample test in firstepisode schizophrenia. Archives of General Psychiatry, 60(3), 238 –243. Luck, S. J., & Vecera, S. P. (2002). Attention. In H. Pashler (Series Ed.) & S. Yantis (Vol. Ed.), Stevens’ handbook of experimental psychology: Vol. 1: Sensation and perception (3rd ed., pp. 235–286). New York: Wiley. Luck, S. J., & Vogel, E. K. (1997, November 20). The capacity of visual working memory for features and conjunctions. Nature, 390, 279 –281. MacDonald, A. W., III, Carter, C. S., Kerns, J. G., Ursu, S., Barch, D. M., Holmes, A. J., et al. (2005). Specificity of prefrontal dysfunction and context processing deficits to schizophrenia in never-medicated patients with first-episode psychosis. American Journal of Psychiatry, 162, 475– 484.
ATTENTIONAL CONTROL OF WORKING MEMORY Macmillan, N. A., & Creelman, C. D. (1991). Detection theory: A user’s guide. New York: Cambridge University Press. Miller, G. A. (1956). The magical number seven plus or minus two: Some limits on our capacity for processing information. Psychological Review, 63, 81–97. Miyake, A., & Shah, P. (1999). Models of working memory: Mechanisms of active maintenance and executive control. Cambridge: Cambridge University Press. Nestor, P. G., Faux, S. F., McCarley, R. W., Penhune, V., Shenton, M. E., & Pollak, S. (1992). Attentional cues in chronic schizophrenia: Abnormal disengagement of attention. Journal of Abnormal Psychology, 101, 682– 689. Nuechterlein, K. H. (1977). Reaction time and attention in schizophrenia: A critical evaluation of the data and theories. Schizophrenia Bulletin, 3, 373– 428. Nuechterlein, K. H., & Dawson, M. E. (1984). Information processing and attentional functioning in the developmental course of schizophrenic disorders. Schizophrenia Bulletin, 10, 160 –203. Park, S., & Holzman, P. S. (1992). Schizophrenics show spatial working memory deficits. Archives of General Psychiatry, 49, 975–982. Pashler, H. (1988). Familiarity and visual change detection. Perception and Psychophysics, 44, 369 –378. Perlstein, W. M., Carter, C. S., Noll, D. C., & Cohen, J. D. (2001). Relation of prefrontal cortex dysfunction to working memory and symptoms in schizophrenia. American Journal of Psychiatry, 158, 1105–1113. Posner. M. I. (1980). Orienting of attention. Quarterly Journal of Experimental Psychology, 32, 3–25. Reynolds, J. H., Pasternak, T., & Desimone, R. (2000). Attention increases sensitivity of V4 neurons. Neuron, 26, 548 –550. Schmidt, B. K., Vogel, E. K., Woodman, G. F., & Luck, S. J. (2002). Voluntary and automatic attentional control of visual working memory. Perception and Psychophysics, 64, 754 –763. Shakow, D. (1977). Segmental set. The adaptive process in schizophrenia. American Psychologist, 32, 129 –139. Sperling, G. (1960). The information available in brief visual presentations. Psychological Monographs, 74(Whole No. 498). Tek, C., Gold, J., Blaxton, T., Wilk, C., McMahon, R. P., & Buchanan, R. W. (2002). Visual perceptual and working memory impairments in schizophrenia. Archives of General Psychiatry, 59, 146 –153. Todd, J. J., & Marois, R. (2004). Capacity limit of visual short-term memory in human posterior parietal cortex. Nature, 428, 751–754. Treisman, A. M. (1969). Strategies and models of selective attention. Psychological Review, 76, 282–299.
673
Vogel, E. K., & Machizawa, M. G. (2004). Neural activity predicts individual differences in visual working memory capacity. Nature, 428, 748 –751. Vogel, E. K., Woodman, G. F., & Luck, S. J. (2001). Storage of features, conjunctions, and objects in visual working memory. Journal of Experimental Psychology: Human Perception and Performance, 27, 92–114. Vogel, E. K., Woodman, G. F., & Luck, S. J. (in press-a). Pushing around the locus of selection: Evidence for the flexible-selection hypothesis. Journal of Cognitive Neuroscience. Vogel, E. K., Woodman, G. F., & Luck, S. J. (in press-b). The time course of consolidation in visual working memory. Journal of Experimental Psychology: Human Perception and Performance. Weinberger, D. R., Egan, M. F., Bertolino, A., Callicott, J. H., Matay, V. S., Lipska, B. K., et al. (2001). Prefrontal neurons and the genetics of schizophrenia. Biological Psychiatry, 50, 825– 844. Weiss, K. M., Vrtunksi, P. B., & Simpson, D. M. (1988). Information overload disrupts digit recall performance in schizophrenics. Schizophrenia Research, 1, 299 –303. Wheeler, M. E., & Treisman, A. M. (2002). Binding in short-term visual memory. Journal of Experimental Psychology: General, 131, 48 – 64. Wilk, C. M., Gold, J. M., Humber, K., Dickerson, F., Fenton, W. S., & Buchanan, R. W. (2004). Brief cognitive assessment in schizophrenia: Normative data for the Repeatable Battery for the Assessment of Neuropsychological Status (RBANS). Schizophrenia Research, 70, 175– 186. Wilkinson, G. S. (1993). The Wide Range Achievement Test: 3. Administration manual. Wilmington, DE: Wide Range. Woodman, G. F., Vecera, S. P., & Luck, S. J. (2003). Perceptual organization influences visual working memory. Psychonomic Bulletin and Review, 10, 80 – 87. Xu, Y. (2002a). Encoding color and shape from different parts of an object in visual short-term memory. Perception and Psychophysics, 64, 1260 – 1280. Xu, Y. (2002b). Limitations of object-based feature encoding in visual short-term memory. Journal of Experimental Psychology, Human Perception and Performance, 28, 458 – 468. Zubin, J. (1975). Problem of attention in schizophrenia. In S. Sutton & J. Zubin (Eds.), Experimental approaches to psychopathology (pp. 139 – 166). New York: Academic Press.
Received October 20, 2005 Revision received March 23, 2006 Accepted March 27, 2006 䡲