sensors Article
Hierarchical Stereo Matching in Two-Scale Space for Cyber-Physical System Eunah Choi 1 , Sangyoon Lee 2 and Hyunki Hong 2, * 1 2
*
Department of Imaging Science and Arts, GSAIM, Chung-Ang University, 221 Huksuk-dong, Dongjak-ku, Seoul 156-756, Korea;
[email protected] School of Integrative Engineering, Chung-Ang University, 221 Huksuk-dong, Dongjak-ku, Seoul 156-756, Korea;
[email protected] Correspondence:
[email protected]; Tel.: +82-2-820-5417
Received: 26 June 2017; Accepted: 18 July 2017; Published: 21 July 2017
Abstract: Dense disparity map estimation from a high-resolution stereo image is a very difficult problem in terms of both matching accuracy and computation efficiency. Thus, an exhaustive disparity search at full resolution is required. In general, examining more pixels in the stereo view results in more ambiguous correspondences. When a high-resolution image is down-sampled, the high-frequency components of the fine-scaled image are at risk of disappearing in the coarse-resolution image. Furthermore, if erroneous disparity estimates caused by missing high-frequency components are propagated across scale space, ultimately, false disparity estimates are obtained. To solve these problems, we introduce an efficient hierarchical stereo matching method in two-scale space. This method applies disparity estimation to the reduced-resolution image, and the disparity result is then up-sampled to the original resolution. The disparity estimation values of the high-frequency (or edge component) regions of the full-resolution image are combined with the up-sampled disparity results. In this study, we extracted the high-frequency areas from the scale-space representation by using difference of Gaussian (DoG) or found edge components, using a Canny operator. Then, edge-aware disparity propagation was used to refine the disparity map. The experimental results show that the proposed algorithm outperforms previous methods. Keywords: stereo matching; scale space image; disparity map; difference of Gaussian; Canny edge detector; cost aggregation
1. Introduction A cyber-physical system (CPS) consists of various physical and software components, such as smart grids, autonomous automobile systems, process control systems, robotics systems, and automatic pilot avionics. CPSs monitor the physical processes, make decentralized decisions and trigger actions, communicating and cooperating with each other and with humans in real time [1,2]. Vision systems have been widely used in applications related to improving the safety of workers in the industrial environment and for robot guidance. Autonomous automobile and mobile robotics systems require 3D depth information to interact with the real world or human beings. Stereo vision is used to obtain an accurate and detailed 3D representation of a real scene in a manner similar to the human vision system. A stereo camera can help automobile and mobile robotics systems navigate a real environment better by using depth to segment the objects of interest and background elements. The depth information is combined with monocular image features to better recognize and match features between consecutive frames. In addition, a hybrid stereo matching system that combines active and passive stereo vision was proposed to handle untextured regions [3]. Stereo matching algorithms are broadly classified into local and global matching methods [4]. The former sums pixelwise matching costs, whereas the latter supports piecewise smooth disparity Sensors 2017, 17, 1680; doi:10.3390/s17071680
www.mdpi.com/journal/sensors
Sensors 2017, 17, 1680
2 of 15
selection at every pixel simultaneously [4–17]. Global methods define a global energy function that includes a data term and a smoothness term. In order to find the minimum of the global energy function, various global optimizers such as dynamic programming (DP) [5,6], belief propagation [7], and graph cuts [8] are used. Most global stereo methods are computationally expensive and involve many parameters. Local algorithms select the disparity hypothesis with the minimal matching cost at the pixel and are therefore efficient and easy to implement. In addition, stereo matching methods consist of four individual components: matching cost computation, cost aggregation, disparity computation, and disparity refinement [4]. In stereo vision, the recovery of an accurate disparity map remains a challenge because of occlusion problems, illumination effects and imaging sensor noise. The goal of stereo vision is to determine a precise disparity that indicates the difference in the corresponding pixel position between stereo views. A higher resolution of the examined image results in more correct depth information being obtained. However, as the image resolution increases, the computation load required to establish correspondence points increases. Furthermore, the more pixels in the stereo view are examined, the greater the number of matching candidate pixels, and the matching ambiguities are considerably increased. A few stereo matching methods have recently been proposed to handle high-resolution images in near-real time [9–11]. This paper presents a hierarchical method to obtain a reliable disparity map of high-resolution stereo images in near-real time. To reduce the search space of a block matching algorithm and the redundant contents in image compression, multi-scale image representation has been used actively. In stereo vision, multi-scale representation, called the coarse-to-fine approach, has been used mainly to achieve computational efficiency [12–15]. First, a full-resolution image is scaled down and a disparity range search of the reduced-resolution image is performed efficiently. Then, the disparity values obtained are scaled up to the image’s original resolution. By using coarse-to-fine approaches, computation performance can be improved significantly compared to that of an exhaustive disparity search at full resolution [12]. However, while image smoothing and sub-sampling are performed in discrete scale-space conversion, the high-frequency components of fine-scaled images are at risk of disappearing in a coarse-resolution image. Therefore, when disparity estimates are propagated across scale space in the coarse-to-fine refinement procedure, the disparity estimation results become erroneous. Geiger built a priori information about the disparity value by forming a triangulation on a set of support points that can be robustly matched [9]. This allows efficient utilization of the disparity search space and a reduction of the matching ambiguities of the remaining points. However, the priors based on the support points are likely to fail to reconstruct poorly-textured and slanted surfaces. Sinha employed local slanted plane sweeps for disparity hypotheses in semi-global matching [10]. The local plane hypotheses are derived from initial sparse feature correspondences, and the local plane sweeps are then performed around each slanted plane to produce a globally optimal disparity value. In general, disparity plane estimation is a time-consuming procedure and additional consideration of large and untextured areas is needed. Zhao described a progressive multi-resolution pipeline that includes background modeling and dense matching with adaptive windows [11]. To achieve a high-resolution disparity map, the stereo search area is limited to the span range that is centered at the suggestion from the disparity estimation values in the lower resolution. This coarse-to-fine approach can improve computation performance significantly. However, the method is at risk of falling into a local minimum in the case of a real-world scene composed of complex objects and backgrounds. In other words, when a false matching result is obtained from the coarse-resolution image, the matching accuracy deteriorates considerably because of false disparity suggestion over scale space. In two-scale space representation (both coarse- and fine-resolution stereo images), the method proposed computes the initial matching costs by applying absolute difference (AD)-census and then aggregates the matching costs in cross-based support regions [16,17]. By using difference of Gaussian (DoG), the method proposed obtains high-frequency regions from the full-resolution image. DoG is the difference of two Gaussian averaging masks with substantially different standard deviation
Sensors 2017, 17, 1680
3 of 15
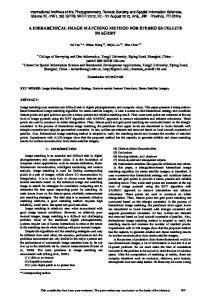
parameters [18]. In addition, the edge components in the original resolution image are detected by a Canny operator. In the original resolution image, we compute the disparity value from only either Sensors 2017, 17, 1680 3 of 15 the high-frequency regions or the edge components. In order to discriminate the inliers and the outliers (occluded and false-matching a left-right (LRC) check is employed the pixels high-frequency regions or the pixels), edge components. In consistency order to discriminate the inliers and the in the outliers (occluded and false-matching a left-right (LRC) check employed two-scale stereo image. pixels The disparity results inpixels), the coarse scaleconsistency are up-sampled into isthe full-resolution in the two-scale stereo image. The disparity results in the coarse scale are up-sampled into the fullimage, and the up-sampled disparity results are combined with the disparity estimation results in resolution image, and the up-sampled disparity results are combined with the disparity estimation the fine-resolution image. Here, the DoG intensity ratio with respect to the maximum DoG value is results in the fine-resolution image. Here, the DoG intensity ratio with respect to the maximum DoG used. Invalue the case of In edge components, the rectangular area around the obtained edge can is used. the case of edge components, the rectangular area around the obtained edge canbebeused for disparity estimation. Edge-aware disparity propagation (EDP), where disparities are propagated used for disparity estimation. Edge-aware disparity propagation (EDP), the where the disparities are propagated costas domain, is used as geodesic edge cost information [19].iterative in the cost domain,inisthe used geodesic filtering basedfiltering on edgebased coston information [19]. Finally, Finally, iterative voting points with reliable ground points refinementWe are demonstrate employed. We the demonstrate voting with reliable ground and refinement areand employed. effectiveness of the effectiveness of our approach in terms of both accuracy and computational speed using largeour approach in terms of both accuracy and computational speed using large-resolution Middlebury resolution Middlebury benchmark images. Figure 1 shows the block diagram of the proposed benchmark images. Figure 1 shows the block diagram of the proposed algorithm. algorithm.
Figure 1. Proposed block diagram.
Figure 1. Proposed block diagram. 2. Proposed Method
2. ProposedAMethod hierarchical stereo matching method provides an efficient coarse-to-fine mechanism to estimate 3D depth information. high-frequency ofcoarse-to-fine a fine-resolutionmechanism image are at risk A hierarchical stereo matchingThe method providescomponents an efficient to estimate of disappearing in the down-sampling procedure. In addition, when erroneous disparity estimates 3D depth information. The high-frequency components of a fine-resolution image are at risk of are propagated across scale space, false disparity estimates are obtained. Since the maximum disappearing inlevel the (the down-sampling procedure. In addition, image, when the erroneous estimates are disparity search space) increases in a high-resolution likelihooddisparity of false disparity propagated across scalealso space, false disparity estimates areproblems, obtained.weSince the maximum disparity estimation results increases. In order to solve these efficiently combine the level (the search estimation space) increases high-resolution image, thewith likelihood of false disparity estimation disparity results in in athe coarse-resolution image the disparity results in highfrequency regions the fine-resolution image. results also increases. Inoforder to solve these problems, we efficiently combine the disparity estimation results in the coarse-resolution image with the disparity results in high-frequency regions of the 2.1. Initial Matching Cost Computing fine-resolution image. Given an anchor pixel p = (x, y) in the left image (reference view) ILeft and its candidate correspondence pd Computing = (x − d, y) in the right image (target view) IRight, two individual cost volumes 2.1. Initial Matching Cost
Given an anchor pixel p = (x, y) in the left image (reference view) ILeft and its candidate correspondence pd = (x − d, y) in the right image (target view) IRight , two individual cost volumes
Sensors 2017, 17, 1680
4 of 15
CAD (p, d) and Ccensus (p, d) are computed. The two cost volumes are combined to obtain an initial matching cost Cinitial (p, d) along the disparity range d [16]. CAD (p, d) is defined as the average intensity difference of p and pd in RGB channels in Equation (1). On the assumption that input stereo images are rectified, the y coordinate component is usually omitted. Sensors 2017, 17, 1680
4 of 15
1 ft Right Le CAD(p, d) and Ccensus(p, d)C AD are (computed. two cost volumes are combined to obtain an initial p, d) = The ( p ) − I ( pd ) I ∑ i i 3 matching cost Cinitial(p, d) along the disparity range d [16]. CAD(p, d) is defined as the average intensity i = R,G,B difference of p and pd in RGB channels in Equation (1). On the(assumption that input stereo images 1, if p < pn are rectified, the y coordinate component is usually omitted. C (p) = ⊗ ξ (p, pn ), ξ (p, pn ) = 1 (1) Left Right 0, otherwise pnC∈ N((pp,)d ) I (p) I (pd) AD
3 i R ,G , B
i
(1)
(2)
i
1, if p p n ), Cinitial (p, d) = ρ(Ccensus (p, p n ), ) ξ+(p,ρp(nC ) AD C (p) (p,d ),ξλcensus (p, d ), λ AD p N ( p ) 0, otherwise
n
c (2) ) ρ(c, λ) = 1 − exp(− λ
(3)
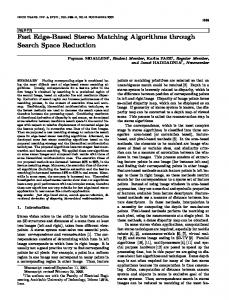
By comparing the brightness value of the neighborhood pixel with that cof an anchor pixel, (3) census Cinitial(p, d ) ρ(Ccensus(p, d ), λcensus) ρ(CAD(p, d ), λAD), ρ(c, λ) 1 exp( ) λ transform converts the relative orderings of the pixel intensities to binary strings. The bit string C(p) comparing brightnessby value the neighborhood pixel with an anchor pixel, census is computedByas a value the compared theofoperator ⊗, subjected tothat theofbrightness value of anchor transform converts the relative orderings of the pixel intensities to binary strings. The bit string C(p) pixel p, and the brightness value of neighborhood pixel N(p) in a census window of a fixed size and is computed as a value compared by the operator , subjected to the brightness value of anchor shape. Ccensus (p, d) is defined as the Hamming distance of the two bit strings p in the left image pixel p, and the brightness value of neighborhood pixel N(p) in a census window of a fixed size and and its correspondence in the right image.distance Figureof2 the shows anstrings example of census transform and shape. Ccensus(p, d) ispd defined as the Hamming two bit p in the left image and its its Hamming distance result, which is used to build the 3D disparity space. In this study, a 9 ×7 correspondence pd in the right image. Figure 2 shows an example of census transform and its Hamming distance result, which is used to build the 3D disparity space. In this study, a 9 × 7 rectangular window was employed for census transform. The estimation results yielded by the AD window methods was employed for census transform. The estimation resultsasyielded AD and the rectangular census transform are combined in an exponential function, shownbyinthe Equation (3). and the census transform methods are combined in an exponential function, as shown in This function maps different cost measures to the range [0, 1] and controls easily the influence of the Equation (3). This function maps different cost measures to the range [0, 1] and controls easily the outliers influence with theofλthe parameter. Here, 10 are andset30, AD and λcensus outliers with the λλparameter. Here, are λAD set andto λcensus to respectively. 10 and 30, respectively.
(a)
(b) Figure 2. (a) Example of census transform; (b) Its hamming distance result.
Figure 2. (a) Example of census transform; (b) Its hamming distance result. Because the AD measure examines only the pixel intensity, it is affected significantly by illumination changes. The census transform encodes image structures relative orderings of Because the AD measure examines only the local pixel intensity, it with is affected significantly by the pixel intensities thantransform the intensity value itself, order tostructures tolerate outliers are caused illumination changes. Therather census encodes localinimage with that relative orderings of the pixel intensities rather than the intensity value itself, in order to tolerate outliers that are caused
Sensors 2017, 17, 1680
5 of 15
by radiometric changes and image noise. Instead of using color difference between image views, we calculate the absolute difference of the Laplacian transformed images to alleviate the unwanted Sensors 2017,camera’s 17, 1680 5 of 15 effects of the parallax. The initial matching costs of the AD-census method are aggregated in cross-based support regions [17]. For each pixel, an upright cross local support skeleton region is by radiometric changes and image noise. Instead of using color difference between image views, we adaptively constructed by considering the color similarity, as well as the connectivity constraints. calculate the absolute difference of the Laplacian transformed images to alleviate the unwanted More an parallax. upright (the vertical and horizontal) cross with four armsare is aggregated constructed for effectsspecifically, of the camera’s The initial matching costs of the AD-census method an anchor pixel p. The endpoints p of the horizontal and vertical directions with respect to the pixel p e in cross-based support regions [17]. For each pixel, an upright cross local support skeleton region is are determined by examining the color distance the as spatial distance Dconstraints. adaptively constructed by considering the colorD similarity, as well the connectivity c (p, pe ) and s (p, pe ), as shown More specifically, an upright (the vertical and horizontal) with arms is constructed for the in Equation (4). By computing the color difference between cross pe and itsfour predecessor pe + 1 along an anchor pixel(left, p. The endpoints pe bottom) of the horizontal directions to the pixelin the scanning direction right, up, and of each and arm,vertical the arm does notwith run respect across the edges p are determined by examining thepixel colorpdistance Dc(p,by pe) merging and the spatial distance Darms s(p, pe), as shown image. Then, the support region for is modeled the horizontal of all the pixels in Equation (4). By computing the color difference between p e and its predecessor pe + 1 along the lying on p’s vertical arms. The matching costs of the AD-census measure are summed horizontally and scanning direction (left, right, up, and bottom) of each arm, the arm does not run across the edges in stored as the intermediate results. Then, the intermediate results are aggregated vertically to obtain the image. Then, the support region for pixel p is modeled by merging the horizontal arms of all the the final costs. Both passes can be efficiently computed with 1D integral images [17]. pixels lying on p’s vertical arms. The matching costs of the AD-census measure are summed horizontally and stored as the intermediate results. Then, the intermediate results are aggregated Dc (pe , p)to 1 Non-Occluded Pixels: Error > 2 Cones Teddy Baby3 Art Lamp2 Cones Teddy Baby3 Art Lamp2 Methods Cones Teddy Baby3 Art Lamp2 Cones Teddy Baby3 Art Lamp2 Felzenszwalb [25] 15.2 18.7 13.0 23.3 32.0 7.8 11.4 7.0 16.5 26.0 Felzenszwalb [25] 15.2 18.7 13.0 23.3 32.0 7.8 11.4 7.0 16.5 26.0 Kolmogorov[26] [26] 16.5 26.2 30.3 30.3 65.7 65.7 8.1 19.0 21.0 60.7 Kolmogorov 8.28.2 16.5 26.2 4.14.1 8.1 19.0 21.0 60.7 Cech[27] [27] 15.8 17.4 18.8 18.8 36.7 36.7 10.2 9.7 11.2 27.1 Cech 7.27.2 15.8 17.4 4.44.4 10.2 9.7 11.2 27.1 Kostková [28] 7.2 13.5 13.5 14.2 17.9 17.9 31.5 31.5 5.3 10.1 8.2 13.0 26.7 Kostková [28] 7.2 14.2 5.3 10.1 8.2 13.0 26.7 Geiger [9] 5.0 11.5 10.8 13.3 17.5 2.7 7.3 4.5 8.7 10.4 Geiger [9] 5.0 11.5 10.8 13.3 17.5 2.7 7.3 4.5 8.7 10.4 Proposed method (Canny) 4.7 8.5 4.9 10.8 7.9 1.6 4.3 2.1 8.0 4.0 4.7 8.5 4.9 10.8 7.9 1.6 2.1 8.0 4.0 Proposed method (Canny) 4.3 Proposed method (DOG) 4.8 8.7 5.2 10.8 8.0 1.7 4.2 2.3 8.1 4.1 10.8 4.2 Proposed method (DOG) 4.8 8.7 5.2 8.0 1.7 2.3 8.1 4.1
(a)
(b)
(c) Figure 7. Cont.
Sensors 2017, 17, 1680
10 of 15
Sensors 2017, 17, 1680
10 of 15
(d)
(e)
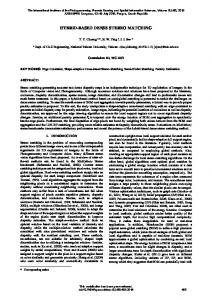
(f) Figure 7. (a) Reference images (Middlebury) and (b) ground truth disparity maps; Disparity maps by
Figure 7. (a) Reference images (Middlebury) and (b) ground truth disparity maps; Disparity maps by (c) dual-cross-bilateral (DCB) grid [23]; (d) adaptive weight [21]; (e) MGM [24]; and (f) proposed (c) dual-cross-bilateral (DCB) grid [23]; (d) adaptive weight [21]; (e) MGM [24]; and (f) proposed method. method.
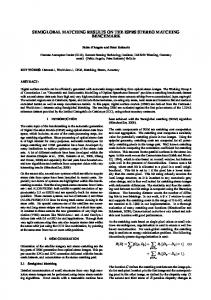
Figure 8 shows a comparison theerror error rates rates with the threshold values of the Figure 8 shows a comparison ofofthe withrespect respecttoto the threshold values ofCanny the Canny detector and DoG method. When the double threshold values of the Canny detector were set to 100set to detector and DoG method. When the double threshold values of the Canny detector were and 200, the best performances were obtained in this experiment. In the case of DoG, a threshold 100 and 200, the best performances were obtained in this experiment. In the case of DoG, a threshold value of 100% means that all the disparity values in high-frequency components are used to combine value of 100% means that all the disparity values in high-frequency components are used to combine the disparity values of the two-scaled images. The method proposed obtains a more precise disparity the disparity values of the two-scaled images. The method proposed obtains a more precise disparity map of a high-resolution image by considering the high-frequency components in two-scale space. map of a high-resolution image by considering the high-frequency components in two-scale The experiment was performed using an outdoor and indoor scene image sequence, which space. is a The experiment performed usinginan and indoor scene image sequence, which real-world stereo was video clip captured anoutdoor uncontrolled environment, as shown in Figure 9. is a real-world video capturedresults in an of uncontrolled environment, as shown in Figure 9. Figure Figurestereo 10 shows theclip comparison the stereo methods for computer-generated images and 10 their truth disparity [23]. methods for computer-generated images and their ground shows theground comparison results ofmaps the stereo truth disparity maps [23].
Sensors 2017, 17, 1680 Sensors 2017, 17, 1680 Sensors 2017, 17, 1680
11 of 15 11 of 15 11 of 15
(a) (a)
(b) (b)
Figure8. 8. Comparison Comparison of error rates with respect to the threshold values ofof (a)(a) Canny detector and (b) Figure errorrates rateswith withrespect respect the threshold values Canny detector Figure 8. Comparison ofoferror toto the threshold values of (a) Canny detector andand (b) DoG method. (b) DoG method. DoG method.
(a) (a)
(b) (b)
(c) (c)
(d) (d)
(e) (e) Figure 9. (a) Outdoor and indoor scene images; Disparity maps produced by (b) DCB grid [23]; (c) Figure 9. and indoor scene images; Disparity maps produced by by (b) (b) DCB gridgrid [23];[23]; (c) Figure 9. (a) (a)Outdoor Outdoor and indoor images; Disparity maps produced DCB adaptive weight [21]; (d) MGM [24];scene and (e) proposed method. adaptive weight [21]; (d) MGM [24]; and (e) proposed method. (c) adaptive weight [21]; (d) MGM [24]; and (e) proposed method.
The entire algorithm was implemented on a general-purpose computing on graphics processing The entire algorithm was implemented on a general-purpose computing on graphics processing The entire algorithm implemented on a general-purpose computing on graphics processing units (GPGPU) using the was Compute unified device architecture (CUDA) language, and could achieve units (GPGPU) using the Compute unified device architecture (CUDA) language, and could achieve units the Compute unified language, could achieve is a a rate(GPGPU) of over using 5.0 frames per second fordevice stereoarchitecture images of (CUDA) 1300 × 1100 pixels.and If our program a rate of over 5.0 frames per second for stereo images of 1300 × 1100 pixels. If our program is optimized in the near future, the computational time performance will be considerably improved. optimized in the near future, the computational time performance will be considerably improved. The method proposed is designed to obtain a reliable disparity map of high-resolution stereo images The method proposed is designed to obtain a reliable disparity map of high-resolution stereo images
Sensors 2017, 17, 1680
12 of 15
rate of over 5.0 frames per second for stereo images of 1300 × 1100 pixels. If our program is optimized in the near future, the computational time performance will be considerably improved. The method proposed designed Sensors is 2017, 17, 1680 to obtain a reliable disparity map of high-resolution stereo images in12near-real of 15 time. Therefore, two previous methods [9,10] for the same purpose are described and compared in time. Therefore, two previous methods for the same and was termsinofnear-real computation performance. The running time[9,10] reported in [9] forpurpose a 900 ×are 750described pixel image compared in terms of computation performance. The running time reported in [9] for a 900 × 750 669 msec, and the averaged running time in [10] for 1.4 megapixels (MP) to 2.7 MP was about 3.8 sec. pixel image was 669 msec, and the averaged running time in [10] for 1.4 megapixels (MP) to 2.7 MP In conclusion, the method proposed achieves a better performance in terms of computational speed was about 3.8 sec. In conclusion, the method proposed achieves a better performance in terms of than computational two algorithms. speed than two algorithms.
(a)
(b)
(c)
(d)
(e)
(f) Figure 10. (a) Computer generated images and (b) ground truth disparity maps [23]; Disparity maps
Figure 10. (a) Computer generated images and (b) ground truth disparity maps [23]; Disparity maps by (c) DCB grid [23]; (d) adaptive weight [21]; (e) MGM [24]; and (f) proposed method. by (c) DCB grid [23]; (d) adaptive weight [21]; (e) MGM [24]; and (f) proposed method.
Let the width and the height of an input image and the maximum disparity level be W, H, and D, In this stereo matching operations Θ(W × H × D) disparity are performed. Letrespectively. the width and thecase, height of an input image andofthe maximum levelTherefore, be W, H, and dense stereoInmatching high-resolution stereo images requires high computational In D, respectively. this case,instereo matching operations of Θ(W × Ha × D) are performed.cost. Therefore, contrast, the method proposed performs the Θ(W × H × D/8) operation for the reduced-resolution image and Θ(W W × H × DF × D) for the full-resolution image. Here, HF is the relative averaged ratio
Sensors 2017, 17, 1680
13 of 15
dense stereo matching in high-resolution stereo images requires a high computational cost. In contrast, the method proposed performs the Θ(W × H × D/8) operation for the reduced-resolution image and Θ(W W × H × DF × D) for the full-resolution image. Here, HF is the relative averaged ratio of the total area of the high-resolution image to the area of high-frequency regions. In our experiment, HF was set to 3.4%, which is the averaged area ratio of the Middlebury stereo images. For example, the number of stereo matching operations for the Lamp2 image with a 1300 × 1100 resolution with a 260 disparity level is 375,180,000. The number of stereo matching operations of the proposed method is 59,116,200. This means that the computational load for stereo matching is decreased to 15.8%. 4. Conclusions This paper presented a hierarchical stereo matching method to combine disparity estimation results in two-scale space efficiently. In general, the more pixels in a stereo view are examined, the more ambiguous correspondences are obtained. Furthermore, fine-detailed scene components may not be found accurately in a coarse scale. For these reasons, in our method we combine the disparity estimation results of high-frequency regions in the full-resolution image with the up-sampled disparity estimation results in the reduced-resolution image. More specifically, the initial matching cost of every pixel in the coarse scale is computed by using cross-based cost aggregation. High-frequency regions are extracted by DoG or edge components by a Canny operator in the full-resolution image. In the full-resolution image, we compute the initial matching cost of only the pixel in the high-frequency regions or edge components. Then the matching costs of the two-scale images are combined in fine scale. By applying EDP and refinement to the combined disparity results, we can obtain a precise final disparity map. According to the experimental results, the proposed algorithm provides a better performance in terms of both matching accuracy and computation efficiency than previous methods. Previous methods using the local plane sweeps often produce incorrect disparity results in areas with no textures and regions with repeated patterns. In addition, the method using disparity suggestion over scale space cannot obtain the accurate disparity result due to the incorrect initial disparity estimation in the lower resolution image. The method proposed can significantly reduce the matching ambiguity in a large untextured region because the disparity estimation is performed at a lower resolution. Also, the method proposed extracts disparity values from the high-frequency components, which are suitable for local stereo matching, in the high-resolution image. So incorrect disparity values are not propagated over the scale space. The method is proposed in only two scale spaces, which means a method for determining the optimal number of scale spaces according to the input image resolution is needed. Occlusion is the key and challenging problem in stereo matching, because depth maps are significantly influenced by occlusion regions. In the near future, we will consider scene segmentation information such as boundaries and contours to solve the occlusion problem. In addition, more efficient optimization algorithms will be employed for computation performance improvement. Acknowledgments: This research was supported by the Chung-Ang University Research Scholarship Grants in 2016. Author Contributions: Eunah Choi conceived and designed the experiments; and Eunah Choi and Sangyoon Lee performed the experiments; Hyunki Hong authorized the study and made this near-realtime hierarchical stereo matching system available, Sangyoon Lee and Hyunki Hong analyzed the data; Eunah Choi, Sangyoon Lee and Hyunki Hong wrote the paper. Conflicts of Interest: The authors declare no conflict of interest.
References 1. 2.
Khaitan, S.K.; McCalley, J.D. Design techniques and applications of cyber physical systems: A survey. IEEE Syst. J. 2015, 9, 350–365. [CrossRef] Pérez, L.; Rodríguez, Í.; Rodríguez, N.; Usamentiaga, R.; García, D.F. Robot guidance using machine vision techniques in industrial environments: A comparative review. Sensors 2016, 16, 335. [CrossRef] [PubMed]
Sensors 2017, 17, 1680
3. 4. 5. 6.
7.
8. 9. 10.
11. 12. 13.
14. 15. 16.
17. 18. 19. 20. 21. 22. 23.
24. 25. 26.
14 of 15
Chang, J.; Jeong, J.; Hwang, D. Real-time hybrid stereo vision system for HD resolution disparity map. In Proceedings of the British Machine Vision Conference, Nottingham, UK, 1–5 September 2014; pp. 643–650. Scharstein, D.; Szeliski, R. A taxonomy and evaluation of dense two-frame stereo correspondence algorithms. Int. J. Comput. Vis. 2002, 47, 7–42. [CrossRef] Van Meerbergen, G.; Vergauwen, M.; Pollefey, M.; Van Gool, L. A hierarchical symmetric stereo algorithm using dynamic programming. Int. J. Comput. Vis. 2002, 47, 275–285. [CrossRef] Wang, L.; Liao, M.; Gong, M.; Yang, R.; Nistér, D. High quality real-time stereo using adaptive cost aggregation and dynamic programming. In Proceedings of the International Symposium on 3D Data Processing, Visualization and Transmission, Chapel Hill, NC, USA, 14–16 June 2006; pp. 798–805. Yang, Q.; Wan, L.; Yang, R.; Stewénius, H.; Nistér, D. Stereo matching with color-weighted correlation, hierarchical belief propagation and occlusion handling. IEEE Trans. Pattern Anal. Mach. Intell. 2009, 31, 492–504. [CrossRef] [PubMed] Boykov, Y.; Veksler, O.; Zabih, R. Fast approximate energy minimization via graph cuts. IEEE Trans. Pattern Anal. Mach. Intell. 2001, 23, 1222–1239. [CrossRef] Geiger, A.; Roser, M.; Urtasun, R. Efficient large-scale stereo matching. Lect. Notes Comput. Sci. 2011, 6492, 25–38. Sinha, S.N.; Scharstein, D.; Szeliski, R. Efficient high-resolution stereo matching using local plane sweeps. In Proceedings of the Computer Vision and Pattern Recognition, Columbus, OH, USA, 23–28 June 2014; pp. 1582–1589. Zhao, Y.; Taubin, G. Real-time stereo on gpgpu using progressive multi-resolution adaptive windows. J. Image Vis. Comput. 2011, 29, 420–432. [CrossRef] Jen, Y.; Dunn, E.; Georgel, P.; Frahm, J. Adaptive scale selection for hierarchical stereo. In Proceedings of the British Machine Vision Conference, Dundee, UK, 29 August–2 September 2011; pp. 95.1–95.10. Zhang, K.; Fang, Y.; Min, D.; Sun, L.; Yang, S.; Yan, S.; Tian, Q. Cross-scale cost aggregation for stereo matching. In Proceedings of the Conference on Computer Vision and Pattern Recognition, Columbus, OH, USA, 23–28 June 2014; pp. 1590–1597. Yang, R.; Pollefeys, M. Multi-resolution real-time stereo on commodity graphics hardware. In Proceedings of the Conference on Computer Vision and Pattern Recognition, Madison, WI, USA, 18–20 June 2003; pp. 211–218. Sah, S.; Jotwani, N. Stereo Matching Using Multi-resolution Images on CUDA. Int. J. Comput. Appl. 2012, 56, 47–55. [CrossRef] Mei, X.; Sun, X.; Zhou, M.; Jiao, S.; Wan, H.; Zhang, X. On building an accurate stereo matching system on graphics hardware. In Proceedings of the IEEE International Conference on Computer Vision Work-shops on GPUs for Computer Vision, Barcelona, Spain, 6–13 November 2011; pp. 467–474. Zhang, K.; Jiangbo, L.; Lafruit, G. Cross-based local stereo matching using orthogonal integral images. IEEE Trans. Circuits Syst. Video Technol. 2009, 19, 1073–1079. [CrossRef] Marr, D.; Hildreth, E. Theory of edge detection. Proc. R. Soc. Lond. Ser. B Biol. Sci. 1980, 207, 215–217. [CrossRef] Sun, X.; Mei, X.; Jio, S.; Zhou, M.; Liu, Z.; Wang, H. Real-time local stereo via edge-aware disparity propagation. Pattern Recognit. Lett. 2014, 49, 201–206. [CrossRef] Kanade, T.; Okutomi, M. A stereo matching algorithm with an adaptive window theory and experiment. IEEE Trans. Pattern Recognit. Mach. Intell. 1994, 16, 920–931. [CrossRef] Yoon, K.; Kweon, I. Adaptive support-weight approach for correspondence search. IEEE Trans. Pattern Anal. Mach. Intell. 2006, 28, 650–656. [CrossRef] [PubMed] Middlebury Stereo Vision. Available online: http://vision.middlebury.edu/stereo/ (accessed on 16 December 2015). Richardt, C.; Orr, D.; Davies, I.; Criminisi, A.; Dodgson, A. Real-time spatiotemporal stereo matching using the dual-cross-bilateral grid. In Proceedings of the European Conference on Computer Vision, Crete, Greece, 5–11 September 2010; Springer: Berlin/Heidelberg, Germany, 2010; pp. 6311–6316. Facciolo, G.; Franchis, C.; Meinhardt, E. MGM: A significant more global matching for stereovision. In Proceedings of the British Machine Vision Conference, Swansea, UK, 7–10 September 2015; pp. 90.1–90.12. Felzenszwalb, P.; Huttenlocher, D. Efficient belief propagation for early vision. Int. J. Comput. Vis. Wash. 2006, 70, 41–54. [CrossRef] Kolmogorov, V.; Zabih, R. Computing visual correspondence with occlusions using graph cuts. In Proceedings of the International Conference on Computer Vision, Vancouver, BC, Canada, 7–14 July 2001; pp. 508–515.
Sensors 2017, 17, 1680
27. 28.
15 of 15
Cech, J.; Sara, R. Efficient sampling of disparity space for fast and accurate matching. In Proceedings of the Computer Vision and Pattern Recognition, Minneapolis, MN, USA, 17–22 June 2007; pp. 1–8. Kostková, J.; Sára, R. Stratified dense matching for stereopsis in complex scenes. In Proceedings of the British Machine Vision Conference, Norwich, UK, 8–11 September 2003; pp. 339–348. © 2017 by the authors. Licensee MDPI, Basel, Switzerland. This article is an open access article distributed under the terms and conditions of the Creative Commons Attribution (CC BY) license (http://creativecommons.org/licenses/by/4.0/).