resale or redistribution to servers or lists, or to reuse any copyrighted component of this work in ... software applications is challenging, and requires good ... provides tool abstraction views of running "toolie" .... component object monitoring tool.
Copyright 2000 IEEE. Published in the Proceedings of 2000 IEEE Symposium on Visual Languages, Halifax, Nova Scotia. Personal use of this material is permitted. However, permission to reprint/republish this material for advertising or promotional purposes or for creating new collective works for resale or redistribution to servers or lists, or to reuse any copyrighted component of this work in other works, must be obtained from the IEEE. Contact: Manager, Copyrights and Permissions / IEEE Service Center / 445 Hoes Lane / P.O. Box 1331 / Piscataway, NJ 08855-1331, USA. Telephone: + Intl. 732562-3966.
High-level Static and Dynamic Visualisation of Software Architectures John Grundy and John Hosking Department of Computer Science, University of Auckland Private Bag 92019, Auckland, New Zealand {john-g, john}@cs.auckland.ac.nz
Abstract Developing software architectures for complex software applications is challenging, and requires good static and dynamic visualisation support. We describe the visual software architecture modelling visual language we have developed and its support in the SoftArch environment. Static software architecture views are developed using this language, and designs and implementations developed from these specifications. Static views are copied, animated and annotated to visualise running system architecture characteristics. This approach provides better static modelling and dynamic visualisation of software architectures, at varying levels of abstraction, than do other current techniques.
1. Introduction There has been increasing interest in the use of software architecture modelling techniques when developing large software systems [1, 15, 20]. Developers require visual modelling support to help them effectively design and reason about the software components of complex applications [13, 15]. They also require dynamic visualisations to allow them to understand running software systems [2, 21]. Ideally these static and dynamic visualisation approaches are consistent and complementary. A variety of approaches and tools have been developed to assist developers in visualising software architectures. The Unified Modelling Language (UML) [17] uses a combination of class, collaboration, component and deployment diagrams. Clockworks and JComposer use annotated component diagrams [5, 8]. PARSE-DAT uses process diagrams. Several systems, including SAAMTool [13], Argo [19] and Visper [22], use various kinds of structural architecture component diagrams. All of these only offer static modelling diagrams. Most lack a wide enough range of abstractions or focus on only low-level architecture details. ViTABaL provides tool abstraction views of running "toolie" components [6]. JVisualise [6] and Cerno-II [12] provide low-level component and object visualisation together with some aggregated object performance visualisations.
Various program visualisation tools have been developed [2, 14, 18, 21], which provide a mixture of views of running program information. Most of these systems focus on object or algorithm-level dynamic visualisation techniques, rather than architectural component visualisation. Most dynamic visualisations are inconsistent with static visualisation structures, making them hard to understand. We have been developing the SoftArch environment, which supports both static and dynamic visualisation of software architecture components at varying levels of abstraction. SoftArch provides a range of architecture modelling and visualisation representations and tools. A meta-model defines allowable architectural abstractions and multiple, visual modelling views capture various perspectives on architectural components and interrelationships. SoftArch uses the JComposer CASE tool [8] to generate classes and complete system implementation. The JVisualise monitoring and object visualisation tool [8] is used to detect run-time events, such as object creation and method calls, and forwards these to SoftArch. SoftArch static architectural views are copied, annotated and animated to provide developers with multiple, high-level execution architectural visualisations.
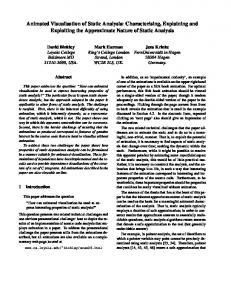
2. Related Work Figure 1 (a) shows a screen dump from an on-line video library system we use as an example in the rest of this paper. This application provides customers with applets to find, reserve and review videos, and staff with applications to rent/return videos, maintain staff, customer and video information and generate reports. When designing the architecture of such a system, developers typically require support to: • represent processes, machines, data and other architectural components [5, 9] • represent inter-component relationships, such as data usage, message passing, event subscription/ notification etc. [1, 9] • represent additional architectural characteristics, such as data replication and caching, concurrency etc [5]
(2)
VideoQueryApplet SocketComms
Local software agent
Customer Applet
init( ) login( ) findVideos( )
write/read
connect( ) read( ) write( )
Staff Video Maintence read/write
(1)
VideoQueryServer main( 1..1 0..*
Application Server
HTTP Server
VideoServerThread run( ) processLogin( ) processFindVideos( ) processGetDetails( )
(3) DB Server
1..1 VideoData
1..1 CustomerData ID : int name : String ... findCustomer
ID : int title : String category : String ... findVideo (int) findByTitleAndCategory (String, String) : vector findVideo () updateVideo () setNumCopies ()
RDBMS connect( ) select( ) insert( ) update( ) delete( )
Figure 1 (a) Example application; (b) some example architecture visualisations.
Commonly used modelling techniques like the UML [17] provide views of classes, components and machines. A UML class diagram for part of the video rental program is shown in Figure 1 (b), view (1). Such modelling techniques suit low-level architectural representation reasonably well, but do not provide a range of higher level architectural views [15, 9]. Deployment diagrams in UML offer a view of machine and process assignment and interconnection, but this is the only high-level specifically architectural view in UML, and is quite limited. Argo/UML [19] provides some additional architectural abstractions, such as communication "buses", but does not provide much else in the way of high-level architecture modelling support. Most component composition tools, like JComposer [8] and MET+[25], provide component views, with some higher level associations and properties like event exchange visualised. ClockWorks [5] also uses component diagrams, but with additional architecture "annotations", representing caching, concurrency and replication. Clockworks supports some code generation from these annotations to help automate realisation of such facilities from their visual specifications [24]. PARSE-DAT provides reasonably high level views of processes and inter-process communication [16]. Figure 1 (b), view (2) shows a PARSE-DAT representation of the video library processes (ovals are processing nodes, rectangles data management). Unfortunately PARSE-DAT doesn’t support any OOD or code generation, and is limited to solely basic process views. Other architecture modelling approaches also tend to focus on basic process and/or program structure, such as SAMTool [13]. Most static visualisation approaches
and tools do not support dynamic visualisation using the static representational techniques. Dynamic visualisation of systems is useful for developers to understand system correctness (i.e. to debug them), to understand higher-level system behavioural characteristics that can not be easily determined from static architecture design views and analyses. Tools like JVisualise [6] support object visualisation and object structure querying, but not higher level abstractions. Cerno-II [12] supports aggregate queries and visualisations over object graphs, generating call graphs and map visualisations, but these focus at only the object level, and are hard to scale and interpret for large, distributed applications. Various program visualisation systems have been developed, many offering high-level animations and visualisations of algorithms and object structures. These include VisualLinda [14], Rose/Architect [3], The Software Bookshelf [4], and PvaniM [23], and those using 3D call graphs [18] and object trees [11]. While these visualisations are useful, they typically bear no relation to static architecture modelling languages and views, and are thus difficult to formulate and interpret. ViTABaL [6] provides dynamic views of reasonably high-level system components ("toolies") and their relationships. Figure 1 (b), view (3) shows a ViTABaL visualisation of the video library system, where ovals are toolies, rectangles are data management components, and inter-connections annotated with information about them. While ViTABaL provides some useful dynamic visualisation capabilities, developers must construct these views only from running components, with no static views, limiting its usefulness.
OOA specification Imported from CASE tool e.g. R. Rose
SoftArch Specification of high-level architecture; refinement to successively more detailed architectural static models; eventual specification of partial OOD model for system
Component OOD & some code send to JComposer CASE tool by SoftArch; Implementation completed using JComposer
High-level architectural model
Successively refined architectural models
Updates to static views & dynamic views interchanged to keep each consistent with the other
Low-level architectural model
JComposer CASE Tool
Java Classes & Code
High-level architectural visualisations Successively higher level architecture visualisations Low-level component visualisations
Limited forms of user manipulation used to change running system configuration…
JVisualise Monitoring Tool
Running System Objects
Running system component events listened to & basic reconfiguration of running comps by JVisualise component object monitoring tool
Figure 2. Overview of using SoftArch for static and dynamic software architecture visualisation.
3.
SoftArch
SoftArch, as shown in Figure 2, provides support for static and dynamic visualisation of software architectures. Dynamic visualisations annotate and animate static visual forms. SoftArch provides a meta-model of available software architecture component types that can be modelled, which can be extended using a visual language. Software architecture modelling views use meta model types and a flexible set of visual elements to describe software architectures. Developers capture multiple, visual architectural perspectives at various levels of abstraction, by visually refining high-level architectural components to lower-level ones in several ways. A component-based CASE tool is used to support architecture implementation. When running a system, object events are sent to SoftArch. OOD-level architecture components are located, and information about running system is cached against them and their abstractions (i.e. higher-level components). Static SoftArch visualisation views are copied and annotated and/or animated to convey this running system information to developers e.g. to highlight created/not created processes, indicate number/size/timing of messages between components etc.
appearance of visual elements to their needs. Various display characteristics can also be changed, such as size, colour, shading etc. An extensible meta model holds all available architecture types, and can be programmed using a simple visual language, illustrated in Figure 4 (1). In this language, ovals represent architecture component types, horizontal bars inter-component association types, and labelled vertical arrows association and component annotation types. Dashed, arrowed lines between types indicate refinement e.g. a process can be refined into a client or server process. Solid arrowed lines indicate association relationships e.g. a data manager may have data usage relationships with any architecture element. Figure 4 (2) and (3) show use of the visual language we designed for modelling static software architecture structures and behaviour. This is derived from one we have used for many years when teaching architecture design in a software engineering course [7].
4. Static Software Architecture Views The main abstractions SoftArch uses to describe software architectures are architecture components (e.g. "servers"), associations (e.g. "LAN") and annotations (e.g. "cached data" or "SQL commands"). Each kind of architecture element has a set of typed properties further characterising it. Figure 3 shows the basic notational elements in this architecture modelling visual language. We chose this visual language for architecture modelling to enable developers to capture a wide range of features, to be relatively simple yet expressive, to be relatively easy to extend as needed, and to be able to tailor the
Figure 3. Basic SoftArch Visual Language.
(2) (4)
(1) (3)
Figure 4. Example SoftArch meta-model, template and static architecture visualisation view.
Figure 4 (2) describes the main parts of the video library system using the SoftArch visual language. Ovals are components, vertical bars and arrowed lines associations, and the labelled square (replicated data) and vertical arrowed line (protocol) annotations. This view specifies that the system is made up of three main components: a set of shared servers, staff clients connected to the servers across a LAN and customer applets (embedded in browsers) connecting to the servers across the internet. The two annotations add further information about architecture components and associations in a visual fashion. In this example, these indicate that staff profiles are cached on the staff machines, and that the customer applets use a custom protocol to communicate with the servers. Each component, association and annotation has additional properties associated with it that specify e.g. network speed, CPU speed and memory, data size and transaction processing rate, quality of service characteristics of processes, machines and networks and so on. Reusable template views, such as that shown in Figure 4 (3), provide a means for developers to reuse best practice or common architectural structures. Templates use the same visual language as model views. This example is a model of a simple server-side “e-commerce” system organisation, made up of http, application and RDBMS servers and associated data.
Each component has a property sheet, like the one for the customer applets to WAN association shown in Figure 4 (4). Various information about the component can be viewed and/or specified, such as its type and various property values, appearance, associations and annotations, and refinements to/from other components. Developers can specify multiple architecture views for a system being modelled in SoftArch. Often developers need to specify refinements of high-level architectural concepts into lower-level detailed information. This allows a system to be visualised from multiple perspectives, some showing basic architectural elements, others detailed views of parts of a system. Figure 5 (1) shows a view giving more detail about the servers in the video library system. This view was constructed by reusing the e-commerce template shown in Figure 4 (3). The use of the enclosing “servers” component indicates that the elements enclosed are refinements of the more abstract architectural component “servers”. Another way of describing refinement is shown in Figure 5 (2), where the “staff applications” component has been refined into several processes by creating a subview. All elements in this subview are refinements of the “staff applications” abstraction. Figure 5 (3) shows the use of explicit refinement links (dashed lines), in this example indicating OOD-level components (represented as UML class icons), used to implement the customer applet and application server architectural concepts.
(3)
(4)
(1)
(2)
Figure 5. Visual software architecture refinement and a JComposer OOD view.
Once an architecture model is complete, the developer exports OOD-level components to our JComposer component-based CASE tool [8]. They complete implementation within JComposer, generating Java classes to implement the system. Figure 5 (4) shows a JComposer UML-style class diagram which has been generated by SoftArch from the OOD-level components specified in Figure 5 (3). Other implementation technologies and paradigms are also supported by SoftArch, as it makes no assumptions about the eventual target languages. We have modelled C/C++ implemented web servers and desktop applications, Perl scripts, Java, Visual Basic and Delphi clients and servers, and various data formats (relational databases and files) and network protocols (sockets, http, ftp, RMI and CORBA). Defining and refining architecture views in SoftArch is a straightforward process. Views are kept consistent when they share common information, and refinement links and subviews help developers manage the complexity of their architecture descriptions. Changes to OOA or OOD specifications and designs in JComposer can be imported back into SoftArch and architecture views modified to reflect changes. Similarly, architecture
changes can be reflected in JComposer OOD designs updated by SoftArch. The above architecture views took less than one hour to specify in SoftArch.
5. Dynamic Architecture Visualisation When a system is run, JComposer components are created and communicate locally and remotely as required. We have developed a dynamic visualisation tool for JComposer-based applications, JVisualise, that can inspect running component information and monitor intercomponent communication [8]. JVisualise sends events relating to OOD-level components to SoftArch, and SoftArch uses the refinement links associated with these OOD-level components to determine which higher level components the events relate to. It records object creation/deletion, method calling, event generation and so on against OOD-level components and their abstractions. Static architecture views are copied, annotated and animated to reflect information about the running system. Developers choose data to visualise, and visualisation techniques, to suit their needs.
(2)
(4)
(1)
(3)
Figure 6. Dynamic visualisation of running system in SoftArch.
For example, after starting up the video library servers and one video library staff application, Figure 6 (1) shows a dynamic visualisation using the top-level architectural view in SoftArch. This visualisation represents the number of components created so far. The servers component is dark (five server-side objects created), staff applications lightly shaded (one staff application running) and customer applets very lightly coloured (no objects of types that are refined from this high-level component have been created). This kind of visualisation is useful for developers to determine what processes in an architecture have so far been created, and to determine relative densities of objects etc. Views can be animated to show density increasing as a system runs. Figure 6 (2) shows the server-side view of the video library system, annotated to illustrate relative method calling densities. The customer applets and staff applications make numerous calls to the application server and database server respectively. The http server is comparatively lightly used (only accessed to download customer applets for this system). Additional visualisation of data is supported, including details about object creation and method invocation, as shown in Figure 6 (3), which shows data for the application server objects at a snap shot in time. A bar graph of number of method calls to the VideoQueryServer component, an object making up the
application server process, has been generated by exporting data to MS Excel™, shown in Figure 6 (4). Developers can request that inter-component communication information be cached for selected architectural elements, and can review these. Figure 7 (1) shows an example of such information presented in a dialogue. Each method invocation of the application server has been recorded, and the developer can examine this trace. Developers can also view detailed component information using our JVisualise tool. Figure 7 (2) shows such a view for the video rental application. JVisualise supports creation, deletion and connection of running component objects, as well as property modification and method invocation by developers. This is useful for lowlevel testing and manipulation of an application. We have provided some basic running component manipulation in dynamic SoftArch architecture visualisations. One example is illustrated in Figure 7 (3), where the developer has, while a system is running, created a new architectural component (a data export agent), and connected this to another prior running component (in this example, the customer maintenance application). SoftArch uses the refinement links specified by the developer to determine the JViews components to create, inter-object references to establish and methods to call based on this information. At present only simple manipulations are supported.
(3) (2)
(1)
Figure 7. Example of dynamic software architecture manipulation, event tracing and JVisualise view.
6. Design and Implementation We implemented SoftArch using the JComposer metaCASE tool, which generates classes specialised from the JViews framework for building multi-user, multiple view visual environments [10]. We defined meta-model and architecture model repository and view components in JComposer, to support an extensible set of architectural modelling abstractions. We defined both meta-model and modelling visual icons and editors using the BuildByWire tool [8], but designed these icons so they have a wide range of user-tailorable appearance characteristics. This allows users of SoftArch to readily adapt the visual notation to their own modelling needs and preferences, without having to use BuildByWire directly. We integrated SoftArch, the Serendipity-II process management system and the JComposer CASE tool to form an integrated environment. Serendipity-II provides software architecture design process guideance and userextensible analysis agents to assist in validating architecture designs. SoftArch provides meta-model and architecture model views and repositories, template support and pre-defined analysis agents. JComposer is used by SoftArch to support architecture design refinement and implementation. This integration was achieved using the capabilities of JViews software components to exchange events and data. Figure 8 illustrates this basic integration. When a developed application is run, the JVisualise dynamic monitoring tool is automatically started. A plugin component directs component creation, destruction and modification events, and inter-component event
exchanges, to a JViews component that implements the dynamic visualisation capabilities. This copies SoftArch static views and animates/annotates them as appropriate, by changing the appearance characteristics of the SoftArch view icons.
Figure 8. Architecture of SoftArch.
7. Summary We have described and illustrated a new approach to supporting software architecture design, refinement and dynamic visualisation and manipulation. The SoftArch environment supports an extensible visual language for modelling both high and low-level characteristics of software architectures, with support for multiple, overlapping views and refinements of high-level abstractions to lower-level detail. The behaviour of implemented systems can be visualised using copies of static visualisation views at varying levels of abstraction, to show detailed or high-level running system information. Limited manipulation of running systems is also supported. This approach has proved a very encouraging direction in supporting complex system software architecture modelling and visualisation. We are working on further extending the SoftArch meta-model and visual modelling capabilities to support richer architectural abstractions and modelling capabilities. We are also working on other dynamic visualisations, including map metaphors with varying sized icons, varying static view icon and connector size based on object, method, event, data size and timing information captured from running systems. We plan to explore 3D-based static modelling and corresponding 3D dynamic visualisations of architectures.
References 1. 2.
3.
4.
5.
6.
7.
8.
9.
Bass, L., Clements, P. and Kazman, R. Software Architecture in Practice, Addison-Wesley, 1998. Beaumont, M. and Jackson, D. Visualising Complex Control Flow. In 1998 IEEE Symposium on Visual Languages, Halifax, Canada, September 1998, IEEE. Egyed, A. and Kruchten, P., Rose/Architect: a tool to visualize architecture, In Proceedings of the 32nd Hawaii International Conference on System Sciences, January 1999, IEEE CS Press. Finnigan, P, Holt, R., Kalas, I., Kerr, S., Kontogiannis, K., Mueller, H., Mylopoulos, J., Perelgut, S., Stanley, M., and Wong, K. The Software Bookshelf, IBM Systems Journal, Vol. 36, No. 4, pp. 564-593, November 1997. Graham, T.C.N., Morton, C.A. and Urnes, T. ClockWorks: Visual Programming of Component-Based Software Architectures. Journal of Visual Languages and Computing, Academic Press, pp. 175-196, July 1996. Grundy, J.C., Hosking, J.G. ViTABaL: A Visual Language Supporting Design by Tool Abstraction, In Proceedings of the 1995 IEEE Symposium on Visual Languages, Darmsdart, Germany, September 1995, IEEE, pp. 53-60. Grundy, J.C. Design principles for project-based courses, In Proceedings of the 2nd Australasian Conference on Computer Science Education, Melbourne, Australia, July 24 1997, ACM Press. Grundy, John, Rick Mugridge and John Hosking, Visual Specification of Multi-View Visual Environments. In 1998 IEEE Symposium on Visual Languages, Halifax, Nova Scotia, Canada, September 1998, IEEE CS Press. Grundy, J.C. and Hosking, J.G. Directions in modelling large-scale software architectures, In Proceedings of the 2nd
10.
11.
12.
13.
14.
15.
16.
17. 18.
19.
20. 21.
22.
23.
24.
25.
Australasian Workshop on Software Architectures, Melbourne 23rd Nov 1999, Monash University, pp. 25-40. Grundy, J.C., Mugridge, W.B. and Hosking, J.G. Constructing component-based software engineering environments: issues and experiences, Information and Software Technology, Vol. 42, No. 2, January 2000, Elsevier, pp. 117-128. Hill, T., Noble, J. Visualizing Implicit Structure in Java Object Graphs, In Proceedings of SoftVis’99, Sydney, Australia, Dec 5-6 1999. Hosking, J.G. Visualisation of object-oriented program execution, In Proceedings of 1996 IEEE Symposium on Visual Languages, IEEE CS Press. Kazman, R. Tool support for architecture analysis and design, In Proceedings of the Second International Workshop on Software Architectures, ACM Press, 94-97. Koike, H., Takada, T., and Masui, T. VisuaLinda: A Framework for Visualizing Parallel Linda Programs, In Proceedings of the 1997 IEEE Symposium on Visual Languages, IEEE CS Press. Leo, J. OO Enterprise Architecture approach using UML, In Proceedings of the 2nd Australasian Workshop on Software Architectures, Melbourne 23rd Nov 1999, Monash University Press, pp. 25-40. Liu, A. Dynamic Distributed Software Architecture Design with PARSE-DAT, In Proceedings of the 1998 Australasian Workshop on Software Architectures, Melbourne, Australia, Nov 24, Monash University Press. Quatrani, T. Visual Modeling With Rational Rose and UML, Addison-Wesley, 1998. Reiss, S.P. A framework for abstract 3-D visualization, In Proceedings of the 1993 IEEE Symposium on Visual Languages, IEEE CS Press. Robbins, J. Hilbert, D.M. and Redmiles, D.F. Extending design environments to software architecture design, Automated Software Engineering, vol. 5, No. 3, July 1998, 261-390. Shaw, M. and Garlan, D. Software Architecture, Prentice Hall, 1996. Shizuki, B., Toyoda, M. Shibayama, E. and Takahashi, S. Visual Patterns + Multi-Focus Fisheye View: An Automatic Scalable Visualization Technique of Data-Flow Visual Program Execution. In 1998 IEEE Symposium on Visual Languages, Halifax, Canada, September 1998, IEEE. Stankovic, N. and Zhang, K. Towards Visual Development of Message-Passing Programs, In Proceedings of 1997 IEEE Symposium on Visual Languages, IEEE CS Press. Topol, B., Stasko, J. and Sunderam, V., PVaniM: A Tool for Visualization in Network Computing Environments, Concurrency: Practice & Experience, Vol. 10, No. 14, 1998, pp. 1197-1222. Urnes, T. and Graham, T.C.N. Flexibly Mapping Synchronous Groupware Architectures to Distributed Implementations. In Proceedings of Design, Specification and Verification of Interactive Systems, 1999. Wagner, B., Sluijmers, I., Eichelberg, D., and Ackerman, P., “Black-box Reuse within Frameworks Based on Visual Programming,” in Proc. 1st Component Users Conference, SIGS Books, 1997.