VPH-06249; No of Pages 9 Vascular Pharmacology xxx (2015) xxx–xxx
Contents lists available at ScienceDirect
Vascular Pharmacology journal homepage: www.elsevier.com/locate/vph
High plasma chemerin is associated with renal dysfunction and predictive for cardiovascular events — Insights from phenotype and genotype characterization Andreas Leiherer a,c,d,1, Axel Muendlein a,c,1, Elena Kinz a,c, Alexander Vonbank a,b, Philipp Rein a,b, Peter Fraunberger c,d, Cornelia Malin a,b, Christoph H. Saely a,b,c, Heinz Drexel a,b,c,e,⁎ a
Vorarlberg Institute for Vascular Investigation and Treatment (VIVIT), Feldkirch, Austria Department of Medicine and Cardiology, Academic Teaching Hospital Feldkirch, Feldkirch, Austria c Private University of the Principality of Liechtenstein, Triesen, Liechtenstein d Medical Central Laboratories, Feldkirch, Austria e Drexel University College of Medicine, Philadelphia, PA, USA b
a r t i c l e
i n f o
Article history: Received 7 May 2015 Received in revised form 17 July 2015 Accepted 10 August 2015 Available online xxxx Keywords: Chemerin Adipokine Coronary artery disease Renal dysfunction Cardio-Metabo Chip
a b s t r a c t The novel adipokine chemerin, encoded by the RARRES2 gene, has been suggested to be linked to insulin resistance and to the metabolic syndrome (MetS). However, no well-defined cardiovascular profile has been reported and the association with coronary artery disease (CAD) is a matter of debate. Because there is a relation between renal dysfunction and CAD, we analyzed plasma chemerin levels and the estimated glomerular filtration rate (eGFR) in 495 patients undergoing coronary angiography for the evaluation of established or suspected stable CAD. Chemerin levels were higher in patients with Type 2 diabetes mellitus (T2DM, n = 111) and the metabolic syndrome (MetS, n = 147) than in subjects without T2DM (191.5 ± 72.9 vs. 169.7 ± 64.7 ng/ml, p = 0.001) or the MetS (201.2 ± 71.0 vs. 163,1 ng/ml, p b 0.001), but did not differ significantly between patients with significant CAD (n = 247) and those without significant CAD (177.1 ± 67.0 vs. 171.7 ± 67.2 ng/ml, p = 0.193). Analysis of covariance using age, sex, and BMI as covariates showed that chemerin was significantly and independently associated with eGFR (F = 49.6, p b 0.001). After an 8-year follow-up period, patients with high chemerin levels were more often affected by cardiovascular events (HR = 1.72 [95% CI 1.19–2.47], p = 0.004), even after appropriate adjustment for age, gender, BMI, as well as eGFR (adjusted HR 1.51 [95% CI 1.03–2.23], p = 0.037). Given the cardiometabolic role of chemerin, we also applied a Cardio-Metabo Chip analysis and revealed a genome-wide significant association with SNPs (rs55709438, rs2444030, and rs3098423) located at chromosomal region 15q15–23, which were associated with metabolic traits and eGFR. This study for the first time demonstrates that high chemerin concentrations are significantly associated with renal impairment and predictive of cardiovascular events and that 15q15–23 might have an impact on chemerin levels beyond common genetic variations in RARRES2. © 2015 The Authors. Published by Elsevier Inc. This is an open access article under the CC BY license (http://creativecommons.org/licenses/by/4.0/).
1. Introduction Chemerin is an adipokine that mediates (i) MAPK activation by G-protein coupled receptor (GPCR-signaling) [1,2], (ii) insulin resistance [3], and (iii) angiogenesis [4]. It is a protein with a large scope. It features anti-microbial [5] as well as chemotactic and inflammatory properties, plays a regulatory role for immune response [6,2,7], and
⁎ Corresponding author at: Vorarlberg Institute for Vascular Investigation and Treatment (VIVIT) and Department of Medicine and Cardiology, Academic Teaching Hospital Feldkirch, Carinagasse 47, A-6807, Feldkirch, Austria. E-mail address:
[email protected] (H. Drexel). 1 AL and AM contributed equally to this work.
has been suggested to induce contraction of the vasculature [8]. Chemerin is predominantly expressed in adipocytes [9] and important for adipocyte differentiation and metabolism [10]. Chemerin gene expression is elevated in psoriasis development [11] and further inflammatory diseases including ulcerative colitis and Crohn disease [12]. It is upregulated in Type 2 diabetes mellitus (T2DM) and obesity [1,13,14] and meta-analysis data link elevated plasma levels of chemerin to the metabolic syndrome (MetS) [15]. In addition, retinoic acid receptor responder-2 (RARRES2), encoding chemerin, is a genetic determinant of disproportionate regional body fat distribution [16]. In studies with Asian patients who underwent elective coronary angiography for suspected coronary artery disease (CAD), elevated levels
http://dx.doi.org/10.1016/j.vph.2015.08.010 1537-1891/© 2015 The Authors. Published by Elsevier Inc. This is an open access article under the CC BY license (http://creativecommons.org/licenses/by/4.0/).
Please cite this article as: A. Leiherer, et al., High plasma chemerin is associated with renal dysfunction and predictive for cardiovascular events — Insights from phenotype and genotype characterization, Vascul. Pharmacol. (2015), http://dx.doi.org/10.1016/j.vph.2015.08.010
2
A. Leiherer et al. / Vascular Pharmacology xxx (2015) xxx–xxx
of chemerin were shown to be significantly associated with the presence [17,18] or severity [19] of CAD. In contrast, no association between chemerin and coronary atherosclerotic plaque burden or morphology was found in a study with Caucasian patients [20]. Apart from that, chemerin, in contrast to other adipokines, has a relatively poor cardiovascular profile [21]. Of interest, it has been reported previously that kidney function is inversely related to circulating chemerin in dialysis patients [22,23] and that kidney transplantation decreased chemerin levels in patients with end stage renal disease [24]. In previous studies, we found a significant relation between renal function and coronary atherosclerosis as well as vascular events [25,26]. However, data addressing the links of chemerin with both, renal function and future cardiovascular risk in coronary patients, are still lacking. For these reasons, we aimed at investigating the role of chemerin as a predictor for cardiovascular risk and renal malfunction in a high risk cohort of patients undergoing coronary angiography for the evaluation of suspected or established stable CAD. Furthermore, we investigated the association of cardiometabolic polymorphisms using the CardioMetabo Chip with circulating chemerin concentrations and aimed to replicate previously reported RARRES2 polymorphisms in that population.
a high prevalence of T2DM (22.5%) hypertension (77.2%) and smoking (53.5%). Plasma chemerin on average was 174.4 ± 67.1 ng/ml (mean ± SD). It was elevated in women compared with men (183.7 ± 67.3 ng/ml vs. 165.1 ± 65.7 ng/ml, p b 0.001) and patients with hypertension had also significantly higher circulating chemerin concentrations than those without hypertension (180.2 ± 70.9 vs. 154.8 ± 47.4 ng/ml, p = 0.001). With respect to T2DM and MetS, we saw a significant discrepancy between affected and unaffected subjects (191.5 ± 72.9 vs. 169.7 ± 64.7, p = 0.001, and 201.2 ± 71.0 vs. 163.1 ± 62.1 ng/ml p b 0.001 respectively). In this context, patients treated and untreated with ASA (172.0 ± 61.1 vs. 179.0 ± 77.5 ng/ml, p = 0.710), beta blocker (177.3 ± 68.8 vs. 171.2 ± 65.2 ng/ml, p = 0.464), or statins (177.2 ± 69.3 vs. 172.2 ± 65.4 ng/ml, p = 0.786) did not differ in terms of their chemerin concentration, whereas increased chemerin levels were observed in patients taking ACE blocker (185.2 ± 71.5 vs. 169.9 ± 64.8 ng/ml, p = 0.005) or AT-2 antagonists (202.0 ± 85.2 vs. 171.6 ± 64.5 ng/ml, p = 0.034). We did not find a significantly raised chemerin concentration in patients with CAD compared with those without CAD (177.1 ± 67.0 vs. 171.7 ± 67.2 ng/ml, p = 0.193). Comparing patient characteristics with respect to tertiles of chemerin concentration (Table 1), we also revealed an association between chemerin on the one hand and metabolic as well as kidney traits on the other hand.
2. Results 2.1. Patient characteristics
2.2. Association with obesity and renal function
The characteristics of our patients (n = 495) were typical for patients undergoing coronary angiography for the evaluation of stable CAD, with
Our study demonstrated that obese patients had significantly higher chemerin concentrations than non-obese subjects (195.6 ± 78.5 vs.
Table 1 Patient characteristics according to tertiles of plasma chemerin. Tertiles 1 through 3 of plasma chemerin range from 12 ng/ml to 145 ng/ml, from 145 ng/ml to 191 ng/ml, and from 191 ng/ml to 497 ng/ml, respectively. Data are means ± standard deviations as indicated. BMI denotes body mass index, CAD coronary artery disease, which is defined by an angiographically determined coronary artery stenosis with lumen narrowing ≥50%. T2DM denotes Type 2 diabetes mellitus, MetS the metabolic syndrome, eGFR the estimated glomerular filtration rate, CKD denotes chronic kidney disease and is defined by an eGFR smaller than 90 ml/min/1.73 m2. CRP denotes C-reactive protein, NT-proBNP N-terminal pro brain natriuretic peptide, LDL low density lipoprotein, HDL high density lipoprotein, HbA1c hemoglobin A1c, HOMA-IR homeostasis model assessment of insulin resistance, ASA acetylsalicylic acid, ACE angiotensin converting enzyme, and AT-2 angiotensin 2. p-Values are given for trend.
Age (years) Male sex (%) Waist circumference (cm) BMI (kg/m2) Hypertension (%) Smoking (%) sig. CAD (%) Extent of N50% stenoses T2DM (%) MetS (%) eGFR (ml/min/1.73 m2) ACR CKD (%) CRP (mg/dl) Fibrinogen (mg/dl) NT-proBNP (pg/ml) LDL cholesterol (mg/dl) HDL cholesterol (mg/dl) Total cholesterol (mg/dl) Triglycerides (mg/dl) Apolipoprotein A-1 (mg/dl) Apolipoprotein B (mg/dl) Fasting glucose (mg/dl) HbA1c (%) HOMA-IR Systolic blood pressure (mm Hg) Diastolioc blood pressure (mm Hg) ASA treatment (%) Beta blocker treatment (%) ACE inhibitor treatment (%) AT-2 antagonist treatment (%) Statin treatment (%) Plasma chemerin (ng/ml)
Total
1st tertile
2nd tertile
3rd tertile
p-Value
65 ± 11 50.1 98.5 ± 12.0 27.6 ± 4.6 77.2 53.5 49.9 1.2 ± 1.6 22.5 29.7 95.0 ± 17.6 68.9 ± 235.1 37.6 0.39 ± 0.61 328 ± 72 659 ± 1603 129 ± 42 59 ± 18 200 ± 47 137 ± 90 158 ± 30 84 ± 23 104 ± 30 6.0 ± 0.9 4.2 ± 19.6 135 ± 17 81 ± 10 66.3 51.9 29.3 9.1 43.8 174.4 ± 67.1
63 ± 12 61.8 95.2 ± 11.2 26.5 ± 4.0 70.3 56.4 46.1 1.0 ± 1.6 14.1 12.7 100.9 ± 15.3 36.7 ± 86.7 25.5 0.25 ± 0.31 302 ± 59 699 ± 1978 125 ± 42 62 ± 17 195 ± 46 112 ± 70 159 ± 29 78 ± 23 99 ± 25 5.8 ± 0.8 2.5 ± 2.9 132 ± 16 80 ± 10 66.1 53.3 23.6 6.1 45.5 112.0 ± 27.6
65 ± 11 45.5 99.5 ± 11.4 27.8 ± 4.1 75.8 55.2 49.7 1.2 ± 1.6 23.0 32.7 96.1 ± 15.1 65.9 ± 269.0 37.6 0.36 ± 0.48 327 ± 71 380 ± 871 135 ± 43 59 ± 19 205 ± 47 139 ± 78 161 ± 32 86 ± 23 102 ± 27 6.0 ± 0.8 5.9 ± 32.5 135 ± 18 82 ± 10 67.9 47.9 23.6 10.3 40.0 166.0 ± 13.4
68 ± 10 43.0 100.9 ± 12.8 28.5 ± 5.2 85.5 49.1 53.9 1.3 ± 1.6 30.3 43.6 87.8 ± 19.5 104.2 ± 289.4 49.7 0.56 ± 0.86 355 ± 75 916 ± 1693 129 ± 40 56 ± 18 200 ± 48 160 ± 109 153 ± 28 87 ± 22 110 ± 37 6.2 ± 1.0 4.2 ± 7.0 138 ± 18 82 ± 10 64.8 54.5 40.6 10.9 46.1 245.2 ± 59.8
0.001 0.001 b0.001 b0.001 0.001 0.186 0.153 0.091 b0.001 b0.001 b0.001 0.003 b0.001 b0.001 b0.001 0.382 0.446 0.001 0.483 b0.001 0.032 b0.001 b0.001 b0.001 b0.001 0.002 0.268 0.816 0.826 0.001 0.126 0.912 b0.001
Please cite this article as: A. Leiherer, et al., High plasma chemerin is associated with renal dysfunction and predictive for cardiovascular events — Insights from phenotype and genotype characterization, Vascul. Pharmacol. (2015), http://dx.doi.org/10.1016/j.vph.2015.08.010
A. Leiherer et al. / Vascular Pharmacology xxx (2015) xxx–xxx Table 2 Correlation analysis. Correlation is given as the non-parametric Spearman rank correlation with the corresponding p-values. BMI denotes body mass index, CRP C-reactive protein, LDL low density lipoprotein, HDL high density lipoprotein, HbA1c hemoglobin A1c, HOMA-IR homeostasis model assessment of insulin resistance, eGFR estimated glomerular filtration rate, and ACR albumin/creatinine ratio. Correlation of chemerin with
r
p-Value
n
Age BMI Waist circumference CRP Fibrinogen NT-proBNP Total cholesterol LDL cholesterol HDL cholesterol Triglycerides Apolipoprotein A-2 Apolipoprotein B Fasting glucose HbA1C, HOMA-IR Systolic blood pressure Diastolic blood pressure Extent of N50% stenoses ACR eGFR
0.171 0.185 0.194 0.240 0.310 0.087 0.065 0.067 −0.154 0.298 −0.087 0.205 0.146 0.283 0.239 0.157 0.063 0.074 0.115 −0.331
b0.001 b0.001 b0.001 b0.001 b0.001 0.089 0.152 0.140 0.001 b0.001 0.054 b0.001 0.001 b0.001 b0.001 b0.001 0.166 0.098 0.015 b0.001
495 495 467 495 492 386 493 492 492 493 491 491 495 494 464 488 488 495 444 495
167.1 ± 61.1 ng/ml, p b 0.001). The link between chemerin concentration and body composition (Table 1) was further supported by significant associations with waist circumference, BMI, and triglycerides, as summarized in Table 2. We also found a clear correlation with diabetes-, and inflammation-related markers and those connected with the MetS, but we did not see a correlation between chemerin and the extent of CAD or the cardiac marker NT-proBNP. We observed that the circulating chemerin concentration was inversely correlated with the estimated glomerular filtration rate (eGFR) at baseline (r = −0.331, p b 0.001). In line with univariate results, analysis of covariance adjusting for age, gender, and BMI revealed that chemerin is significantly and independently associated with eGFR. That association was observed in patients affected by hypertension (F = 43.0, p b 0.001), CAD (F = 21.7, p b 0.001), T2DM (F7.4, p = 0.008), or the MetS (F = 5.2, p = 0.024) as well as in those who were unaffected by hypertension (F = 3.9, p = 0.05), CAD (F = 29.2, p b 0.001), T2DM (F = 42.0, p b 0.001), or the MetS (F = 50.5, p b 0.001). Further adjustment models including cardiometabolic traits, hypertension, inflammation markers, and medical treatment proved the significant association between chemerin and eGFR (Table S1). 2.2.1. Chemerin as an indicator for prevalence and progression of renal dysfunction Monitoring renal function of our study patients over a prolonged time, we assessed eGFR at baseline (95.0 ± 17.6 ml/min/1.72 m2) and reassessed it after 3.5 ± 1.1 years of follow-up (92.2 ± 18.5 ml/min/ 1.73 m2). Similar to baseline measurement, plasma chemerin and eGFR at follow-up inversely correlated significantly (r = −0.319, p b 0.001). We thus revealed that 49.7% of all subjects with high chemerin concentrations (high tertile) had chronic kidney disease (CKD) stage ≥ 2 at baseline, whereas at the follow-up, the percentage of subjects with CKD stage ≥2 significantly increased to 63.9 (p b 0.001). In contrast, for those with lower chemerin concentrations (medium and low tertiles), the percentage with CKD (stage ≥2) only increased from 31.5 to 34.1 (p = 0.004). With regard to patients who did not have any CKD at baseline, 36.5% of patients with high chemerin concentration developed CKD (stage ≥ 2) during the follow-up, whereas in the group with low chemerin concentrations only 15.4% were positively diagnosed for CKD at the follow-up visit after 3.5 years (p = 0.001). For
3
comparison, 24.8% of patients with hypertension at baseline developed CKD (stage ≥ 2) and only 11.1% without hypertension (p = 0.025), whereas the percentage of patients with and without CAD was not significantly different with respect to CKD progression (24.2 vs. 17.9%, p = 0.271). In addition, the mentioned chemerin status predicted that progression to CKD univariately (OR = 3.17 [1.55–6.46], p = 0.002) and remained significant after adjustment for age, gender, BMI, and the presence of hypertension, CAD, and T2DM (OR = 2.61 [1.13–6.04], p = 0.025). Similarly, comparing baseline to follow-up data, we noticed that in subjects with high chemerin concentrations the urine albumin/creatinine ratio (ACR) increased from 48.3 ± 139.4 to 116.5 ± 260.6 μg albumin/mg creatinine within 3.5 years, whereas those with low chemerin concentrations had comparable results at baseline (29.1 ± 78.0 μg albumin/mg creatinine) and follow-up (25.0 ± 75.7 μg albumin/mg creatinine) and that change of ACR was significantly higher in patients with high chemerin levels than in those with low chemerin (p = 0.014).
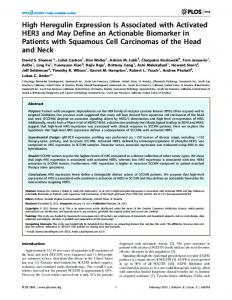
2.2.2. Chemerin as a predictor of cardiovascular events With respect to cardiovascular risk during the follow-up time of up to 8 years (6.9 ± 0.7 years, mean ± SD), 117 patients of our study population had at least one vascular event. Hence, first vascular events occurred in 23.6% of the study population. In total, we recorded 186 vascular events, encompassing 54 cardiovascular deaths, 26 non-fatal myocardial infarctions, 24 non-fatal ischemic strokes, 10 CABGs, 44 PCIs, and 28 non-coronary revascularizations at the carotid and peripheral arteries. Although there was no association between plasma chemerin and baseline angiographic CAD status, the incidence of future cardiovascular events was significantly higher (log Rank p-value = 0.003) in the high chemerin tertile group than in people with medium or low chemerin levels as shown in Fig. 1. Concordantly, the chemerin status proved significantly predictive of cardiovascular events with a standardized hazard ratio of 1.72 (95% CI 1.19–2.47, p = 0.004) for the full follow-up time of 6.9 years. After adjustment for age, gender, and BMI it still significantly predicted these events (adjusted HR 1.65 [95% CI 1.133–2.39], p = 0.009) and that predictive power remained significant after adjustment for eGFR (adjusted HR 1.51 [95% CI 1.03–2.23], p = 0.037) and for baseline CAD status (adjusted HR 1.49 [95% CI 1.01–2.19], p = 0.043; Fig. 2).
Fig. 1. Event-free survival with respect to chemerin levels. The Kaplan–Meier plot indicates the event-free survival of the total study population according to plasma chemerin high tertile cut-off (191.1 ng/ml) with a log rank p-value of 0.003. The high chemerin group is represented by a dashed line and the group with lower chemerin concentrations by a solid line. Events have been defined as vascular deaths, non-fatal myocardial infarctions, non-fatal strokes, and the necessity of intervention (coronary artery bypass graftings, percutaneous coronary interventions, and non-coronary revascularization).
Please cite this article as: A. Leiherer, et al., High plasma chemerin is associated with renal dysfunction and predictive for cardiovascular events — Insights from phenotype and genotype characterization, Vascul. Pharmacol. (2015), http://dx.doi.org/10.1016/j.vph.2015.08.010
4
A. Leiherer et al. / Vascular Pharmacology xxx (2015) xxx–xxx
e −11), rs2444030 (nominal p-value = 5.2 e −9), and rs3098423 (nominal p-value = 9.6 e −8) and plasma chemerin concentrations even if applying stringent criteria (Bonferroni corrected p-value = 6.8 e−6, 6.8 e−4, and 1.3 e−2 respectively). Of note, all identified transacting SNPs are located at chromosomal locus 15q15–23. Polymorphism rs55709438 is located within the mitogen-activated protein kinase kinase 5 (MAP2K5, 15q23) gene and was the top hit in the GWA. The second SNP rs2444030 lies within tumor protein p53 binding protein 1 (TP53BP1, 15q15–21) gene. Close to rs2444030, the third SNP rs3098423 (pairwise linkage disequilibrium D′ = 1.0; r2 = 0.492) is located within calpain 3 (CAPN3, 15q15.1) gene. Chemerin levels of cisand trans-acting SNPs are given in Table 3.
Fig. 2. Hazard ratios for event-free survival with respect to chemerin levels. Hazard ratio (HR) and adjusted HR of Cox regression analysis are given for consecutive models of adjustment. Model 1 represents a univariate analysis for chemerin; model 2 includes covariate age, gender, and BMI; model 3 includes all parameters of model 2 including eGFR; and model 4 includes all parameters of model 3 and in addition presence of significant CAD at baseline.
Similarly, the chemerin status was also predictive if only the first follow-up (3.5 years) was considered (HR 1.83 [95% CI 1.19–2.83], p = 0.006) and remained predictive after adjustment for age, gender, and BMI (adj. HR 1.84 [1.18–2.87], p = 0.007), as well as for eGFR (adj. HR 1.77 [1.12–2.80], p = 0.015) and CAD (adj. HR 1.69 [1.07– 2.67], p = 0.024).
2.2.3. Association between cis- and trans-acting SNPs and plasma chemerin Results from tagging analysis showed that under predefined selection criteria, the RARRES2 gene is completely tagged by SNP rs3735167 and SNP rs4721. Genotyping revealed that plasma chemerin concentration was significantly associated with rs3735167 (β = −0.157, p = 0.001). In contrast, no association between chemerin concentration and rs4721 was found (β = 0.009, p = 0.839). To identify trans-regulatory SNPs, we analyzed the mentioned 495 individual patient samples for the association between 130,909 cardiometabolic single nucleotide polymorphisms (SNPs) and circulating chemerin using the Cardio-Metabo Chip. Results of the Cardio-Metabo Chip analysis are presented in Fig. 3. We revealed significant genomewide associations between SNP rs55709438 (nominal p-value = 5.2
2.2.4. Association between cis- and trans-acting SNPs and eGFR in a larger population To test the relevance of these SNPs for a larger population at vascular risk, we used data from all 1049 enrolled coronary patients. Applying a linear regression model revealed a significant association between eGFR and SNP rs2444030 (F = 4.42, p = 0.036) as well as SNP rs3098423 (F = 7.03, p = 0.008, Table 3). Concordantly, including age, gender, and BMI into the model, both SNPs were still significant predictors of eGFR (F = 6.09, p = 0.014 and F = 6.29, p = 0.012, respectively). However, no significant association between eGFR and rs55709438 or RARRES2 SNP rs3735167 and SNP rs4721 was found. 2.2.5. Association between cis- and trans-acting SNPs and cardiometabolic traits Having revealed a link of plasma chemerin with obesity and the cardiometabolic traits, we applied logistic regression analysis to test the association of the respective polymorphisms with those parameters. Concordantly we did not observe any significant interaction between SNPs rs55709438, rs2444030, rs3098423, rs3735167, and rs4721 and CAD, and there was also no association with T2DM or the MetS (p N 0.05, Table S2). Nonetheless, we revealed significant associations with lipid markers triglycerides, LDL cholesterol, as well as total cholesterol (Table 3). Furthermore, we ascertained a significant association between rs55709438 and obesity (p = 0.025) and could corroborate the previously described association between rs10278590 (= rs4721) and visceral fat in nonobese subjects [16] by demonstrating an association for rs4721 (ptrend = 0.020) as well as rs3735167 (ptrend = 0.003) in our non-obese subjects. Neither rs3735167 nor rs4721 proved to predict cardiovascular events (HR = 1.014 [95% CI 0.837–1.014] p = 0.885 and HR = 1.004 [95% CI 0.843–1.196] p = 0.963) with respect to the follow-up time of 6.9 years. Similarly, none of the SNPs revealed by GWA (rs55709438, rs2444030 and rs3098423) predicted cardiovascular events (HR = 0.37 [95% CI 0.05–2.65] p = 0.323, HR = 0.90 [95% CI 0.42–1.90] p = 0.773, and HR 1.32 [95% CI 0.72–2.41] p = 0.372). In accordance, those five SNPs did also not have predictive power for the first 3.5 years of follow-up. 3. Discussion
Fig. 3. Manhattan plot of genome-wide association study of plasma chemerin. SNPs were characterized using the Illumina Cardio-Metabo Chip. After frequency and genotyping pruning, there were 130,909 SNPs left. The red line indicates genome-wide significant associations (4.02e−7).
In the present study, we found a strong association between circulating chemerin and metabolic traits as well as kidney function. In addition, plasma chemerin is predictive of renal impairment and patients with high plasma chemerin levels are at a significantly higher cardiovascular risk, independent from their renal function. We were able to demonstrate that patients with elevated chemerin levels are more prone to impaired eGFR. A lower eGFR was linked to high chemerin levels, independent from CAD, the MetS or T2DM status. These data are in accordance with previous reports for patients with diabetes or severe kidney disease, but also for control subjects [22,24,27]. The present study also suggests a connection between high chemerin concentrations and a progression of impaired kidney function. This is of particular interest and strengthened by the finding in
Please cite this article as: A. Leiherer, et al., High plasma chemerin is associated with renal dysfunction and predictive for cardiovascular events — Insights from phenotype and genotype characterization, Vascul. Pharmacol. (2015), http://dx.doi.org/10.1016/j.vph.2015.08.010
0.869 0.567 0.316 0.857 0.296
p beta
0.005 0.018 0.032 −0.060 0.034 0.027 0.329 1.006 0.032 1.093 0.109 0.039 0.537 0.122 0.042 0.053 0.066 0.020 0.050 −0.065 2.573 4.270 0.381 2.391 4.129 0.098 0.001 0.052 0.669 0.341 0.054 0.106 0.062 0.014 −0.031 2.739 11.064 3.777 0.183 0.907 0.626 0.001 0.008 0.974 0.860 0.016 0.107 0.084 −0.001 0.006 0.238 11.279 6.973 0.001 0.031 0.466 0.036 0.008 0.670 0.913 0.024 −0.067 −0.084 0.014 0.003 0.532 4.417 7.034 0.181 0.012 6.8e−6 6.8e−4 1.3e−2 2.3e−3 8.9e−1 356.8 ± 151.1 252.8 ± 128.7 245.4 ± 131.5 181.6 ± 68.8 172.6 ± 65.4 171.8 ± 66.0 170.1 ± 62.3 170.3 ± 62.1 164.8 ± 65.3 173.5 ± 69.0 A C C A G Trans Trans Trans Cis Cis rs55709438 rs2444030 rs3098423 rs3735167 rs4721
C G T G T
HDL cholesterol
F p Beta
LDL cholesterol
F p Beta
Total cholesterol
F p Beta
Triglycerides
F p Beta
eGFR
F BX
p Chemerin
AA
B A Acting Variant
Table 3 Overview of trans- and cis-acting SNPs. Trans- and cis-acting polymorphisms are summarized with A denoting the major, and B the minor allele. Chemerin concentrations in ng/ml (means with standard deviation) are shown for the wt (AA) and the dominant (BX) model. p-Values are given for the association between chemerin and the dominant variant model according to linear regression. Estimated GFR is given in ml/min/1.72 m2, triglycerides, LDL cholesterol and total cholesterol in mg/dl.
A. Leiherer et al. / Vascular Pharmacology xxx (2015) xxx–xxx
5
patients with end stage renal disease by Rutkowski et al. that after kidney transplantation the eGFR increased and reached a value higher than 50 ml/min and the serum chemerin concentrations decreased to the values observed in healthy subjects [24]. With regard to the progression of renal dysfunction in our study, it was observed more frequently in patients with high chemerin concentration, but also to a smaller but significant degree in subjects with lower chemerin levels. Hypertension is the most important factor in progression of renal dysfunction and may be influencing the outcome as patients with hypertension had higher chemerin levels than normotensive subjects. Nevertheless, adjusting for hypertension did not abrogate the association between chemerin and renal function. Within the context of CKD, it has been reviewed that peptide hormone levels rise significantly but the consequences of their accumulation remain unclear [28]. Thus, future mechanistic studies should evaluate the possible predictive and therapeutic values of these findings. Apart from that, it has been demonstrated quite recently that a high chemerin concentration is also a predictor for T2DM [29]. From a clinical point of view, the treatment of excessive chemerin levels to prevent the onset of diabetes or renal diseases might be a future task to be addressed as it has been demonstrated that rosiglitazone administration ameliorates diabetic nephropathy in rats by decreasing the expression of chemerin [30]. RARRES2 is a target gene of peroxisome proliferatoractivated receptor γ (PPARγ) [31], which is activated by glitazones, but the respective effect on adipocytes switches with respect to the cellular differentiation state and thus may be ambiguous in vivo [31]. Given the complex role of PPARγ in renal dysfunction and obesity [32] and the suggested vasoactive role of chemerin in the perivascular adipose tissue [8], further investigation is mandatory. Furthermore, we demonstrated a positive correlation of chemerin concentration with BMI, waist circumference, triglycerides, ApoB, and blood pressure and a negative correlation between chemerin and HDL and ApoA1, respectively. These results support previous data obtained for morbidly obese subjects [1,14] and a primal report by Bozaoglu [9]. Chemerin has been found an independent marker of the metabolic syndrome in the Caucasian population [33]. Accordingly, in our study population, chemerin levels were also significantly higher in subjects suffering from the MetS. This was also true for T2DM patients and we observed a correlation with HOMA-IR, HbA1C, and fasting glucose. Noteworthy, we also determined a clear direct correlation between chemerin and CRP as well as fibrinogen, supporting chemerin's supposed role as a mediator between obesity and inflammation [13,14]. Apart from that, there was a gender-specific bias and also a significant link between ACE or AT-2 medication and AT-2 medication and obtained chemerin concentration. As the gender bias may be due to a higher body fat percentage in women, the latter probably results from the higher age of ACE blocker or AT-2 antagonist users compared with beta blocker users (69.5 vs. 64.4, p = 0.004). In addition, AT-2 antagonists and ACE blockers are both metabolically neutral, in contrast to beta blocker. Thus, their prescription is preferred in diabetic and renal impaired subjects, whereas only a low percentage of CKD patients receive beta blockers due to the fear of adversely affecting renal function and glycemic control [34] and that also applies to our study subjects. According to our data, elevated chemerin concentration is not associated with baseline CAD status. This is contradicting a small previous study of 188 Chinese patients [18] but on the other hand corroborates data from a Caucasian study group with 330 subjects [20] as well as a Korean T2DM study group with 70 subjects [35]. We did not include patients with acute coronary syndrome in our study, who were reported to have increased chemerin concentrations [36,37] and may explain different results if also included. The present study is the first to reveal that a high plasma chemerin concentration is not only a predictor for renal insufficiency but also confers to a significantly increased risk of future cardiovascular events in coronary patients. In this context, it has to be mentioned that in patients with very severe kidney failure, CKD stage 5, higher chemerin levels
Please cite this article as: A. Leiherer, et al., High plasma chemerin is associated with renal dysfunction and predictive for cardiovascular events — Insights from phenotype and genotype characterization, Vascul. Pharmacol. (2015), http://dx.doi.org/10.1016/j.vph.2015.08.010
6
A. Leiherer et al. / Vascular Pharmacology xxx (2015) xxx–xxx
have been reported to improve overall survival [23]. Nevertheless, our data clearly enlarge the current knowledge about chemerin going beyond the previously assumed protective role of chemerin [21]. Despite our new findings, the role of chemerin in metabolism and cardiovascular pathogenesis is far away from being understood, and the molecular network involved in the regulation of chemerin levels is obscure as well. Therefore, we also performed a GWA with the metabolic and atherosclerotic-cardiovascular focused Cardio-Metabo Chip and used tagging SNPs for the RARRES2 gene locus thereby reassessing previously demonstrated associations between RARRES and chemerin [16,38]. Starting with the latter, our genotyping data revealed that plasma chemerin concentration was significantly associated with the tagging SNP rs3735167 (β = − 0.157, p = 0.001) and thus we could replicate results from a large meta analysis for the cis-acting polymorphisms rs3735167 and also for rs7806429, closely linked to rs3735167 [38]. In contrast, no association between chemerin concentration and rs4721 was found (β = 0.009, p = 0.839). Using magnetic resonance imaging, Müssig et al. suggested for rs10278590 (merged to rs4721) a nominal association with visceral fat in non-obese subjects (p = 0.04) [16]. Albeit we did not apply that method, we also revealed a significant association with waist circumference in non-obese patients for rs4721 (ptrend = 0.020) and also for rs3735167 (ptrend = 0.003). To further elucidate the metabolic and cardiovascular role of chemerin, we used the Cardio-Metabo Chip and were able to reveal three associations with genome-wide significance. The best hit was a polymorphism in MAP2K5 (rs55709438, nominal p-value = 7.8e − 14), which has been reported to be associated with obesity [39,40]. In accordance, the significant link between rs55709438 and obesity in our population could corroborate those previous findings. Moreover, MAP2K5 has been demonstrated recently to influence adipogenesis by impacting PPARγ phosphorylation [41] and, consequently, will also affect chemerin expression [31], providing a convincing link between the MAP2K5 polymorphism and chemerin concentration. In addition, we also assessed an association with a SNP (rs3098423) in CAPN3, a calcium-dependent endoprotease [42], whose expression is associated with insulin resistance and increased body fat [43]. That SNP turned out to be significantly linked with eGFR in our patients. Finally, the third association refers to TP53BP1 (rs2444030), a transcriptional activator of p53, well known for its role in cellular energy metabolism [44,45], adipogenic differentiation, and diet-induced obesity [46]. In accordance, our data demonstrated a significant association of rs2444030 with lipid markers triglycerides, LDL cholesterol, and total cholesterol but also with eGFR. Of interest, the identified trans-acting SNPs rs2444030 in TP53BP1, the linked rs3098423 in CAPN3, as well as rs55709438 in MAP2K5 together with the previously identified SNP rs8027521 near UNC13C [38], all of them highly linked with circulating chemerin concentrations, span a larger region on chromosome 15 (15q15–23) and thus that region should be further investigated for an impact on chemerin levels. Finally, it has been reported previously that polymorphisms in the gene encoding epithelial growth factor-like repeats and discoidin Ilike domains 3 (EDIL3) on chromosome 5, which is involved in angiogenesis are significantly associated with plasma chemerin levels [4]. As chemerin promotes the formation of new blood vessels, it may be an essential component of adipose tissue expansion in obesity [4]. Consistently, we could confirm that link in our study, revealing a significant association (p = 0.007) between rs4444950, 98 kb downstream the EDIL3 coding region, and plasma chemerin. Given the lacking predictive value for the cardiovascular risk of cisand trans-acting SNPs, the question arises whether chemerin, nonetheless, should be regarded as biomarker for the cardiovascular risk or if a more conservative interpretation should be applied classifying it as a surrogate marker. On the other hand, these variants were partly linked with lipid markers, obesity, and renal function. Furthermore, high chemerin concentrations in our patients were also linked with a worsening of these parameters and predicted cardiovascular events
independent from renal filtration capacity. Thus, future studies on the association between those relevant polymorphisms and the cardiovascular outcome using a larger population might find such an association, or further links we were not able to attest statistical significance for. Nevertheless, the particular strengths of this study are its precise well characterization of patients, as well as the long follow-up time of up to 8 years. We further want to emphasize that our study participants were patients undergoing coronary angiography for the evaluation of CAD and are therefore a selected group and thus do not reflect the general population. However, the study subjects represent a patient cohort with a high vascular risk and therefore deserve particular clinical interest. Notably, studies on chemerin in coronary patients are scarce and our study represents the first observation linking chemerin to future cardiovascular event risk. In conclusion, this study corroborates the association between chemerin and renal function. Moreover, it demonstrates for the first time that high chemerin levels are predictive for renal impairment and cardiovascular events and that polymorphisms in 15q15–23 might have an impact on chemerin levels beyond common genetic variations in RARRES2. 4. Methods 4.1. Study subjects From October 2005 through December 2013 we enrolled 1049 consecutive Caucasian patients who were referred to elective coronary angiography for the evaluation of established or suspected stable CAD. Out of these 495 sex-matched patients were selected for determination of plasma chemerin concentration. Patients undergoing coronary angiography for other reasons were not enrolled. In particular, no patients with acute coronary syndromes were enrolled. Information on conventional cardiovascular risk factors was obtained by a standardized interview and systolic/diastolic blood pressure was measured by the Riva–Rocci method under resting conditions in a sitting position at the day of hospital entry at least 5 h after hospitalization. Hypertension was defined according to the Seventh Report of the Joint National Committee on Prevention, Detection, Evaluation, and Treatment of High Blood Pressure [47], and Type 2 diabetes mellitus (T2DM) was diagnosed according to World Health Organization criteria [48]. Height and weight were recorded, and body mass index (BMI) was calculated as body weight (kg)/height (m2). According to WHO criteria, BMI ≥ 30 was regarded as obesity [49]. According to National Cholesterol Education Program ATP-III criteria (NCEP-ATPIII) [50], the MetS was diagnosed in the presence of any three of: waist circumference N102 cm in men and N 88 cm in women, triglycerides ≥150 mg/dl (1.7 mmol/l), high density lipoprotein (HDL) cholesterol b40 mg/dl (1.0 mmol/l) in men and b 50 mg/dl (1.3 mmol/l) in women, blood pressure ≥ 130/≥ 85 mm Hg, or fasting glucose ≥100 mg/dl (5.6 mmol/l). Coronary angiography was performed with the Judkin's technique and the severity of stenosis was assessed by visual inspection by a team of two investigators who were blinded to serologic assays as described previously [51]. In short, coronary artery stenoses with lumen narrowing ≥ 50% were considered significant and the extent of CAD was defined as the number of significant coronary stenoses in a given patient. Coronary arteries were defined as normal in the absence of any visible lumen narrowing at angiography. The present study has been approved by the Ethics Committee of the University of Innsbruck. Written informed consent was given by all participants. 4.2. Laboratory analyses Venous blood samples were collected after an overnight fast of 12 h before angiography was performed and laboratory measurements were performed from fresh plasma samples, as described previously [52].
Please cite this article as: A. Leiherer, et al., High plasma chemerin is associated with renal dysfunction and predictive for cardiovascular events — Insights from phenotype and genotype characterization, Vascul. Pharmacol. (2015), http://dx.doi.org/10.1016/j.vph.2015.08.010
A. Leiherer et al. / Vascular Pharmacology xxx (2015) xxx–xxx
Serum triglycerides, total cholesterol, low density lipoprotein (LDL) cholesterol, and HDL cholesterol were determined on a Cobas 6000/ 8000 (Roche, Basel, Switzerland). Urinary albumin excretion was expressed as the albumin/creatinine concentration ratio in a random morning urine specimen. The urinary albumin concentration was determined using immunoturbidometry (Tina-quant Albumin Gen.2 Assay, Roche, Basel, Switzerland). The glomerular filtration rate (GFR) has been estimated according to the quadratic Mayo Clinic equation, which gives more accurate estimates of GFR in patients with nearly normal renal function [53]. If serum creatinine was b0.8 mg/dl, 0.8 mg/dl was inserted as a value for serum creatinine, as described previously [54]. Both serum and urinary creatinine concentrations were measured using the modified Jaffé method (Creatinine Jaffé Gen.2 Assay, Roche). Chronic kidney disease (CKD) stage ≥ 2 was diagnosed for eGFR b90 ml/min/1.73 m2 according to the National Kidney Foundation — Kidney Disease Outcomes Quality Initiative (K/DOQI) guidelines [55]. Plasma chemerin levels were determined with a commercial chemerin enzyme-linked immunosorbent assay (ELISA) kit (Aviscera Bioscience, CA, USA; catalog no. SK00171-01), specific for total human chemerin with an inter-assay variation of less than 10%. 4.3. Prospective study The mean follow-up time of the study was 6.9 ± 0.7 years. The primary study endpoint was composite of coronary event, strokes, and revascularization procedures as previously referred to as major vascular events by the Heart Protection Study Collaborative Group [56]. In detail, the endpoint comprised coronary death (fatal myocardial infarction, sudden cardiac death, mortality from congestive heart failure due to CAD), fatal ischemic stroke, non-fatal myocardial infarction, non-fatal ischemic stroke and need for aortocoronary bypass, percutaneous transluminal coronary angioplasty, or vascular surgery revascularization in the carotid or peripheral arterial beds. Revascularization procedures have been considered as end points unless they were planned as a consequence of the baseline examination and therefore were not “future” events. Time and causes of death have been regularly obtained from a national survey (Statistik Austria, Vienna, Austria) or from hospital records. At a first follow-up-visit after 3.5 ± 1.1 years, renal function has been reassessed as described above and all fatal as well as non-fatal cardiovascular events have been separately recorded. 4.4. Cardio-Metabo Chip analysis DNA was extracted from patient blood samples and single nucleotide polymorphisms (SNPs) in cardiovascular and metabolism genes were characterized using the Illumina Cardio-Metabo Chip technology (Illumina Inc., San Diego, CA) as described previously [57]. Patient samples were excluded if they had genotyping failure for more than 5% of the sites or if they were identified as duplicates. From a total of 196,725 SNPs those were excluded with a minor allele frequency of less than 0.5%. In addition SNPs were also excluded, if they failed to be genotyped in more than 5% of the study population, or if they were not in Hardy–Weinberg equilibrium among samples (critical pvalue = 0.0001). After frequency and genotyping pruning, there were 130,909 SNPs left. With these settings, we did not observe significant genomic inflation (λ = 1.03). 4.5. SNP selection and tagging analysis Due to the fact that the Cardio-Metabo Chip does not cover the RARRES2 gene, coding for chemerin, respective SNPs for genotyping have been manually chosen. Two tagging SNPs (rs3735167 and rs4721) were selected from the HapMap SNP database [58], version 3 release R2; analysis panel: CEU + TSI (Utah residents with ancestry from Northern and Western Europe as well as Tuscan residents in Italy), using as criteria a minor allele frequency (MAF) ≥ 0.01 and
7
pairwise r2 ≥ 0.8 according to Tagger software [59] implemented in the program Haploview version 4.2 [60]. According to HapMap SNP database, these tagging SNPs capture 100% of RARRES2 variants with a MAF ≥0.01 within a region comprising 20 kb of chromosome 7, position 149,652,000 to 149,672,000 (NCBI build 36, hg18). SNP rs3735167 is located in the 5′flanking region of RARRES2 and has recently been linked to chemerin concentration [38], whereas rs4721, known to be associated with visceral fat mass [16], is in the 3′UTR. The pairwise linkage disequilibrium (D′ = 0.898; r2 = 0.376) between rs3735167 and rs4721 has been calculated using Haploview 4.2. Genotypes for SNP rs3735167, and rs4721 have been called in the larger population of all 1049 enrolled patients who were referred to elective coronary angiography for the evaluation of established or suspected stable CAD. Their distribution was in accordance with the Hardy–Weinberg equilibrium.
4.6. Genotyping Genotyping of RARRES2 variants rs3735167, and rs4721 was carried out on a LightCycler® 480 Real-Time PCR System (F. Hoffmann-La Roche Ltd., Basel, Switzerland) using the Assay-on-Demand™ service (Applied Biosystems, Forster City, CA) as described previously [61]. Observed numbers of each genotype were compared with those expected when the sample was in Hardy–Weinberg equilibrium using the Chi-square test with one degree of freedom.
4.7. Statistical analysis Differences in baseline characteristics were tested for statistical significance with the Chi-squared tests for categorical and Jonckheere– Terpstra tests for continuous variables, respectively. Correlation analyses were performed calculating non-parametric Spearman rank correlation coefficients. In addition, analysis of covariance models (ANCOVA) were built using a general linear model approach. For comparing the continuous or categorical variables between baseline and follow-up in patients, we used Wilcoxon and McNemar test respectively. Adjusted hazard ratios for the incidence of vascular events were derived from Cox proportional hazard models. Results are given as mean (standard deviation) if not denoted otherwise and p-values of b0.05 were considered significant. Normal distribution was checked using Kolmogorov– Smirnov and Shapiro–Wilk test, respectively. All statistical analyses were performed with SPSS 20.0 for Windows (SPSS, Inc., Chicago, IL) and genome-wide association of z-transformed variables with PLINK (http://pngu.mgh.harvard.edu/purcell/plink [62]).
Funding sources This work has been supported by the Anniversary Fund of the Austrian National Bank (project number 14159). Supplementary data to this article can be found online at http://dx. doi.org/10.1016/j.vph.2015.08.010.
Acknowledgments Cardio-Metobo Chip analysis was performed by the Life and Brain Center at the Institute of Human Genetics, University of Bonn, Germany. We thank the Jubiläumsfonds of the Austrian National Bank (Vienna, Austria), Dr. Karl Josef Hier, the Peter Goop Stiftung (Vaduz, Liechtenstein), the Fachhochschule Dornbirn (Dornbirn, Austria), and the Institute for Clinical Chemistry at the Academic Teaching Hospital Feldkirch (Feldkirch, Austria) for providing us with generous research grants. We further thank Dr. Nicole Stark and Dr. Simone Geller Rhomberg for performing ELISAs.
Please cite this article as: A. Leiherer, et al., High plasma chemerin is associated with renal dysfunction and predictive for cardiovascular events — Insights from phenotype and genotype characterization, Vascul. Pharmacol. (2015), http://dx.doi.org/10.1016/j.vph.2015.08.010
8
A. Leiherer et al. / Vascular Pharmacology xxx (2015) xxx–xxx
Reference [1] H. Sell, A. Divoux, C. Poitou, A. Basdevant, J.L. Bouillot, P. Bedossa, J. Tordjman, J. Eckel, K. Clement, Chemerin correlates with markers for fatty liver in morbidly obese patients and strongly decreases after weight loss induced by bariatric surgery, J. Clin. Endocrinol. Metab. 95 (2010) 2892–2896. [2] V. Wittamer, J.D. Franssen, M. Vulcano, J.F. Mirjolet, E. Le Poul, I. Migeotte, S. Brezillon, R. Tyldesley, C. Blanpain, M. Detheux, A. Mantovani, S. Sozzani, G. Vassart, M. Parmentier, D. Communi, Specific recruitment of antigen-presenting cells by chemerin, a novel processed ligand from human inflammatory fluids, J. Exp. Med. 198 (2003) 977–985. [3] M. Becker, K. Rabe, C. Lebherz, J. Zugwurst, B. Goke, K.G. Parhofer, M. Lehrke, U.C. Broedl, Expression of human chemerin induces insulin resistance in the skeletal muscle but does not affect weight, lipid levels, and atherosclerosis in LDL receptor knockout mice on high-fat diet, Diabetes 59 (2010) 2898–2903. [4] K. Bozaoglu, J.E. Curran, C.J. Stocker, M.S. Zaibi, D. Segal, N. Konstantopoulos, S. Morrison, M. Carless, T.D. Dyer, S.A. Cole, H.H. Goring, E.K. Moses, K. Walder, M.A. Cawthorne, J. Blangero, J.B. Jowett, Chemerin, a novel adipokine in the regulation of angiogenesis, J. Clin. Endocrinol. Metab. 95 (2010) 2476–2485. [5] M. Banas, K. Zabieglo, G. Kasetty, M. Kapinska-Mrowiecka, J. Borowczyk, J. Drukala, K. Murzyn, B.A. Zabel, E.C. Butcher, J.M. Schroeder, A. Schmidtchen, J. Cichy, Chemerin is an antimicrobial agent in human epidermis, PLoS One 8 (2013) e58709. [6] J. Skrzeczynska-Moncznik, K. Wawro, A. Stefanska, E. Oleszycka, P. Kulig, B.A. Zabel, M. Sulkowski, M. Kapinska-Mrowiecka, M. Czubak-Macugowska, E.C. Butcher, J. Cichy, Potential role of chemerin in recruitment of plasmacytoid dendritic cells to diseased skin, Biochem. Biophys. Res. Commun. 380 (2009) 323–327. [7] B.A. Zabel, A.M. Silverio, E.C. Butcher, Chemokine-like receptor 1 expression and chemerin-directed chemotaxis distinguish plasmacytoid from myeloid dendritic cells in human blood, J. Immunol. 174 (2005) 244–251. [8] S.W. Watts, A.M. Dorrance, M.E. Penfold, J.L. Rourke, C.J. Sinal, B. Seitz, T.J. Sullivan, T.T. Charvat, J.M. Thompson, R. Burnett, G.D. Fink, Chemerin connects fat to arterial contraction, Arterioscler. Thromb. Vasc. Biol. 33 (2013) 1320–1328. [9] K. Bozaoglu, K. Bolton, J. McMillan, P. Zimmet, J. Jowett, G. Collier, K. Walder, D. Segal, Chemerin is a novel adipokine associated with obesity and metabolic syndrome, Endocrinology 148 (2007) 4687–4694. [10] K.B. Goralski, T.C. McCarthy, E.A. Hanniman, B.A. Zabel, E.C. Butcher, S.D. Parlee, S. Muruganandan, C.J. Sinal, Chemerin, a novel adipokine that regulates adipogenesis and adipocyte metabolism, J. Biol. Chem. 282 (2007) 28175–28188. [11] C. Albanesi, C. Scarponi, S. Pallotta, R. Daniele, D. Bosisio, S. Madonna, P. Fortugno, S. Gonzalvo-Feo, J.D. Franssen, M. Parmentier, O. De Pita, G. Girolomoni, S. Sozzani, Chemerin expression marks early psoriatic skin lesions and correlates with plasmacytoid dendritic cell recruitment, J. Exp. Med. 206 (2009) 249–258. [12] J. Weigert, F. Obermeier, M. Neumeier, J. Wanninger, M. Filarsky, S. Bauer, C. Aslanidis, G. Rogler, C. Ott, A. Schaffler, J. Scholmerich, C. Buechler, Circulating levels of chemerin and adiponectin are higher in ulcerative colitis and chemerin is elevated in Crohn's disease, Inflamm. Bowel Dis. 16 (2010) 630–637. [13] J. Weigert, M. Neumeier, J. Wanninger, M. Filarsky, S. Bauer, R. Wiest, S. Farkas, M.N. Scherer, A. Schaffler, C. Aslanidis, J. Scholmerich, C. Buechler, Systemic chemerin is related to inflammation rather than obesity in Type 2 diabetes, Clin. Endocrinol. (Oxf) 72 (2010) 342–348. [14] K. Landgraf, D. Friebe, T. Ullrich, J. Kratzsch, K. Dittrich, G. Herberth, V. Adams, W. Kiess, S. Erbs, A. Korner, Chemerin as a mediator between obesity and vascular inflammation in children, J. Clin. Endocrinol. Metab. 97 (2012) E556–E564. [15] Y. Li, B. Shi, S. Li, Association between serum chemerin concentrations and clinical indices in obesity or metabolic syndrome: a meta-analysis, PLoS One 9 (2014) e113915. [16] K. Müssig, H. Staiger, F. Machicao, C. Thamer, J. Machann, F. Schick, C.D. Claussen, N. Stefan, A. Fritsche, H.U. Haring, RARRES2, encoding the novel adipokine chemerin, is a genetic determinant of disproportionate regional body fat distribution: a comparative magnetic resonance imaging study, Metabolism 58 (2009) 519–524. [17] Q. Yan, Y. Zhang, J. Hong, W. Gu, M. Dai, J. Shi, Y. Zhai, W. Wang, X. Li, G. Ning, The association of serum chemerin level with risk of coronary artery disease in Chinese adults, Endocrine 41 (2012) 281–288. [18] L. Xiaotao, Z. Xiaoxia, X. Yue, W. Liye, Serum chemerin levels are associated with the presence and extent of coronary artery disease, Coron. Artery Dis. 23 (2012) 412–416. [19] Y.J. Hah, N.K. Kim, M.K. Kim, H.S. Kim, S.H. Hur, H.J. Yoon, Y.N. Kim, K.G. Park, Relationship between chemerin levels and cardiometabolic parameters and degree of coronary stenosis in Korean patients with coronary artery disease, Diabetes Metab. J. 35 (2011) 248–254. [20] M. Lehrke, A. Becker, M. Greif, R. Stark, R.P. Laubender, F. von Ziegler, C. Lebherz, J. Tittus, M. Reiser, C. Becker, B. Goke, A.W. Leber, K.G. Parhofer, U.C. Broedl, Chemerin is associated with markers of inflammation and components of the metabolic syndrome but does not predict coronary atherosclerosis, Eur. J. Endocrinol. 161 (2009) 339–344. [21] H.S. Mattu, H.S. Randeva, Role of adipokines in cardiovascular disease, J. Endocrinol. 216 (2013) T17–T36. [22] D. Pfau, A. Bachmann, U. Lossner, J. Kratzsch, M. Bluher, M. Stumvoll, M. Fasshauer, Serum levels of the adipokine chemerin in relation to renal function, Diabetes Care 33 (2010) 171–173. [23] T. Yamamoto, A.R. Qureshi, B. Anderstam, O. Heimburger, P. Barany, B. Lindholm, P. Stenvinkel, J. Axelsson, Clinical importance of an elevated circulating chemerin level in incident dialysis patients, Nephrol. Dial. Transplant. 25 (2010) 4017–4023. [24] P. Rutkowski, T. Sledzinski, H. Zielinska, S. Lizakowski, E. Goyke, S. SzrokWojtkiewicz, J. Swierczynski, B. Rutkowski, Decrease of serum chemerin concentration in patients with end stage renal disease after successful kidney transplantation, Regul. Pept. 173 (2012) 55–59.
[25] P. Rein, A. Vonbank, C.H. Saely, S. Beer, V. Jankovic, C. Boehnel, J. Breuss, L. Risch, P. Fraunberger, H. Drexel, Relation of albuminuria to angiographically determined coronary arterial narrowing in patients with and without Type 2 diabetes mellitus and stable or suspected coronary artery disease, Am. J. Cardiol. 107 (2011) 1144–1148. [26] P. Rein, C.H. Saely, A. Muendlein, A. Vonbank, H. Drexel, Serial decline of kidney function as a novel biomarker for the progression of atherothrombotic disease, Atherosclerosis 211 (2010) 348–352. [27] W. Hu, P. Feng, Elevated serum chemerin concentrations are associated with renal dysfunction in Type 2 diabetic patients, Diabetes Res. Clin. Pract. 91 (2011) 159–163. [28] J. Axelsson, The emerging biology of adipose tissue in chronic kidney disease: from fat to facts, Nephrol. Dial. Transplant. 23 (2008) 3041–3046. [29] T. Bobbert, F. Schwarz, A. Fischer-Rosinsky, L. Maurer, M. Mohlig, A.F. Pfeiffer, K. Mai, J. Spranger, Chemerin and prediction of Diabetes mellitus Type 2, Clin. Endocrinol. (Oxf) (2015)http://dx.doi.org/10.1111/cen.12707. [30] W. Hu, Q. Yu, J. Zhang, D. Liu, Rosiglitazone ameliorates diabetic nephropathy by reducing the expression of Chemerin and ChemR23 in the kidney of streptozotocininduced diabetic rats, Inflammation 35 (2012) 1287–1293. [31] S. Muruganandan, S.D. Parlee, J.L. Rourke, M.C. Ernst, K.B. Goralski, C.J. Sinal, Chemerin, a novel peroxisome proliferator-activated receptor gamma (PPARgamma) target gene that promotes mesenchymal stem cell adipogenesis, J. Biol. Chem. 286 (2011) 23982–23995. [32] A.D. Dobrian, The complex role of PPARgamma in renal dysfunction in obesity: managing a Janus-faced receptor, Vascul. Pharmacol. 45 (2006) 36–45. [33] D. Stejskal, M. Karpisek, Z. Hanulova, M. Svestak, Chemerin is an independent marker of the metabolic syndrome in a Caucasian population—a pilot study, Biomed. Pap. Med. Fac. Univ. Palacky Olomouc Czech Repub. 152 (2008) 217–221. [34] G.L. Bakris, P. Hart, E. Ritz, Beta blockers in the management of chronic kidney disease, Kidney Int. 70 (2006) 1905–1913. [35] H.M. Kim, B.W. Lee, Y.M. Song, W.J. Kim, H.J. Chang, D.H. Choi, H.T. Yu, E. Kang, B.S. Cha, H.C. Lee, Potential association between coronary artery disease and the inflammatory biomarker YKL-40 in asymptomatic patients with Type 2 diabetes mellitus, Cardiovasc. Diabetol. 11 (2012) 84. [36] Q. Ji, Y. Lin, Z. Liang, K. Yu, Y. Liu, Z. Fang, L. Liu, Y. Shi, Q. Zeng, C. Chang, M. Chai, Y. Zhou, Chemerin is a novel biomarker of acute coronary syndrome but not of stable angina pectoris, Cardiovasc. Diabetol. 13 (2014) 145. [37] N.P. Kadoglou, D.K. Tahmatzidis, C. Giannakoulas, A. Kapelouzou, A. Gkontopoulos, J. Parissis, S. Lampropoulos, G. Kottas, Serum levels of novel adipokines, omentin-1 and chemerin, in patients with acute myocardial infarction: KOZANI STUDY, J. Cardiovasc. Med. (Hagerstown) 16 (2015) 341–346. [38] A. Tönjes, M. Scholz, J. Breitfeld, C. Marzi, H. Grallert, A. Gross, C. Ladenvall, D. Schleinitz, K. Krause, H. Kirsten, E. Laurila, J. Kriebel, B. Thorand, W. Rathmann, L. Groop, I. Prokopenko, B. Isomaa, F. Beutner, J. Kratzsch, J. Thiery, M. Fasshauer, N. Kloting, C. Gieger, M. Bluher, M. Stumvoll, P. Kovacs, Genome wide meta-analysis highlights the role of genetic variation in RARRES2 in the regulation of circulating serum chemerin, PLoS Genet. 10 (2014) e1004854. [39] M. Rask-Andersen, J.A. Jacobsson, G. Moschonis, A.E. Ek, G.P. Chrousos, C. Marcus, Y. Manios, R. Fredriksson, H.B. Schioth, The MAP2K5-linked SNP rs2241423 is associated with BMI and obesity in two cohorts of Swedish and Greek children, BMC Med. Genet. 13 (2012) 36. [40] W. Wen, Y.S. Cho, W. Zheng, R. Dorajoo, N. Kato, L. Qi, C.H. Chen, R.J. Delahanty, Y. Okada, Y. Tabara, D. Gu, D. Zhu, C.A. Haiman, Z. Mo, Y.T. Gao, S.M. Saw, M.J. Go, F. Takeuchi, L.C. Chang, Y. Kokubo, J. Liang, M. Hao, L. Le Marchand, Y. Zhang, Y. Hu, T.Y. Wong, J. Long, B.G. Han, M. Kubo, K. Yamamoto, M.H. Su, T. Miki, B.E. Henderson, H. Song, A. Tan, J. He, D.P. Ng, Q. Cai, T. Tsunoda, F.J. Tsai, N. Iwai, G.K. Chen, J. Shi, J. Xu, X. Sim, Y.B. Xiang, S. Maeda, R.T. Ong, C. Li, Y. Nakamura, T. Aung, N. Kamatani, J.J. Liu, W. Lu, M. Yokota, M. Seielstad, C.S. Fann, J.Y. Wu, J.Y. Lee, F.B. Hu, T. Tanaka, E.S. Tai, X.O. Shu, Meta-analysis identifies common variants associated with body mass index in east Asians, Nat. Genet. 44 (2012) 307–311. [41] L. Chen, J. Hou, L. Ye, Y. Chen, J. Cui, W. Tian, C. Li, L. Liu, MicroRNA-143 regulates adipogenesis by modulating the MAP2K5–ERK5 signaling, Sci. Rep. 4 (2014) 3819. [42] K. Tagawa, C. Taya, Y. Hayashi, M. Nakagawa, Y. Ono, R. Fukuda, H. Karasuyama, N. Toyama-Sorimachi, Y. Katsui, S. Hata, S. Ishiura, I. Nonaka, Y. Seyama, K. Arahata, H. Yonekawa, H. Sorimachi, K. Suzuki, Myopathy phenotype of transgenic mice expressing active site-mutated inactive p94 skeletal muscle-specific calpain, the gene product responsible for limb girdle muscular dystrophy Type 2A, Hum. Mol. Genet. 9 (2000) 1393–1402. [43] K. Walder, J. McMillan, N. Lapsys, A. Kriketos, J. Trevaskis, A. Civitarese, A. Southon, P. Zimmet, G. Collier, Calpain 3 gene expression in skeletal muscle is associated with body fat content and measures of insulin resistance, Int. J. Obes. Relat. Metab. Disord. 26 (2002) 442–449. [44] A.J. Levine, A.M. Puzio-Kuter, The control of the metabolic switch in cancers by oncogenes and tumor suppressor genes, Science 330 (2010) 1340–1344. [45] R.A. Cairns, I.S. Harris, T.W. Mak, Regulation of cancer cell metabolism, Nat. Rev. Cancer 11 (2011) 85–95. [46] A. Molchadsky, O. Ezra, P.G. Amendola, D. Krantz, I. Kogan-Sakin, Y. Buganim, N. Rivlin, N. Goldfinger, V. Folgiero, R. Falcioni, R. Sarig, V. Rotter, p53 is required for brown adipogenic differentiation and has a protective role against diet-induced obesity, Cell Death Differ. 20 (2013) 774–783. [47] P.J. Scanlon, D.P. Faxon, A.M. Audet, B. Carabello, G.J. Dehmer, K.A. Eagle, R.D. Legako, D.F. Leon, J.A. Murray, S.E. Nissen, C.J. Pepine, R.M. Watson, J.L. Ritchie, R.J. Gibbons, M.D. Cheitlin, T.J. Gardner, A. Garson Jr., R.O. Russell Jr., T.J. Ryan, S.C. Smith Jr., ACC/ AHA guidelines for coronary angiography. A report of the American College of Cardiology/American Heart Association Task Force on practice guidelines (Committee on Coronary Angiography). Developed in collaboration with the Society for Cardiac Angiography and Interventions, J. Am. Coll. Cardiol. 33 (1999) 1756–1824.
Please cite this article as: A. Leiherer, et al., High plasma chemerin is associated with renal dysfunction and predictive for cardiovascular events — Insights from phenotype and genotype characterization, Vascul. Pharmacol. (2015), http://dx.doi.org/10.1016/j.vph.2015.08.010
A. Leiherer et al. / Vascular Pharmacology xxx (2015) xxx–xxx [48] K.G. Alberti, P.Z. Zimmet, Definition, diagnosis and classification of diabetes mellitus and its complications. Part 1: diagnosis and classification of diabetes mellitus provisional report of a WHO consultation, Diabet. Med. 15 (1998) 539–553. [49] World Health Organization, Obesity and overweight, WHO Fact Sheet No. 3112013 (http://www.who.int). [50] Expert Panel, Third Report of the National Cholesterol Education Program (NCEP) Expert Panel on Detection, Evaluation, and Treatment of High Blood Cholesterol in Adults (Adult Treatment Panel III) final report, Circulation 106 (2002) 3143–3421. [51] H. Drexel, F.W. Amann, J. Beran, K. Rentsch, R. Candinas, J. Muntwyler, A. Luethy, T. Gasser, F. Follath, Plasma triglycerides and three lipoprotein cholesterol fractions are independent predictors of the extent of coronary atherosclerosis, Circulation 90 (1994) 2230–2235. [52] C.H. Saely, L. Koch, F. Schmid, T. Marte, S. Aczel, P. Langer, G. Hoefle, H. Drexel, Lipoprotein(a), Type 2 diabetes and vascular risk in coronary patients, Eur. J. Clin. Invest. 36 (2006) 91–97. [53] A.D. Rule, T.S. Larson, E.J. Bergstralh, J.M. Slezak, S.J. Jacobsen, F.G. Cosio, Using serum creatinine to estimate glomerular filtration rate: accuracy in good health and in chronic kidney disease, Ann. Intern. Med. 141 (2004) 929–937. [54] L. Risch, C.H. Saely, U. Neyer, G. Hoefle, G. Gouya, M. Zerlauth, G.M. Risch, M. Risch, H. Drexel, Prevalence of decreased glomerular filtration rate in patients seeking non-nephrological medical care—an evaluation using IDMS-traceable creatinine based MDRD as well as Mayo Clinic quadratic equation estimates, Clin. Chim. Acta 378 (2007) 71–77. [55] National Kidney Foundation, K/DOQI clinical practice guidelines for chronic kidney disease: evaluation, classification, and stratification, Am. J. Kidney Dis. 39 (2002) S1–S266.
9
[56] R. Collins, J. Armitage, S. Parish, P. Sleigh, R. Peto, MRC/BHF Heart Protection Study of cholesterol-lowering with simvastatin in 5963 people with diabetes: a randomised placebo-controlled trial, Lancet 361 (2003) 2005–2016. [57] B.F. Voight, H.M. Kang, J. Ding, C.D. Palmer, C. Sidore, P.S. Chines, N.P. Burtt, C. Fuchsberger, Y. Li, J. Erdmann, T.M. Frayling, I.M. Heid, A.U. Jackson, T. Johnson, T.O. Kilpelainen, C.M. Lindgren, A.P. Morris, I. Prokopenko, J.C. Randall, R. Saxena, N. Soranzo, E.K. Speliotes, T.M. Teslovich, E. Wheeler, J. Maguire, M. Parkin, S. Potter, N.W. Rayner, N. Robertson, K. Stirrups, W. Winckler, S. Sanna, A. Mulas, R. Nagaraja, F. Cucca, I. Barroso, P. Deloukas, R.J. Loos, S. Kathiresan, P.B. Munroe, C. Newton-Cheh, A. Pfeufer, N.J. Samani, H. Schunkert, J.N. Hirschhorn, D. Altshuler, M.I. McCarthy, G.R. Abecasis, M. Boehnke, The metabochip, a custom genotyping array for genetic studies of metabolic, cardiovascular, and anthropometric traits, PLoS Genet. 8 (2012) e1002793. [58] International Hapmap Consortium, A haplotype map of the human genome, Nature 437 (2005) 1299–1320. [59] P.I. de Bakker, R. Yelensky, I. Pe'er, S.B. Gabriel, M.J. Daly, D. Altshuler, Efficiency and power in genetic association studies, Nat. Genet. 37 (2005) 1217–1223. [60] J.C. Barrett, B. Fry, J. Maller, M.J. Daly, Haploview: analysis and visualization of LD and haplotype maps, Bioinformatics 21 (2005) 263–265. [61] A. Muendlein, N. Stark, P. Rein, C.H. Saely, S. Geller-Rhomberg, K. Geiger, A. Vonbank, H. Drexel, Are AHSG polymorphisms directly associated with coronary atherosclerosis? Clin. Chim. Acta 413 (2012) 287–290. [62] S. Purcell, B. Neale, K. Todd-Brown, L. Thomas, M.A. Ferreira, D. Bender, J. Maller, P. Sklar, P.I. de Bakker, M.J. Daly, P.C. Sham, PLINK: a tool set for whole-genome association and population-based linkage analyses, Am. J. Hum. Genet. 81 (2007) 559–575.
Please cite this article as: A. Leiherer, et al., High plasma chemerin is associated with renal dysfunction and predictive for cardiovascular events — Insights from phenotype and genotype characterization, Vascul. Pharmacol. (2015), http://dx.doi.org/10.1016/j.vph.2015.08.010