Chemical Geology 409 (2015) 157–168
Contents lists available at ScienceDirect
Chemical Geology journal homepage: www.elsevier.com/locate/chemgeo
High-resolution LA-ICP-MS trace element mapping of igneous minerals: In search of magma histories Teresa Ubide ⁎, Cora A. McKenna, David M. Chew, Balz S. Kamber School of Natural Sciences, Department of Geology, Trinity College Dublin, Dublin 2, Ireland
a r t i c l e
i n f o
Article history: Received 19 December 2014 Received in revised form 20 May 2015 Accepted 28 May 2015 Available online 3 June 2015 Editor: Prof. K. Mezger Keywords: Microanalysis Laser ablation ICP-MS Geochemical mapping Mineral zoning Antecryst Magma history
a b s t r a c t We report experiments on optimisation of LA-ICP-MS mapping as a tool for visualising and quantifying internal structure of trace element concentration in igneous minerals. The experimental design was refined with maps on clinopyroxene and amphibole macrocrysts (mainly antecrysts) from a porphyritic lamprophyre in NE Spain, as well as on a high precision metal wire grid. In terms of spatial resolution, we demonstrate with scanning electron microscope and white light interferometry that a full ablation removes between 0.4 and 0.7 μm of material, depending on ablation parameters. Maps were produced with square laser beam spots of 12 and 24 μm. It was found that complexities can be resolved in the sample even though they are smaller than the beam diameter (e.g., 7–10 μm discontinuities using 12 μm laser beam). Resolution in x and y was found to be identical, probably reflecting the fast washout of the two-volume ablation cell and the short total dwell time of the analyte menu selected. Due to the excellent stage reproducibility and the limited ablation depth, it is feasible to re-ablate the identical map area many times employing different instrument parameters or analyte menus. On the magmatic crystals, LA-ICP-MS maps define very sharp compositional zoning in trace elements, highlighting complex crystallisation histories where ‘normal’ magmatic fractionation is not the only process. Events of mafic recharge are easily recognised as zones enriched in compatible metals such as Cr, Ni or Sc. Further, trace element maps reveal complexities in mineral zoning previously undetectable with petrography or major element data. These include resorbed primitive cores and oscillatory zoning within apparently homogeneous mineral zones. Therefore, LA-ICP-MS mapping opens a new window of opportunity for analysis of magmatic histories. The wide combination of instrumental parameters, such as laser beam size, scan speed and repetition rate, make it possible to carry out experiments at different levels of detail. We recommend a two-step approach to mapping. The initial step involves rapid maps to gain an overview of potential complexities in the sample; this enhances representativeness of the analysed materials, as a large number of crystals and trace elements can be tested in little time. Subsequently, detailed maps can be carried out on areas of interest. An additional functionality is to create 1D-profiles from 2D-maps. The potential of the technique to unveil compositional complexities efficiently and at greater detail than traditional microanalysis will help to improve our understanding of processes in the magmatic environment and beyond. © 2015 Elsevier B.V. All rights reserved.
1. Introduction Compositional variations in geological materials at the microscopic scale can contain a record of geological processes and the evolution of environments. The rich compositional archive has particularly been exploited in igneous petrology, where chemical zoning of individual crystals can be directly related to changes in magmatic environment (Bussweiler et al., 2015; Streck, 2008). Trace element variations during crystal growth bear important information on magma compositions and conditions during crystallisation, complementing petrography and major element studies (Ginibre et al., 2007). ⁎ Corresponding author. E-mail address:
[email protected] (T. Ubide).
http://dx.doi.org/10.1016/j.chemgeo.2015.05.020 0009-2541/© 2015 Elsevier B.V. All rights reserved.
Technological improvements in microanalysis have led to the realisation that magmatic mineral phases are often not in equilibrium with their enclosing groundmass (e.g., Davidson et al., 2007). This has informed the premise that many large crystals, rather than being phenocrysts, should be regarded as antecrysts that formed prior to emplacement at depth (Charlier et al., 2005; Davidson et al., 2007; Gill et al., 2006; Hildreth and Wilson, 2007; Jerram and Martin, 2008; Larrea et al., 2013). The complexity within antecrysts implies the existence of complex magma plumbing systems with episodes of contamination, recharge and magma mixing (Francalanci et al., 2012; Sakyi et al., 2012; Ubide et al., 2014a, 2014b). Events of recharge into deep magma chambers with a more primitive (often fluid-rich) batch of magma have been studied with particular interest as they are considered the main cause for triggering volcanic eruptions (e.g., Kent, 2013;
158
T. Ubide et al. / Chemical Geology 409 (2015) 157–168
Kent et al., 2010; Longpré et al., 2014; Myers et al., 2014; Reubi and Blundy, 2007). Given the amount of information potentially locked in magmatic crystals, large analytical efforts continue into decoding petrographic textures and microchemical fingerprints (e.g., Saunders et al., 2014). Because high spatial resolution is key to obtaining the maximum amount of information, elemental concentrations are typically measured by in situ analysis. This is achieved via different analytical approaches using scanning electron microscopy (SEM), electron microprobe (EMP), secondary ion mass spectrometry (SIMS), transmission electron microscopy (TEM) and laser ablation inductively coupled plasma mass spectrometry (LA-ICP-MS). Radiogenic isotope ratios are typically measured from micromilled material (Davidson et al., 2007) but in this field too, SIMS and LA-ICP-MS are starting to permit in situ analysis (e.g., Bellucci et al., 2014; Paul et al., 2011). In terms of ease of use, analysis time and cost, LA-ICP-MS has rapidly developed in the last decades as an in situ analysis technique of trace element concentrations in geological materials. LA-ICP-MS attains better detection limits (at the ppm level for trace elements in the medium- to high-mass range which are not typically affected by polyatomic interferences) than electron beam techniques and is considerably cheaper than SIMS. The improvement of data reduction schemes (e.g., Hellstrom et al., 2008; Paton et al., 2011) has paved the way for the transition from spot and raster analyses to trace element distribution maps (Woodhead et al., 2007, 2008; Paul et al., 2012, 2014; Rittner and Müller, 2012). Ulrich et al. (2009) explored the possibilities of the LA-ICP-MS mapping and its applications to a variety of geological systems. They highlighted the potential of compositional images to reveal complexities that are not visible under the microscope and were not expected or appreciated from microbeam spot analyses. In this contribution we explore LA-ICP-MS mapping capabilities for magmatic studies. This includes an investigation of the spatial resolution of the technique, including the size of discontinuities it is able to map and the depth of material it ablates and analyses. Experiments were performed to optimise the analytical set up and to provide recommendations for obtaining the most effective and best detail maps. By way of example, the results of this study are used to interpret better magma evolution pathways, and the method is potentially applicable to any material which can be successfully ablated by the LA-ICP-MS method. 2. Materials Most LA-ICP-MS mapping experiments in this study were carried out on clinopyroxene and amphibole crystals from a lamprophyre intrusion. Additional analyses were performed on a precision machined grid composed of copper–palladium wires of known dimensions. The studied magmatic intrusion belongs to the Late Cretaceous alkaline lamprophyre suite in the Catalonian Coastal Ranges (Ubide, 2013; Ubide et al., 2014b, 2014c). Detailed petrography and geochemistry indicated that these lamprophyres were fed by a complex magmatic system, where ascending magmas entrained crystals from disparate crystallisation levels (Ubide et al., 2014b). For the present study, we focused on a ~4 m subhorizontal sheet-like magma body (Molí d'en Ponç lamprophyre: UTM 31T 466218 4629029; Ubide et al., 2014b) that is an ideal target because: i) it has an alkaline composition with high concentrations of trace elements (Ubide et al., 2014b) that help producing small-scale maps; ii) it has large crystals of clinopyroxene and amphibole showing complex zoning patterns (Ubide et al., 2014b); and iii) CaO contents in clinopyroxene and amphibole crystals are homogeneous despite the marked zoning in other elements (see supplementary data Tables E1 and E2 from Ubide et al., 2014b), making Ca suitable for easy internal standardisation. The analytical work was conducted on one standard 30 μm polished thin section of sample SFB-4 (Fig. 1). The rock is a porphyritic camptonite composed of macrocrysts of clinopyroxene, amphibole, pseudomorphed
olivine and opaque minerals standing out from a microcrystalline groundmass with amphibole, feldspars and minor biotite, apatite, analcime, calcite and recrystallised glass. Previous work revealed that most macrocrysts are not cognate phenocrysts but recycled antecrysts, and their growth stratigraphy records an intricate succession of magmatic processes in the plumbing system, including magma recharge, magma mixing and polybaric fractionation during magma ascent and emplacement (Ubide et al., 2014b). Here we present LA-ICP-MS maps of three macrocrysts, named 1) the ‘little clinopyroxene’; 2) the ‘elongated amphibole’ and 3) the ‘little amphibole’ (Fig. 1). These examples represent a range of simple vs. complex zoning patterns and small vs. large size to cover the mapping development goals. Additionally, a precision machined wire grid was used to investigate the spatial resolution capabilities of the technique (Section 4.1). We used a 300-mesh grid of 3.05 mm diameter, which are commonly used as a sample support mesh in TEM studies. The grid is constructed from wires made of a copper–palladium alloy. It was placed on top of a standard thin section glass and secured with adhesive tape. The orientation of the grid was deliberately aligned at an angle to the edges of the glass slide to avoid potential resolution artefacts from ablating orthogonally. Measurements carried out with SEM confirmed the specified 20 μm wire thickness and 60 μm spacing (Fig. 1). SEM observation also clearly identified the pilot intersection of two wires at the centre of the grid, leading to a distinctive central node that protrudes 7 to 10 μm away from the wires. This area was investigated to help determining the spatial resolution of the method. The wires are also 20 μm deep (they have a square cross section), and this compromises the analysis of the glass substrate between the wires as the focal depth of the laser is less than 20 μm. 3. Methods 3.1. LA-ICP-MS mapping: experimental approach LA-ICP-MS experiments were carried out in 2014 at the Geochemistry Laboratories of Trinity College Dublin. We used a Photon Machines Excite 193 nm excimer Ar–F laser system with a Helex 2-volume ablation cell and He–Ar carrier gas (ca. 0.8 l/min He and ca. 0.7 l/min Ar). An inhouse developed variable volume device was used for signal smoothing between the laser and the mass spectrometer, without compromising spatial resolution significantly. A small volume of N2 (ca. 7 ml/min) was introduced to the sample-gas mixture via the smoothing device to enhance signal sensitivity and reduce oxide formation. The mass spectrometer used was a quadrupole Thermo iCapQc. The instrument was tuned with scans on NIST612 glass reference material (Jochum et al., 2011) at the beginning of each analytical session. 3.1.1. Laser ablation The ablation area (i.e., the mapping area) was defined with the Chromium2.1 software (Photon Machines Inc.) in a way that slightly differs from previous approaches (Paul et al., 2012, 2014; Ulrich et al., 2009) as illustrated in Fig. 2. We used a square-shaped laser aperture which was progressively translated by continuous movement of the stage under the fixed ablation site. This generated an evenly ablated line from overlapping squares (Fig. 2b, e). To produce the full map adjacent lines were ablated in a successive manner. The effects of allowing no spacing in between lines were contrasted with those allowing for a small overlap (1 μm; Fig. 2f) to avoid un-ablated gaps. The final ablated area was square- or rectangle-shaped to facilitate production of trace element maps using different data reduction approaches (see Section 4). In the experiments on the thin section, the ablated area included the crystal of interest as well as the immediately surrounding groundmass (Fig. 2a, c). No pre-ablation was found necessary for the elements measured in this study after samples were carefully cleaned with semiconductor grade solvent.
T. Ubide et al. / Chemical Geology 409 (2015) 157–168
Grid of Cu-Pd wires
Porphyritic Camptonite SFB-4 xp l
‘ppl ’ 1
159
sketch 1
1 2
2
2
10µm
20µm
7µm 60µm 3
3
1cm
3 Cpx Am p Ol Opq gr
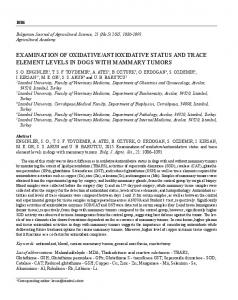
Fig. 1. Materials used in this study: polished thin section from sample SFB-4 of a camptonite lamprophyre sheet intrusion in NE Spain (see details in Ubide et al., 2014b) and precision machined grid of copper–palladium wires secured on to a glass slide base. Thin section: ‘ppl’ — ‘plane polarised light’ view obtained with a regular scan of the thin section; xpl — crossed polarised light scan, obtained by sandwiching the thin section between two polarising sheets with perpendicular polarisation directions; sketch — drawing of the thin section highlighting its porphyritic texture, with macrocrysts of clinopyroxene (Cpx), amphibole (Amp), olivine pseudomorphs (Ol) and opaque minerals (Opq) set in a microcrystalline groundmass (gr); circles mark crystals mapped in this study: 1) the ‘little clinopyroxene’, 2) the ‘elongated amphibole’, 3) the ‘little amphibole’. Grid: back scattered electron image of the wire grid including the distinctive central node that protrudes away from the wire intersection, especially where highlighted with a white and a grey arrow.
Mapping areas had variable sizes, with side lengths from 200 μm to 2 mm depending on the size of the target. All experiments employed a relatively low laser fluence of 3.4 J/cm2, as the ablation threshold for the coloured crystals was found to be low. This ensured a minimum depth of ablation and maximum sample preservation but did not successfully ablate the microcrysts of feldspar (colourless) adjacent to the larger target crystals (Fig. 2c). To optimise the technique, we carried out successive experiments varying the following parameters: laser beam size (24 μm or 12 μm square), translation or scan speed (measured in μm/s, with values of 1/2, 2/3, 3/4 or 3/2 of the laser beam size) and repetition rate (10 Hz, 5 Hz or 2 Hz). Beam size and scan speed have direct impact on the duration of the experiment, whereas repetition rate influences the depth of ablation. Although the system has a fast washout (90% signal reduction in less than 1.5 s), 30 s were allowed for washout between lines to avoid any carry-over from standards to samples and vice versa. NIST610 glass reference material (Jochum et al., 2011) was used as the calibration standard. NIST610 was always ablated with the same parameters as the samples. Two NIST610 lines were analysed at the beginning and end of each experiment and systematically every 4 to 12 sample lines, depending on the length/scan speed of the individual sample lines. Concentration values in clinopyroxene and amphibole were corrected using the calcium concentrations previously obtained by electron microprobe as an internal standard (see Section 3.1.3). 3.1.2. Mass spectrometry The data acquisition on the mass spectrometer was performed with Qtegra2.2 software (Thermo Fisher Scientific Inc.) in time-resolved analysis mode as one single continuous experiment. The cumulative dwell times for all analytes were dictated by the laser repetition rate chosen (e.g., 100 ms for 10 Hz or 200 ms for 5 Hz). It was found to be preferable to restrict maps to a limited number of elements per experiment so that the dwell times for each element could be maximised. Individual isotope dwell times were chosen according to their general abundance and their concentration in the analysed material, which was checked with a preliminary evaluation of the signal recorded by the mass spectrometer. Individual dwell times typically varied between 10 and 20 ms, whereas for major elements such as Ca, we used 5 ms in high resolution mode to avoid overly large count rates. When a large number of elements were needed, experiments were repeated as many times as necessary and the reproducibility between multiple maps of the same crystal was excellent (see Section 4 and Fig. S1, available as electronic Supplementary material). Limits of detection
(calculated following Longerich et al., 1996) were in most cases below 5 ppm, and typically below 1 ppm. 3.1.3. Data reduction Data reduction and production of trace element distribution maps was undertaken with the software Iolite v2.5 (http://www.iolite.org. au; Hellstrom et al., 2008; Paton et al., 2011; Woodhead et al., 2008). Iolite is a software package developed for mass spectrometric data reduction that runs within the Igor Pro environment (http://www. wavemetrics.com). It allows quick and visually guided reduction of large series of experimental data and runs on both Windows and Mac OSX operating systems. The laser log file was used to synchronise the ICP-MS data and record the x–y information. After importing the combined data into Iolite, baseline ‘integrations’ were defined and subtracted from reference material and sample integrations using the most appropriate spline type. Once integrations and spline types were defined, the data were reduced with two different ‘Data Reduction Schemes’ (DRS): the ‘Trace_Elements’ DRS supplied with Iolite and a modified version of that DRS developed in-house (‘Trace_Elements_Image’, available as electronic Supplementary material), which permits calculation of trace element ratios and visualisation of their distribution (see Section 4.2). Regarding the integration settings, quantitative data reduction requires the use of an external standard (we used NIST610) together with an internal elemental standard. The concentration of the internal standard in the sample can be obtained using an alternative analytical method or from the known elemental stoichiometry when crystalline materials are analysed (Longerich et al., 1996). For the magmatic crystals, we used average calcium concentrations obtained with electron microprobe (23 wt.% CaO in clinopyroxene and 12 wt.% CaO in amphibole; Ubide et al., 2014b). For the Cu–Pd grid, by contrast, data reduction was carried out using semi-quantitative mode. Following data reduction, trace element distribution maps were built with the module ‘Images from integrations’ and the more recently developed module ‘CellSpace’ (Paul et al., 2012), where compositional maps are spatially registered. Data reduction, construction of maps and analysis of the results typically took 30 min to 1 h for a given experiment, depending on the size of the mapping area and the laser parameters (spot size and scan speed). Larger ablated areas and/or smaller spot sizes and slower speeds result in longer experiments and more time intensive data treatment. The longest experiments lasted 3.5 h and required 1 h of data analysis. Running DRS calculations or creating a CellSpace map typically took
160
T. Ubide et al. / Chemical Geology 409 (2015) 157–168
Fig. 2. Surface analysis of the thin section after laser ablation, using scanning electron microscopy (a–b) and white light interferometry where colours reflect depth (c–f). A full LA-ICP-MS mapping experiment removes less than 1 μm of material. a, c) Overview of an ablated area (location 1 in Fig. 1), which includes a six-sided clinopyroxene crystal and some of the surrounding groundmass; the upper half of the ablated square was subjected to a total of seven experiments and the lower half to a total of six experiments. d) Topographic profile from d1 to d2 in c, across the ablated square. b, e) Close up showing how the ablation is carried out: individual lines ablated in a successive manner are created from overlapping ablated squares. f) Clinopyroxene subject to one laser ablation experiment with a 12 μm square laser beam, 8 μm/s scan speed, 10 Hz repetition rate and a 1 μm overlap between individual ablation lines; under these conditions, a mapping experiment removes ca. 0.7 μm of clinopyroxene and amphibole and much less feldspar (compare depths of clinopyroxene and the surrounding feldspar-rich groundmass in c).
less than 1 min on a regular Mac or PC (e.g., PC laptop with 2.70 GHz processor and 8 GB RAM). 3.2. Surface analysis To assess the physical effects of laser ablation on minerals, the lamprophyre thin section was further studied by SEM and white light interferometry (WLI) after ablation. We used the facilities at the Centre for Microscopy and Analysis of Trinity College Dublin. For SEM work, the thin section was coated with carbon (Cressington 208Carbon, high resolution carbon coater) and SEM images were taken on a Tescan MIRA XMU FE-SEM (field emission scanning electron microscope) operating under high vacuum conditions. Secondary Electron images (SE images) were taken at 5 kV accelerating voltage to show surface morphology. Backscattered electron images (BSE images) were taken at 15 kV to yield compositional information.
The WLI is an optical interference microscope. White light is scanned over a surface using a Michelson interference objective and piezoelectric z-stage translation (up to 100 μm). The image is captured with a digital camera and processed using Fourier domain analysis to produce a topographical map of the scanned surface. The z resolution of the system is sub-nanometre. The system is an Omniscan MicroXam WLI, the capture software is Mapvue 2.27.1 and the analysis software is SPIP 4.4.3. 4. Results: LA-ICP-MS trace element distribution maps 4.1. Spatial resolution In terms of depth of ablation (z), our WLI measurements indicate that a full LA-ICP-MS mapping experiment removes only 0.7 μm of either clinopyroxene or amphibole. This rate of removal was a maximum,
T. Ubide et al. / Chemical Geology 409 (2015) 157–168
obtained with a relatively high repetition rate of 10 Hz, a relatively small spot size of 12 μm and a scan speed of 8 μm/s (Fig. 2f). Even at 0.7 μm, LAICP-MS mapping has a very good z-spatial resolution compared to the non-destructive techniques employing electron beams, which suffer from deeper z-interaction and migration of volatile elements in response to high current density (e.g., Morgan and London, 2005). Fig. 2a–e shows crystal 1 (the ‘little clinopyroxene’) after repeated experiments with different ablation conditions. The whole crystal was ablated five times with a repetition rate of 5 Hz. Furthermore, the upper half of the crystal was ablated two more times with a repetition rate of 10 Hz and the lower half was ablated once more with a repetition rate of 5 Hz. After a total of seven and six ablation experiments, respectively, only ~ 3 μm of material was removed from the upper half and ~2 μm from the lower half (Fig. 2c–d), meaning that ~0.4 μm of material was removed per experiment. This implies that LA-ICP-MS mapping is an ‘only slightly’ destructive technique, with ablation depth from 0.4 to 0.7 μm mostly depending on repetition rate. Feldspars in the microcrystalline groundmass surrounding larger clinopyroxene or amphibole underwent minimal or no ablation under the same conditions (Fig. 2c). A larger fluence would be required to overcome the ablation threshold for UV-transparent minerals such as quartz and feldspar, which would be expected to produce deeper excavation than observed in our experiments. Since each mapping experiment removes less than 1 μm of ablated material, standard thin sections of 30 μm thickness would potentially allow more than 30 experiments on a single crystal or area. A few experiments are typically sufficient to cover all elements of interest, but we carried out up to 9 experiments on crystal 2 (the ‘elongated amphibole’) with no impact on the quality of the results. Map reproducibility with z was confirmed by statistical comparison of concentration results in equivalent lines from different mapping experiments on the ‘little clinopyroxene’ (see Supplementary material; Fig. S1). High correlation between multiple maps of the same crystal proves excellent map reproducibility with depth. Reproducibility of ablation over the length of a single experiment was excellent, thanks to accurate stage positioning (see Fig. 2f). Spatial resolution on the analysed surface (x–y) was explored with a size-controlled grid secured on to a glass slide base (Fig. 1), deliberately
161
arranged at an angle. Results are shown in Fig. 3 for two mapping approaches. The first is a map of a large area scanned quickly with a 24 μm square laser beam (Fig. 3a–d; the experiment took 43 min). The second is a map of a much smaller area scanned in detail with a 12 μm square laser beam (Fig. 3e–h; the experiment took 30 min). Both mapping experiments included the distinctive central node of the grid (see white arrow and grey arrow, as in Fig. 1). Maps were built using CellSpace as well as the ‘Images from integrations’ module in Iolite, and the elements shown have different concentration contrasts: Cu has high concentrations in the grid and undetectable concentrations in the glass (Fig. 3b–c and f–g), whereas La has undetectable concentrations in the grid and low concentrations in the glass (Fig. 3d and h). It should be noted that the results from the grid are semi-quantitative due to the lack of internal standardisation and the inability to simultaneously focus the laser beam on the grid as well as on the glass. On the Cu concentration maps, the grid wires are clearly resolved by LA-ICP-MS mapping with limited blurring or softening of the edges, even when using a laser beam with a slightly larger size (24 μm square) than the wire width (20 μm) and a relatively quick scan speed of 18 μm/s (Fig. 3b–c). However, the overview La concentration map shows that there was some aerosol carry-over from ablation of the glass slide to analysis over the wire, as apparent La concentrations do not drop to the expected zero ppm (Fig. 3d). It is noticeable that the SSW–NNE running wires show higher apparent La concentrations (red colours on Fig. 3d) than the WWN–EES set of wires (black and red colours). Considering that these maps were shot as orthogonal grids from left to right, this pattern is better explained by La signal-carry over in the tubing and the smoothing device than by depositing glass ejecta onto the wires. This phenomenon was not encountered in the small scale experiment using a small beam size (12 μm square) and a scan speed of 8 μm/s (Fig. 3h). In this experiment, the wires show the expected zero ppm La concentration, which strongly indicates that the laser did not deposit ejecta from the glass onto the wires. However, there are obvious apparent ‘hotspots’ of La (in yellow colour in Fig. 3h). We attribute these to larger particles generated during out-of-perfect-focus ablation of the glass. They are less obvious in the overview map, which was shot with a larger beam diameter, which is less sensitive to perfect focus (Fig. 3d).
Fig. 3. Overview (a–d) and detailed (e–h) LA-ICP-MS mapping experiments on the wire grid. Data reduction was carried out in Iolite as semi-quantitative and results are shown using CellSpace and ‘Images from integrations’ for Cu and La, with YellowHot colour scale. Mosaic images of the grid (a, e), recorded by the laser ablation software Chromium2.1, were used as base images for CellSpace spatially registered maps (b, f). The distinctive central node, with major (10 μm) protuberances marked with a white and a grey arrow (as in Fig. 1), is resolvable with a 12 μm square laser beam (e.g., see g).
162
T. Ubide et al. / Chemical Geology 409 (2015) 157–168
In addition to reproducing the grid wires very precisely, the Cu map of the detailed experiment was able to resolve aspects of the distinctive central node, with irregularities smaller than the beam size (Fig. 3f–g). Specifically, the two larger protrusions of 10 μm are resolvable (see white arrow and grey arrow in Figs. 1 and 3g), whereas the smaller (b7 μm) protrusions are not recognised (Fig. 3g). This defines the spatial resolution of detailed experiments with the specified characteristics at between 7 and 10 μm, i.e., better than the spot size. In terms of the quality of the images produced by different modules in Iolite (from the same data), the sharpness of the grid edges is crisper by ‘Images from integrations’ (Fig. 3). CellSpace has control over the x–y coordinates of the ablated spots, so it allows imaging irregular areas (Paul et al., 2012) whereas ‘Images from integrations’ forces the map to have a square or rectangular shape. Another difference is the ‘averaging’ of data. CellSpace averages data spatially, rather than just temporally, and hence removes outliers or ‘spiky’ data (such as when the concentrations in the ablated material are approaching the detection limits) as the spatial averaging incorporates data from overlying spots according to the degree of spot overlap (Paul et al., 2012). It should be noted that even though CellSpace assumes circular laser spots and our experiments used square spots, we see no impact on the quality of the images produced. A series of further experiments were performed on the grid and results of these are reported as electronic Supplementary material (Fig. S2). The purpose of these experiments was to explore two further possible controls over resolution. Firstly, experiments where the ablated area was at a significant angle with the grid like in Fig. 3, were compared with those arranging the ablation lines parallel to the visible features of the material (i.e., inclined relative to x–y). This showed that there was no excess blurring of edges when ablating at an angle and therefore, no benefit using inclined ablation lines. Secondly, the apparent sharpness of wire edges was compared in x and y, as a function of ablation direction. For example, it was anticipated that the y resolution could be better than that in x when ablating along x (due to smearing of the signal). But no measureable difference in x and y resolution was evident. These results imply that for cells with very fast washout, the orientation of the ablation area relative to the concentration pattern in the material is not critical. Thus, on our instrument, no advantage is gained by mapping orthogonal to expected crystal zoning. In summary, overlapping 24 or 12 μm laser spots, with scan speeds no faster than 3/4 of the beam diameter and repetition rates of 5 to 10 Hz, the z-spatial resolution of mapping is excellent (0.4–0.7 μm) and the x–y spatial resolution can resolve features smaller than the spot size. Cu maps benefitted from the extreme concentration contrast between the wires and the glass compared to La maps. On the other hand, the x–y resolution of our specific experiment may have been slightly compromised by the laser beam having been focused on the wire surface, located 20 μm above the glass substrate. 4.2. Mineral zoning Compositional zoning at the mineral scale was explored using three macrocrysts of an alkaline lamprophyre (Fig. 1). Clinopyroxene and amphibole were used due to their good preservation, complex compositional zoning and consistent calcium concentrations. Previous investigations came to the realisation that the cores of clinopyroxene and amphibole macrocrysts are often antecrysts in disequilibrium with the host groundmass (Ubide et al., 2014b). Antecrysts were interpreted as crystals recycled from previous stages in the magmatic system and often, they are overgrown by true phenocryst compositions cognate with the groundmass and eventually rimmed by more evolved compositions related to magma fractionation. Given the complexity in mineral zoning, Ubide et al. (2014b) combined petrographic and major element information to define a compositional scheme for these crystals: recycled antecryst compositions are denoted as ‘A’, with subtypes differentiated by adding lowercase letters (e.g., ‘Aa’, ‘Ab’, ‘Aj’) and further subtypes
differentiated by adding subscripts, which denote growth stratigraphy (e.g., ‘Aa1’, ‘Aa2’, ‘Aa3’); cognate phenocryst compositions are denoted as ‘P’; and fractionated rim compositions are denoted as ‘R’. In the present work, selected examples cover different crystal sizes and zoning patterns in order to explore LA-ICP-MS mapping capabilities. Results are shown in Figs. 4 to 6, where concentration values are quantitative for the mineral of interest and semi-quantitative for the other minerals (inclusions and groundmass microcrysts), due to different Ca concentrations and potential differences in their ablation characteristics. Crystal 1, the ‘little clinopyroxene’, is a 500 μm six-sided clinopyroxene macrocryst (Fig. 4a). Under the petrographic microscope, it shows three growth zones, including a wide pale-coloured core, a thin colourless mantle and a pink rim (Fig. 4a). Following the aforementioned scheme by Ubide et al. (2014b), the core and mantle zones have antecryst compositions (Aa3 and Ab, respectively), overgrown by an R-rim. From Aa3 to Ab, Mg and Si contents increase and Ti and Al contents decrease. From Ab to R, by contrast, Mg and Si contents decrease and Ti and Al contents increase. These findings were used to deduce a mafic recharge event into the magmatic system between the crystallisation of the Aa3-core and the crystallisation of the Ab-mantle of the crystal. LA-ICP-MS mapping results in Fig. 4b–i were obtained from a 2 h and 3 min experiment using a 24 μm square laser beam, 12 μm/s scan speed and a 5 Hz repetition rate, and analysing a total of 17 elements. Images obtained with both CellSpace and ‘Images from integrations’ modules in Iolite show a very sharply defined and prominent Cr-enrichment (up to 2000 ppm; Fig. 4b–c) in the Mg-rich zone related to mafic recharge. ‘Images from integrations’ can readily construct maps with logarithmic compositional scales. In crystals with very large concentration gradients, such as Cr in this clinopyroxene, the logarithmic scale map identifies the Aa3– Ab–R zoning much better (Fig. 4d) with Cr concentration decreasing from Ab ≫ Aa3 ≫ R. Log scale concentration images are also the best choice to create 3D maps, where the third dimension is used to add and compare compositional information to the colour-coded base map (Fig. 4h–i). Finally, ‘Images from integrations’ allows building RGB composite images of up to 3 elements by assigning Red, Green and Blue colours to the concentration of each element (e.g., Ca, Cr and Ni; Fig. 4g). These can also be used as a base map to add 3D information (Fig. 4i). Further compatible metals typically abundant in mafic, primitive magmas, such as Ni, also show enrichments in the Mg-rich zone (Fig. 4e). The ‘Trace_Elements_Image’ DRS (available as electronic supplementary material with this paper) makes it possible to calculate trace element ratios and map their distribution. Similar to Cr, values for the Cr/Ni ratio are intermediate in the core of the crystal, maximum in the recharge-driven mantle and at a minimum at the rim and within the groundmass (Fig. 4f). The 3D mapping ability allows a test of the assumption of constant Ca content in the zoned crystal. As can be seen from the Cr/Ni ratio base map onto which Ca counts per second was superimposed in the third dimension (Fig. 4h), the groundmass has a consistently lower Ca content than the clinopyroxene and there is very little Ca topography across the crystal. This feature is also useful for defining crystal edges on compositional maps in cases where there is only a weak concentration contrast between groundmass and crystal in trace elements but a sharp contrast in major elements. A further benefit of the 3D mapping capability is to explore the sharpness of concentration gradients. This can be appreciated in the map where a Ca–Cr–Ni RGB base map was used for superposition of the Cr/Ni ratio (Fig. 4i). This map shows the very sharp contrast between the high Cr/Ni ratio zone Ab and the much lower Cr/Ni rim R. The sharpness argues against a gradual change in Cr/Ni ratio from Ab to R, suggesting either that the two zones formed from different magmas or that the Cr/Ni ratio dropped very rapidly in response to a phase that sequestered Cr. Finally, by superimposing the ratio of two elements over their 2D distribution map, it is also possible to illustrate visually that the sharp increase in the Cr/Ni ratio in the Ab zone was caused by crystallisation from a magma with a very high Cr
T. Ubide et al. / Chemical Geology 409 (2015) 157–168
Fig. 4. a) Photomicrograph under ppl of the ‘little clinopyroxene’ (location 1 in Fig. 1) with three visible zones: Aa3-type core, Ab-type mantle and R-rim (following Ubide et al., 2014b). b–i) quantitative LA-ICP-MS compositional maps of several elements obtained from a single experiment using CellSpace (b) and ‘Images from integrations’ (c–i) with linear and logarithmic scales; log scales are particularly useful for adding compositional information in the third dimension (h–i). ColdWarm colour scale excepting g and i, which were built as RGB composite images of 3 traces. Element ratio distribution maps (e.g., Cr/Ni; see f, h and i) can be built with the ‘Trace_Elements_Image’ Data Reduction Scheme available as electronic Supplementary material with this paper. LA-ICP-MS mapping confirms that zone Ab grew in response to a mafic recharge event, which supplied the system with compatible elements.
content. In other words, the value of the ratio was more strongly influenced by Cr. Crystal 2, named the ‘elongated amphibole’, is a 4 mm amphibole macrocryst (Fig. 5a; see full length in Fig. 1). Petrographic observations
163
and electron microscopy indicated very simple zoning into a large and homogeneous, light orange P-phenocryst core and a thin, dark orange R-rim (normal zoning with Mg decreasing from P to R compositions; Ubide et al., 2014b). This macrocryst includes smaller crystals of clinopyroxene and opaque minerals (Cpx and Opq in Fig. 5a). LA-ICP-MS mapping experiments were carried out on one half of the crystal and its surrounding groundmass (Fig. 5b–e). For an initial map with a 24 μm square laser beam, the scan speed was increased to 36 μm/s to reduce the total experiment time to 2 h and 41 min. The repetition rate was 5 Hz, and a total of 5 elements were analysed. In spite of the rapid scan speed used, the mapping results on the amphibole were sharp (Fig. 5b–e). The Cr distribution map, shown using 3 different (out of 60) colour schemes available in Iolite (Fig. 5b–d), reproduces the inclusions as well as the marked compositional difference between the core and rim of the crystal, the latter having low Cr concentrations similar to the groundmass. More importantly, the map shows that the core of the crystal is not unzoned as anticipated from petrography and major element data. Rather, there is an inner core with contents in Cr over 1000 ppm that could have been inherited from a previous, more primitive magmatic stage. Its irregular shape suggests partial resorption upon incorporation within the new host magma. This demonstrates that LAICP-MS-mapping is able to unveil complexities in trace element concentrations undetectable with traditional methodologies such as petrography and major element investigations with SEM or EMP. It also provides more information than LA-ICP-MS spot analyses, as irregular features might not be expected and might easily be missed in spot selection. The 3D map built using Nb on top of the Cr distribution map (Fig. 5e) shows the opposite concentration pattern for these elements as would be expected from their incompatible vs. compatible behaviour, respectively. The Cr-rich core and inner core are depleted in Nb, whereas the Cr-poor rim and groundmass are clearly enriched in Nb. Unlike in the Cr/Ni map of the ‘little clinopyroxene’ (Fig. 4i), the transition from one zone to another is much more gradational for Nb and Cr in this amphibole. The inferred compositional gradient from core to rim could in this case be related to normal zoning reflecting a progressively evolving melt composition, or to the injection of sequential batches of more fractionated magma into the system. The comparison of maps of trace elements with very different charge to ionic radius ratios also permits to address the question of diffusion-induced features (Pilbeam et al., 2013). Although there are no absolute diffusivity data for Nb, this element has a very high charge to ionic radius ratio and in melts, shows the expected very low diffusion rates (Nakamura and Kushiro, 1998). The sharp nature of the boundary between the core and the rim zones seen in elements of higher and lower diffusivity (i.e., Cr, Ni vs. Nb) therefore strongly supports successive growth stages (Fig. 5) rather than diffusion phenomena. For the purpose of optimising the potential of the technique, crystal 3 or the ‘little amphibole’ was chosen to due to its clear zoning and small size (450 μm; Fig. 6a). The small mapping area (~500 × 500 μm) facilitated short experiment times and, therefore, repeat experiments in a single analytical session. The crystal is composed of a brown Aj-antecryst core, a light orange P-phenocryst mantle and a dark orange R-rim, where P compositions have the highest Mg contents (Ubide et al., 2014b) implying a mafic recharge event between the crystallisation of the core and the crystallisation of the mantle of the crystal. Successive mapping experiments were performed with a variety of instrument parameter combinations (Fig. 6b–e). The elements analysed were reduced to 3 to maximise individual dwell times, which were adjusted depending on the repetition rate. We measured Sc as a representative compatible element, Nb as a representative incompatible element and Ca as the internal standard. Initially, a standard set up with a 24 μm square laser beam, a scan speed of half that value (12 μm/s; following Ulrich et al., 2009) and a repetition rate of 5 Hz was used, with a total experiment time of 87 min (Fig. 6b). The results reproduce the zoning pattern accurately, with the mafic recharge event marked by elevated
164
T. Ubide et al. / Chemical Geology 409 (2015) 157–168
Fig. 5. a) Photomicrograph under ppl of the ‘elongated amphibole’ (location 2 in Fig. 1) with two visible zones: P-type core and R-rim (following Ubide et al., 2014b). b–e) quantitative LA-ICP-MS compositional maps obtained from a single experiment using logarithmic scales in ‘Images from integrations’. Results for Cr are displayed with 3 different colour scales: YellowHot (b), PlanetEarth (c) and ColdWarm (d; also used for the 3D map in e, with Nb superimposed in the third dimension). LA-ICP-MS mapping unveils a Cr-rich, Nb-poor, irregular inner core in this crystal.
Sc concentrations and depletion in Nb (see profile perpendicular to zoning). To increase efficiency and reduce analytical cost, our goal was to reduce experiment times. We therefore repeated the experiment keeping the same laser beam size but increasing the scan speed from 1/2 to 3/4 of the beam size value (18 μm/s), which decreased the total experiment time to 67 min (Fig. 6c–d). Using a repetition rate of 2 Hz produced too little signal and therefore blurry maps and spiky profiles that were unable to resolve the compositional difference between the mantle and the rim of the crystal (Fig. 6c). In subsequent experiments, however, we increased the repetition rate up to 10 Hz (Fig. 6d) and obtained maps as sharp as with the original, slower experiment, which took
50% more analytical time (compare to Fig. 6b). The only drawback of the higher repetition rates is deeper ablation of the sample. Regardless, the ablation depth was below 1 μm per experiment in all cases (Fig. 2f; see Section 4.1). Finally, we followed the opposite approach (Fig. 6e) to test if a better spatial resolution could be achieved with a smaller laser beam size as in the grid example (Fig. 3e–h). To overcome the reduction of analytical signal related to the reduction in spot size, we used high repetition rates to ablate more material. The experiment with the 12 μm square laser beam, a scan speed of 8 μm/s and a repetition rate of 10 Hz took 3 h and 39 min but significantly increased detail in the generated maps: the Sc map shows very crisp zone boundaries, identifies inclusions
Fig. 6. a) Photomicrograph under ppl of the ‘little amphibole’ (location 3 in Fig. 1) with three visible zones: Aj-type core, P-type mantle and R-rim (following Ubide et al., 2014b). b–e) quantitative LA-ICP-MS compositional maps obtained from successive experiments using a variety of different instrument parameter combinations. The images were produced for Sc using ‘Images from integrations’ with linear, ColdWarm-coloured scales. The black lines with white ends mark the location of three quantitative compositional profiles obtained per map with CellSpace, an average of which is shown below the map for Sc and Nb; note that the profiles can be constructed in any direction and here, they are constructed normal to the zoning seen in the maps. Overview experiments can produce sharp maps in little time using high repetition rates (d). Detailed experiments use a smaller laser beam to improve spatial resolution, e.g., resolving oscillatory zoning in the Sc-rich zone (e).
T. Ubide et al. / Chemical Geology 409 (2015) 157–168
precisely (see for instance the Sc-rich opaque mineral between the core and the mantle of the amphibole) and reveals extra complexity as oscillatory zoning during the growth of the Sc-rich mantle on the right-hand side of the crystal (Fig. 6e). This is also observed in the profile perpendicular to zoning (Fig. 6e), in contrast with those obtained from quicker experiments, with similar absolute concentrations but less detailed spatial resolution (e.g., Fig. 6d). Our results in clinopyroxene and amphibole show that LA-ICP-MS mapping has the potential to decipher magma history with unprecedented detail, by tracking compositional zoning at the trace element level. Maps can be built with different approaches (e.g., overview vs. detail) by simply adapting ablation and measuring parameters. Up to now, geochemical imaging has been largely undertaken through X-ray maps of element distributions using electron beam techniques (e.g., Costa et al., 2013; Ginibre et al., 2007). The significant advance with LA-ICPMS is that it is able to measure concentrations at ppm level, largely unattainable by EMP (Kamber, 2009; Wark and Watson, 2006). In electron microprobe analyses, limits of detection depend on beam current, size of the detector and whether more than one detector can be used at once (Kamber, 2009). Increasing beam currents decreases detection limits, but increases mobility of alkali elements (e.g., Na; Morgan and London, 2005). Even for those trace elements with low-enough detection limits, mapping the distribution of a single trace element in a crystal typically needs many hours of acquisition time. Here we propose a laserbased method that can map a 500 × 500 μm area in 1 h, measuring the concentration of up to ca. 15 elements. Besides obtaining maps of distribution of each trace element analysed, compositional data can be compared by using elemental ratios or 3D maps, and compositional profiles can be obtained directly from maps, in any direction of interest. 5. Discussion 5.1. Recommendations for LA-ICP-MS microchemical mapping The first significant finding of this study is the high degree of spatial reproducibility of multiple ablations of the same area (Figs. 2, 3, 6, S1). Combined with the sub-1 μm penetration depth per map, this feature permits many repeat ablations without the need for time-consuming repolishing. The following recommendations are specific to instruments (such as the Photon Machines Excite 193 nm excimer Ar–F laser system with a Helex 2-volume cell) with very high x–y stage reproducibility. Before committing the laboratory to LA-ICP-MS mapping, it is advisable to test the true size of the laser spots that will be employed for mapping. In our experience, the true spot diameter can vary by up to 0.5 μm from the nominal value. True spot dimensions are most easily quantified by repeat ablation (e.g., 5×) of the same area. This should be done by mapping areas via x-transposition of y-parallel lines and ytransposition of x-parallel lines. By choosing a transposition distance of 2 μm greater than the nominal spot diameter, the repeat ablation will result in a topography of wide, flat-floored ablated valleys with parallel ridges of unablated material. Using SEM imaging and/or WLI, it is possible to determine the exact x- and y-transposition distance required for seamless ablation from the width of the ridges. We strongly recommend using square or rectangular masks for repeat mapping as circular masks will lead to an excavation gradient away from the middle of the scanned line. A second significant finding of this study was the unexpected trace element concentration detail found in crystal zones that petrographically and compositionally looked homogenous. This warrants a two-step approach to mapping. In a first step, rapid maps (Figs. 3b–d, 6d) of possible areas of interest are produced to obtain an overview of internal chemical structure (e.g., Figs. 5d, 6d). These maps can be constructed for a number of elements (e.g., up to ca. 15). In our experience it is preferable to ablate the same overview area twice with two sets of analytes rather than producing a longer-lasting experiment with more analytes. Potentially, elements with similar chemical properties may be
165
represented by measuring just one (e.g., measuring La or Ce as representative of Light Rare Earth Elements). Before selecting analytes for experiments that will last several hours of expensive instrument time, we typically analyse a single traverse for a large number of elements. This will not only reveal the potentially most interesting analytes but will also help to define suitable dwell times for each analyte. Once overview maps have been constructed, more detailed maps of complex areas can be designed (e.g., Figs. 3f-h, 6e). The desired beam size is governed by the concentration of the elements that will be mapped, the sensitivity of the LA-ICP-MS, the scale of the anticipated chemical features, and the total area to be mapped. It is worth noting that the spatial resolution of the technique is greater than the laser beam size (Fig. 3) and that larger areas can be mapped in shorter times with a faster scan speed (Fig. 6). We found no advantage in restricting the scan distance per second to half the beam diameter (as proposed by Ulrich et al., 2009) but note that the system employed in this study has a very fast washout behaviour. Given the limited destructive nature of the technique with ablated depths of less than 1 μm in all experiments, it is advisable to use relatively high repetition rates (10 Hz), which can help to overcome the issues of small signals. In our experiments, we found that choosing dwell times of at least 30 ms for low abundance analytes helped to overcome pixelated concentration maps, which we regard as artefacts associated with converting a few counts registered during a short dwell time to counts per second. On our system, the orientation of the ablation direction (horizontal, vertical, inclined) has no significant effect on the outcome of the maps (see Fig. S2). There is therefore no particular advantage in orienting the ablation area orthogonal to the crystal. If there is a very large concentration gradient from groundmass (high) to crystal (low), it may be advantageous to produce half maps of crystals, starting the ablation in the centre of the crystal and ablating outwards into the groundmass to avoid carry-over effects in the opposite direction. Iolite offers a variety of data reduction schemes that can be adapted by users, such as in the present study, where functionality was added to calculate concentration ratios, for which maps can then be generated. We regard the ability to produce element ratios maps as critical for visualising the relationship of compositional zoning in igneous crystals (Fig. 4f, i). Two principle ways for image construction were used. The first is ‘Images from integrations’. Its chief advantage is the great flexibility in map construction, including 3D visualisation. A disadvantage compared to CellSpace is that it requires square or rectangular ablation areas, which waste analysis time on areas of little interest (e.g., the groundmass). If the mapping experiments are designed over a nonrectangular area restricted to the object of interest alone, CellSpace is a better option for mapping, as mass spectrometer data are spatially registered using the x–y coordinates from the laser files. Also, if the mapped element has concentrations close to the detection limit, the spatial data averaging approach employed by CellSpace downplays the importance of outliers. Finally, CellSpace permits constructing compositional profiles from the map. Rather than obtaining a raster analysis across a crystal, it is advisable to visualise the internal chemical structure by mapping first and then, use the map to obtain profiles in the direction of interest (e.g., perpendicular to zoning, Fig. 6). Fully quantitative maps require the use of an internal elemental standard with constant concentrations in the sample, to account for its ablation characteristics. Here we used calcium for clinopyroxene and amphibole, previously analysed by EMP. For minerals like plagioclase, silicon would be a better option. When mapping multi-phase assemblages, one would need to break the images into segments, or use the ‘MinMapping’ approach as described in Paul et al. (2014). If there is no internal elemental standard available, such as in our grid experiments, data reduction can still be carried out using semi-quantitative mode (Fig. 3). Finally, even though focusing is key in LA-ICP-MS analytical work, we have shown that our approach can be successfully applied to slightly irregular surfaces such as a wire grid mounted 20 μm over a glass slide
166
T. Ubide et al. / Chemical Geology 409 (2015) 157–168
substrate (Fig. 3). Therefore, not having a perfectly polished sample should not be an obstacle to successful LA-ICP-MS mapping unless very small beams (b10 μm) are being employed. 5.2. New insights into magma history The studied lamprophyre (Fig. 1) is a shallow exposure of a complex magmatic system in which mafic minerals crystallised in deep magma chambers or reservoirs. These crystals were evidently recycled and eventually incorporated into ascending melts (Ubide et al., 2014b). The variety of crystal populations in the studied rock, dominated by recycled antecryst cores, provides a wealth of information on the multiple processes that conditioned the emplacement of these magmas. Previous studies used traditional methodologies such as petrography,
major element mineral chemistry, barometric estimates and LA-ICPMS spot analyses to reconstruct the complex magma plumbing system (Ubide et al., 2014a, 2014b). LA-ICP-MS mapping results presented in this study (Figs. 4–6) are a further step towards more refined understanding of magmatic processes and their link to the onset of volcanic eruptions, as explained below and sketched in Fig. 7. In the studied case, injection of mafic melts into fractionating magma chambers or reservoirs, previously suggested from major element data (Ubide et al., 2014b), are particularly well reflected in LA-ICP-MS maps of compatible elements such as Cr, Ni or Sc (Fig. 7). Zone Ab in the ‘little clinopyroxene’ correlates with mafic recharge into an upper mantle reservoir, previously producing Aa-cores. Zone P in the ‘little amphibole’ correlates with mafic recharge into a lower crust reservoir, previously producing Aj-cores. Mixing of the incoming
Fig. 7. Conceptual sketch of the magmatic plumbing system related to the studied camptonite, adapted and enhanced from previous work (see Fig. 15 in Ubide et al., 2014b, western sector) using quantitative information from the LA-ICP-MS mapping experiments (maps of distribution of compatible trace elements on clinopyroxene and amphibole macrocrysts; Figs. 4d, 5d, 6d). Compositional types in crystals occurring in the studied lamprophyre intrusion are colour-matched with compositional types of magmas in the plumbing system, unravelling the history of magma pulses and magma evolution at depth. Not to scale.
T. Ubide et al. / Chemical Geology 409 (2015) 157–168
magma with the resident magma likely increased magma mobility and triggered its ascent towards the surface (e.g., Kent et al., 2010). The ascending magma carried recycled crystal cores and underwent fractionation during ascent and emplacement, controlling the crystallisation of crystal rims (zone R in all analysed crystals; Fig. 7) and groundmass microcrysts. Further complexity was discovered in certain crystals implying a magmatic story even more intricate than previously considered. The ‘little amphibole’ shows oscillatory zoning during the growth of the Sc-rich zone (Fig. 6e), suggesting not only one but repeated events of mafic recharge into the crustal reservoir (yellow arrows in Fig. 7). The core of the ‘elongated amphibole’, previously considered homogeneous, has an inner core with a more primitive, Cr-rich composition and evidence of partial resorption (Figs. 5, 7). This discovery suggests that an additional, hydrated magmatic stage conditioned the formation of primitive amphibole crystals, later resorbed due to recycling into a new melt from which the final homogenous P-core formed (see relict yellow composition overgrown by red on the right-hand side of the crustal magma reservoir in Fig. 7). It is worth noting that the ‘elongated amphibole’ does not appear to record mafic recharge, in spite of being the largest crystal analysed. This could be due to this crystal being located within the crystal mush where it did not record this event. Alternatively, it could have crystallised following recharge but in a separate area of the system without evolved Aj-cores (right-hand side of the crustal magma reservoir in Fig. 7). The different behaviour of Cr and Ni in the ‘little clinopyroxene’ (Fig. 4d–e) is interesting as it reflects the role of olivine crystallisation over time in a rock where olivine itself is unsuitable for analysis given its pervasive alteration. Namely, the Aa3-core of the ‘little clinopyroxene’ has moderate concentrations in Cr (Fig. 4d) implying crystallisation from a mafic magma, but low concentrations in Ni (Fig. 4e) revealing coeval formation of olivine. By contrast, the high concentrations in Ni in the groundmass imply no crystallisation of olivine at that time. These interpretations are in agreement with the abundant olivine macrocrysts (pseudomorphed; Fig. 1) and the lack of olivine microcrysts in the groundmass of the rock. 3D mapping permits exploring the sharpness of concentration gradients. Combining trace element concentrations with elemental ratios broadens the possibilities of the technique to explore magma evolution and fractionation. The very sharp increase in Cr/Ni at the Ab-mantle of the ‘little clinopyroxene’ (Fig. 4i) supports injection of a new magma into the system, whereas the smoother increase in Nb at the rim of the ‘elongated amphibole’ (Fig. 5e) agrees with normal magma fractionation from zones P to R (Fig. 7). LA-ICP-MS maps can be used to delimit crystal growth zones and obtain average compositional data for individual mineral zones to be used in further petrogenetic studies. Compositional traverses across zoning patterns, crucial for calculating timescales of magmatic processes from diffusion modelling (e.g., Costa et al., 2003; Costa and Chakraborty, 2004; Ruprecht and Plank, 2013), can be obtained as customised profiles from CellSpace maps (Paul et al., 2012). These profiles (e.g., Fig. 6) have a significant improvement over individual ablation lines: they are built from and preceded by a compositional map that permits defining the internal structure and zoning pattern of the crystal. Compositional profiles perpendicular to zoning are best for the investigation of magma history, particularly for hunting mafic recharge events implied as eruption triggers (e.g., Kent et al., 2010). The potential of the technique is enhanced by the fact that a large amount of information can be obtained with very little extra sample preparation (polished thin sections or pucks are mostly used). The method is rapid (all experiments presented in this paper took 30 min to 3.5 h and produced maps for up to ca. 15 elements) and experiment design and data reduction are straightforward (overall for the experiments presented in this paper, both experiment preparation and the whole process of data reduction, construction of maps and analysis of the results took 30 min to 1 h). Hence, an increasing number of
167
investigations using the technique are envisaged in magmatic or other microchemical studies. 6. Conclusions LA-ICP-MS mapping experiments on clinopyroxene and amphibole crystals of varied sizes and zoning patterns produced sharp trace element distribution maps that are a very visual reflection of magma history. Further to mineral zoning recognised using traditional methodologies such as petrography, SEM, EMP or LA-ICP-MS spot analyses, LA-ICP-MS mapping unveiled additional compositional structure, such as a primitive, partly resorbed inner core in the ‘elongated amphibole’, and oscillatory zoning related to repeated mafic recharge in ‘the little amphibole’. Maps can also be used to create profiles in any direction (e.g., perpendicular to zoning). Several trace elements can be mapped simultaneously and in very little experiment time, opening a new window for investigation of more subtle variations in magma chemistry and better reconstruction of magma history and magma plumbing systems. LA-ICP-MS mapping: • is a rapid technique regarding sample preparation, laboratory experiments and data reduction; • is an ‘only slightly’ destructive technique, as each mapping experiment removes less than 1 μm of ablated material. This, together with the high degree of spatial reproducibility, permits multiple mapping experiments on the same area; • is a medium to high resolution technique able to resolve complexities in the sample smaller than the laser beam size.
We recommend: • a two-step approach to mapping: 1) starting with rapid overview maps to identify zones of particular complexity; 2) mapping areas of interest in detail; • to design the mapping experiment as a square or rectangle built from overlapped ablation lines, built in turn from overlapped ablation squares; • to use scan speeds higher than half the beam size and relatively high repetition rates (10 Hz) to reduce experiment time; • to define dwell times for individual elements according to relative abundance, a preliminary concentration check in the sample and so that the maximum cumulative dwell time is dictated by the repetition rate.
Future advances will focus on the optimisation of the technique for other minerals such as feldspars and olivine. In addition, it will become feasible to combine data for identical map areas obtained as subsequent experiments. This will permit the calculation of more element ratios than is possible from single experiment maps for only few elements. It may also permit the combination of data from elemental and isotopic (e.g., Sr and Pb) experiments obtained on different instruments (e.g., quadrupole and multi-collector ICP-MS). Combined elemental and isotopic maps will ultimately be able to differentiate between crystallisation of batches of variably differentiated consanguineous magma versus injection of extraneous magma into complex plumbing systems. Supplementary data to this article can be found online at http://dx. doi.org/10.1016/j.chemgeo.2015.05.020. Acknowledgements This research was funded by Science Foundation Ireland grant SFI/ 12/ERC/E2499. We thank Heath Bagshaw and Neal Leddy from the Centre for Microscopy and Analysis (Trinity College Dublin, Ireland) for
168
T. Ubide et al. / Chemical Geology 409 (2015) 157–168
their assistance with SEM and WLI analyses. We are very grateful to Bence Paul (University of Melbourne, Australia) for his continued support for mapping in CellSpace and to Joe Petrus (Laurentian University, Canada) for his help with the use of Iolite. Stijn Van Malderen (Ghent University, Belgium) made the very useful suggestion of using a high precision grid to investigate spatial resolution. The study also benefitted from constructive discussions with other attendees of the European Workshop on Laser Ablation 2014 at the Royal Holloway University of London (UK), and particularly with Philipp Ruprecht (Columbia University, USA), Chris Ottley (Durham University, UK) and Simon Jackson (Geological Survey of Canada). We acknowledge very constructive suggestions by two anonymous reviewers as well as editorial handling by Klaus Mezger. Special thanks to Claire Kamber for her help sketching the magma plumbing system in Fig. 7. This study would not have been possible without the comprehensive previous investigation of the studied lamprophyre with the help of Carlos Galé, Patricia Larrea, Marceliano Lago and Enrique Arranz (Universidad de Zaragoza, Spain). References Bellucci, J.J., Nemchin, A.A., Whitehouse, M.J., Humayun, M., Hewins, R., Zanda, B., 2014. Pb-isotopic evidence for an early, enriched crust on Mars. Earth Planet. Sci. Lett. 410, 34–41. http://dx.doi.org/10.1016/j.epsl.2014.11.018. Bussweiler, Y., Foley, S.F., Prelevic, D., Jacob, D.E., 2015. The olivine macrocryst problem: new insights from minor and trace element compositions of olivine from Lac de Gras Kimberlites, Canada. Lithos http://dx.doi.org/10.1016/j.lithos.2015.02.016. Charlier, B.L.A., Wilson, C.J.N., Lowenstern, J.B., Blake, S., Van Calsteren, P.W., Davidson, J.P., 2005. Magma generation at a large, hyperactive silicic volcano (Taupo, New Zealand) revealed by U–Th and U–Pb systematics in zircons. J. Petrol. 46 (1), 3–32. http://dx. doi.org/10.1093/petrology/egh060. Costa, F., Chakraborty, S., 2004. Decadal time gaps between mafic intrusion and silicic eruption obtained from chemical zoning patterns in olivine. Earth Planet. Sci. Lett. 227, 517–530. http://dx.doi.org/10.1016/j.epsl.2004.08.011. Costa, F., Chakraborty, S., Dohmen, R., 2003. Diffusion coupling between trace and major elements and a model for calculation of magma residence times using plagioclase. Geochim. Cosmochim. Acta 67 (12), 2189–2200. http://dx.doi.org/10.1016/S00167037(00)01345-5. Costa, F., Andreastuti, S., Bouvet de Maisonneuve, C., Pallister, J.S., 2013. Petrological insights into the storage conditions, and magmatic processes that yielded the centennial 2010 Merapi explosive eruption. J. Volcanol. Geotherm. Res. 261, 209–235. http://dx.doi. org/10.1016/j.jvolgeores.2012.12.025. Davidson, J.P., Morgan, D.J., Charlier, B.L.A., Harlou, R., Hora, J.M., 2007. Microsampling and isotopic analysis of igneous rocks: implications for the study of magmatic systems. Annu. Rev. Earth Planet. Sci. 35, 273–311. http://dx.doi.org/10.1146/annurev.earth. 35.031306.140211. Francalanci, L., Avanzinelli, R., Nardini, I., Tiepolo, M., Davidson, J.P., Vannucci, R., 2012. Crystal recycling in the steady-state system of the active Stromboli Volcano: a 2.5-ka story inferred from in situ Sr-isotope and trace element data. Contrib. Mineral. Petrol. 163, 109–131. http://dx.doi.org/10.1007/s00410-011-0661-0. Gill, J., Reagan, M., Tepley, F., Malavassi, E., 2006. Arenal volcano, Costa Rica. Introduction. J. Volcanol. Geotherm. Res. 157, 1–8. http://dx.doi.org/10.1016/j.jvolgeores.2006.03.034. Ginibre, C., Wörner, G., Kronz, A., 2007. Crystal zoning as an archive for magma evolution. Elements 3 (4), 261–266. http://dx.doi.org/10.2113/gselements.3.4.261. Hellstrom, J.C., Paton, C., Woodhead, J.D., Hergt, M., 2008. Iolite: software for spatially resolved LA–(quad and MC) ICP–MS analysis. In: Sylvester, P. (Ed.), Laser ablation ICP–MS in the Earth sciences: current practices and outstanding issues. Mineralogical Association of Canada, Short Course Series 40, pp. 343–348. Hildreth, W., Wilson, C.J.N., 2007. Compositional zoning of the Bishop Tuff. J. Petrol. 48 (5), 951–999. http://dx.doi.org/10.1093/petrology/egm007. Jerram, D.A., Martin, V.M., 2008. Understanding crystal populations and their significance through the magma plumbing system. In: Annen, C., Zellmer, G.F. (Eds.), Dynamics of Crustal Magma Transfer, Storage and Differentiation. Geological Society, London, 304. Special Publications. Jochum, K.P., Weis, U., Stoll, B., Kuzmin, D., Yang, Q., Raczek, I., Jacob, D.E., Stracke, A., Birbaum, K., Frick, D.A., Günther, D., Enzweiler, J., 2011. Determination of reference values for NIST SRM 610-617 glasses following ISO guidelines. Geostand. Geoanal. Res. 35, 397–429. http://dx.doi.org/10.1111/j.1751-908X.2011.00120.x. Kamber, B.S., 2009. Geochemical fingerprinting: 40 years of analytical development and real world applications. Appl. Geochem. 24, 1074–1086. http://dx.doi.org/10.1016/j. apgeochem.2009.02.012. Kent, A.J.R., 2013. Preferential eruption of andesitic magmas: implications for volcanic magma fluxes at convergent margins. In: Gómez-Tuena, A., Straub, S.M., Zellmer, G.F. (Eds.), Orogenic Andesites and Crustal Growth. Geological Society, London, Special Publications 385. http://dx.doi.org/10.1144/SP385.10. Kent, A.J.R., Darr, C., Koleszar, A.M., Salisbury, M.J., Cooper, K.M., 2010. Preferential eruption of andesitic magmas through recharge filtering. Nat. Geosci. 3, 631–636. http:// dx.doi.org/10.1038/NGEO924.
Larrea, P., França, Z., Lago, M., Widom, E., Galé, C., Ubide, T., 2013. Magmatic processes and the role of antecrysts in the genesis of Corvo Island (Azores Archipelago, Portugal). J. Petrol. 54 (4), 769–793. http://dx.doi.org/10.1093/petrology/egs084. Longerich, H.P., Jackson, S.E., Günther, D., 1996. Laser ablation inductively coupled plasma mass spectrometric transient signal data acquisition and analyte concentration calculation. J. Anal. At. Spectrom. 11, 899–904. Longpré, M.A., Klügel, A., Diehl, A., Stix, J., 2014. Mixing in mantle magma reservoirs prior to and during the 2011–2012 eruption at El Hierro, Canary Islands. Geology 42 (4), 315–318. http://dx.doi.org/10.1130/G35165.1. Morgan, G.B., London, D., 2005. Effect of current density on the electron microprobe analysis of alkali aluminosilicate glasses. Am. Mineral. 90, 1131–1138. http://dx.doi.org/ 10.2138/am.2005.1769. Myers, M.L., Geist, D.J., Rowe, M.C., Harpp, K.S., Wallace, P.J., Dufek, J., 2014. Replenishment of volatile-rich mafic magma into a degassed chamber drives mixing and eruption of Tungurahua Volcano. Bull. Volcanol. 76, 872. http://dx.doi.org/10.1007/ s00445-014-0872-0. Nakamura, E., Kushiro, I., 1998. Trace element diffusion in jadeite and diopside melts at high pressures and its geochemical implication. Geochim. Cosmochim. Acta 62 (18), 3151–3160. Paton, C., Hellstrom, J., Paul, B., Woodhead, J., Hergt, J., 2011. Iolite: freeware for the visualisation and processing of mass spectrometric data. J. Anal. At. Spectrom. 26 (12), 2508–2518. http://dx.doi.org/10.1039/c1ja10172b. Paul, B., Woodhead, J.D., Hergt, J., Danyushevsky, L., Kunihiro, T., Nakamura, E., 2011. Melt inclusion Pb-isotope analysis by LA–MC-ICPMS: assessment of analytical performance and application to OIB genesis. Chem. Geol. 289, 210–223. http://dx.doi.org/ 10.1016/j.chemgeo.2011.08.005. Paul, B., Paton, C., Norris, A., Woodhead, J., Hellstrom, J., Hergt, J., Greig, A., 2012. Cell Space: a module for creating spatially registered laser ablation images within the Iolite freeware environment. J. Anal. At. Spectrom. 27, 700–706. http://dx.doi.org/ 10.1039/c2ja10383d. Paul, B., Woodhead, J.D., Paton, C., Hergt, J.M., Hellstrom, J., Norris, C.A., 2014. Towards a method for quantitative LA-ICP-MS imaging of multiphase assemblages: mineral identification and analysis correction procedures. Geostand. Geoanal. Res. 38 (3), 253–563. http://dx.doi.org/10.1111/j.1751-908X.2014.00270.x. Pilbeam, L.H., Nielsen, T.F.D., Waight, T.E., 2013. Digestion fractional crystallization (DFC): an important process in the genesis of kimberlites. evidence from olivine in the Majuagaa Kimberlite, southern west Greenland. J. Petrol. 54 (7), 1399–1425. http:// dx.doi.org/10.1093/petrology/egt016. Reubi, O., Blundy, J.A., 2007. A dearth of intermediate melts at subduction zone volcanoes and the petrogenesis of arc andesites. Nature 461, 1269–1273. http://dx.doi.org/10. 1038/nature08510. Rittner, M., Müller, W., 2012. 2D mapping of LA-ICPMS trace element distributions using R. Comput. Geosci. 42, 152–161. http://dx.doi.org/10.1016/j.cageo.2011.07.016. Ruprecht, P., Plank, T., 2013. Feeding andesitic eruptions with a high‐speed connection from the mantle. Nature 500, 68–72. http://dx.doi.org/10.1038/nature12342. Sakyi, P.A., Tanaka, R., Kobayashi, K., Nakamura, E., 2012. Inherited Pb isotopic records in olivine antecryst-hosted melt inclusions from Hawaiian lavas. Geochim. Cosmochim. Acta 95, 169–195. http://dx.doi.org/10.1016/j.gca.2012.07.025. Saunders, K., Buse, B., Kilburn, M.R., Kearns, S., Blundy, J., 2014. Nanoscale characterisation of crystal zoning. Chem. Geol. 364, 20–32. http://dx.doi.org/10.1016/j.chemgeo.2013. 11.019. Streck, M., 2008. Mineral textures and zoning as evidence for open system processes. Rev. Mineral. Geochem. 69, 595–622. Ubide, T., 2013. The Cretaceous Alkaline Magmatism in Northeast Iberia. Igneous Processes and Geodynamic Implications PhD Thesis. Universidad de Zaragoza, Spain. Ubide, T., Galé, C., Arranz, E., Lago, M., Larrea, P., 2014a. Clinopyroxene and amphibole crystal populations in a lamprophyre sill from the Catalonian coastal ranges (NE Spain): a record of magma history and a window to mineral–melt partitioning. Lithos 184–187, 225–242. http://dx.doi.org/10.1016/j.lithos.2013.10.029. Ubide, T., Galé, C., Larrea, P., Arranz, E., Lago, M., 2014b. Antecrysts and their effect on rock compositions: the Cretaceous lamprophyre suite in the Catalonian Coastal Ranges (NE Spain). Lithos 206–207, 214–233. http://dx.doi.org/10.1016/j.lithos.2014.07.029. Ubide, T., Wijbrans, J.R., Galé, C., Arranz, E., Lago, M., Larrea, P., 2014c. Age of the Cretaceous alkaline magmatism in northeast Iberia: implications for the Alpine cycle in the Pyrenees. Tectonics 33, 1444–1460. http://dx.doi.org/10.1002/2013TC003511. Ulrich, T., Kamber, B.S., Jugo, P.J., Tinkham, D.K., 2009. Imaging element-distribution patterns in minerals by laser ablation–inductively coupled plasma–mass spectrometry (LA–ICP–MS). Can. Mineral. 47 (5), 1001–1012. http://dx.doi.org/10.3749/canmin. 47.5.1001. Wark, D.A., Watson, E.B., 2006. TitaniQ: a titanium-in-quartz geothermometer. Contrib. Mineral. Petrol. 152, 743–754. Woodhead, J., Hellstrom, J., Hergt, J., Greig, A., Maas, R., 2007. Isotopic and elemental imaging of geological materials by laser ablation inductively coupled plasma-mass spectrometry. Geostand. Geoanal. Res. 31, 331–343. http://dx.doi.org/10.1111/j.1751908X.2007.00104.x. Woodhead, J., Hellstrom, J., Paton, C., Hergt, J., Greig, A., Maas, R., 2008. A guide to depth profiling and imaging applications of LAICP-MS. In: Sylvester, P. (Ed.), Laser ablation ICP-MS in the Earth sciences: current practices and outstanding issues. Mineralogical Association of Canada, Short Course Series 40, pp. 135–145.